2631
Smaller is better: Averaging mass considerations for the assessment of RF power deposition and MR safety of small implants1Berlin Ultrahigh Field Facility (B.U.F.F.), Max Delbrück Center for Molecular Medicine in the Helmholtz Association, Berlin, Germany, 2Experimental and Clinical Research Center (ECRC), a joint cooperation between the Charité Medical Faculty and the Max Delbrück Center for Molecular Medicine in the Helmholtz Association, Berlin, Germany, 3MRI.TOOLS GmbH, Berlin, Germany
Synopsis
Assessment of the specific absorption rate (SAR) is a crucial tool when investigating the MR safety of implants. For RF power deposition assessments, local SAR averaged over m=10g of tissue is standard. Given the density in the human body (ρ≈1g/cm³), this translates into a volume of ≈2x2x2cm³, which largely exceeds the size of many small implants and bears the risk of heavy underestimation of local peak SAR. Realizing these constraints together with the opportunities, we investigated discrete SAR averaging masses from mave=1g to mave=0.01g to define SAR averaging masses suitable for the safety assessment of small implants.
Introduction
For RF power deposition assessments local SAR averaged over m=10g of tissue is standard1. This volume (≈2x2x2cm³) largely exceeds the size of many small implants and bears the risk of heavy underestimation of local peak SAR2,3,4. Point SAR quantifies the power deposited in a small volume matching the simulated resolution, provides high spatial accuracy but is highly susceptible to changes in simulated mesh size. Realizing these constraints together with the opportunities, we investigated discrete SAR averaging masses from mave=1g to mave=0.01g to define SAR averaging masses suitable for the safety assessment of small implants.Methods
EMF Simulations:
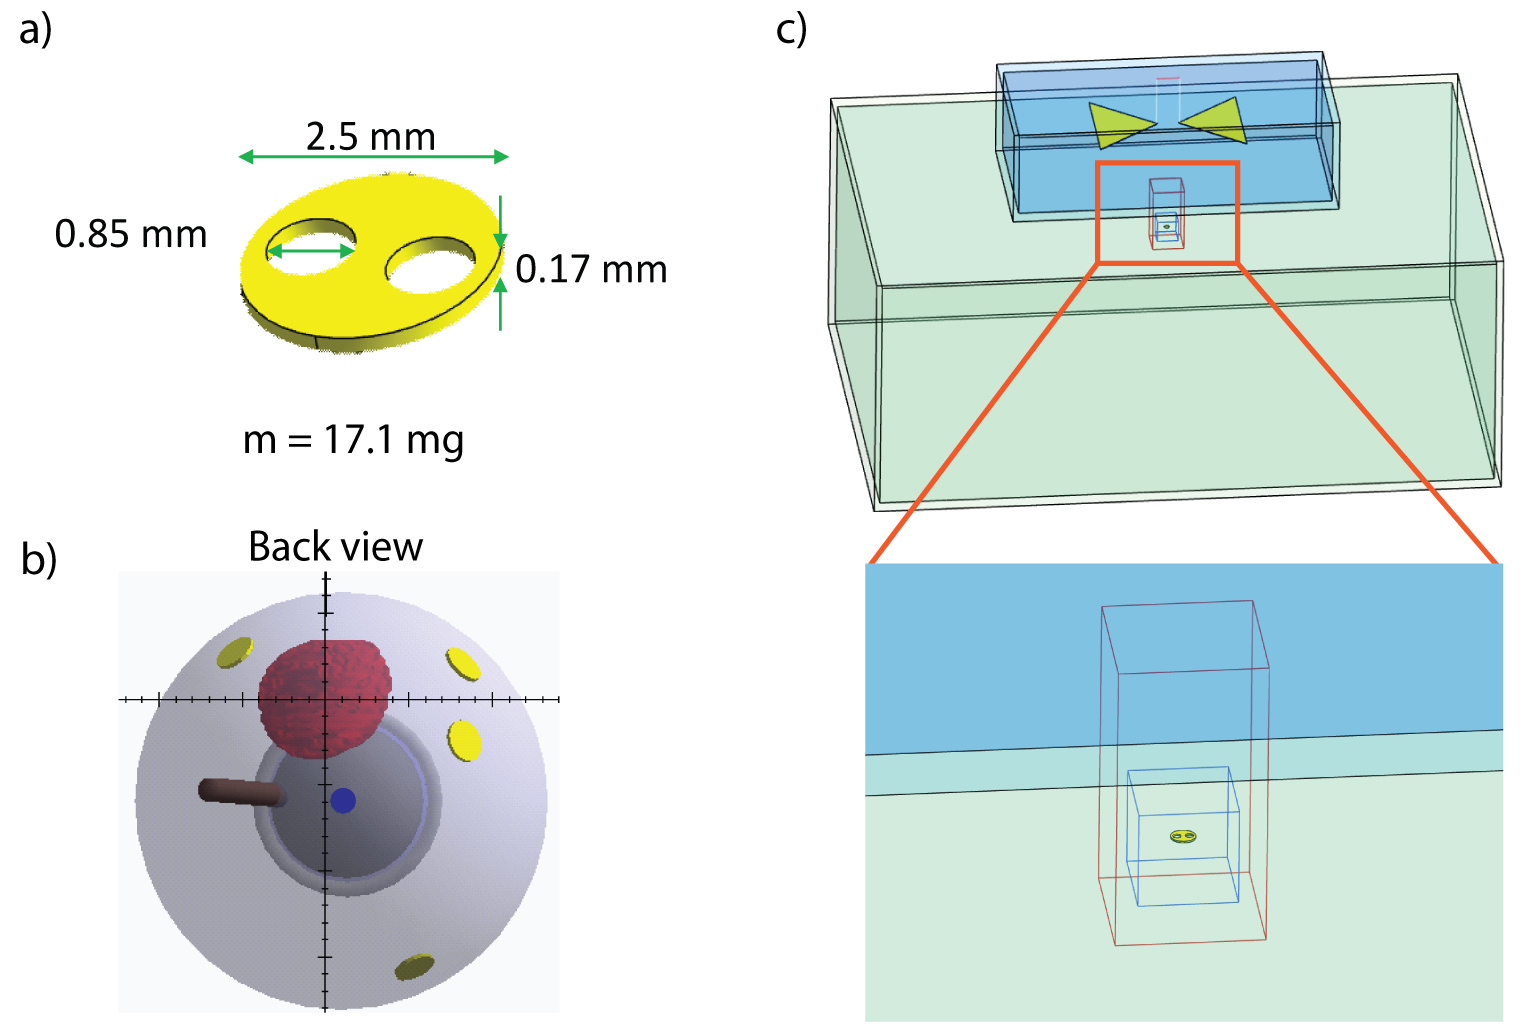
Radiofrequency-induced heating was evaluated through SAR and temperature in tissue simulating material (TSM) around a small implant (Fig.1a) used in proton beam therapy of ocular tumors5,6. EMF simulations (f=298MHz, 7.0Tesla) were conducted with the FDTD method (Sim4Life,V2.0,ZMT,Zurich,Switzerland). The implant was placed in a rectangular phantom (Fig.1c) filled with TSM (sclera7:σ=0.94S/m, ε=79, ρ=1.041g/cm³). A virtual bowtie antenna8 was used for RF-transmission (Pin,peak=1W;Fig.1c). SAR increase was studied as a function of the distance d between the antenna and the implant (d=15-30mm) and of the rotation perpendicular (γ⊥) to the E-field (0° to 90°).
SAR Assessment:
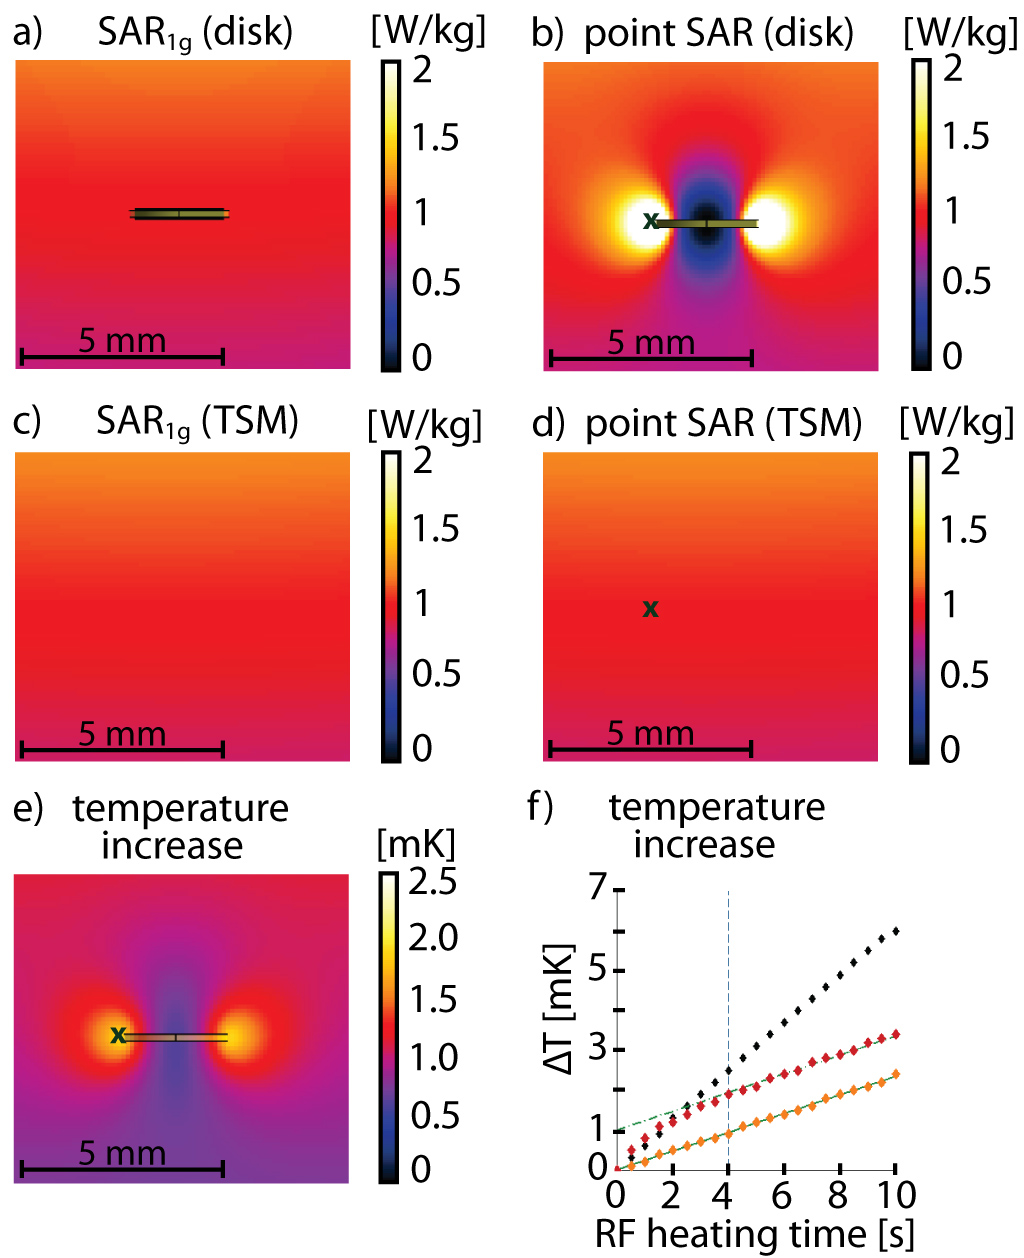
The SAR averaging mass should predict an RF power distribution reflecting the spatial extent of the heating caused by the implant(Fig.2e). For long RF heating periods of small implants, the implant induced temperature increase is surpassed by the baseline heating generated by the RF antenna2, showing the same slope ΔT/dt with and without the device under investigation(Fig.2f). For this reason our focus was on finding a way to quantify and compare SAR and temperature hot spots for the identification of SAR averaging masses suitable for small implants.
Results
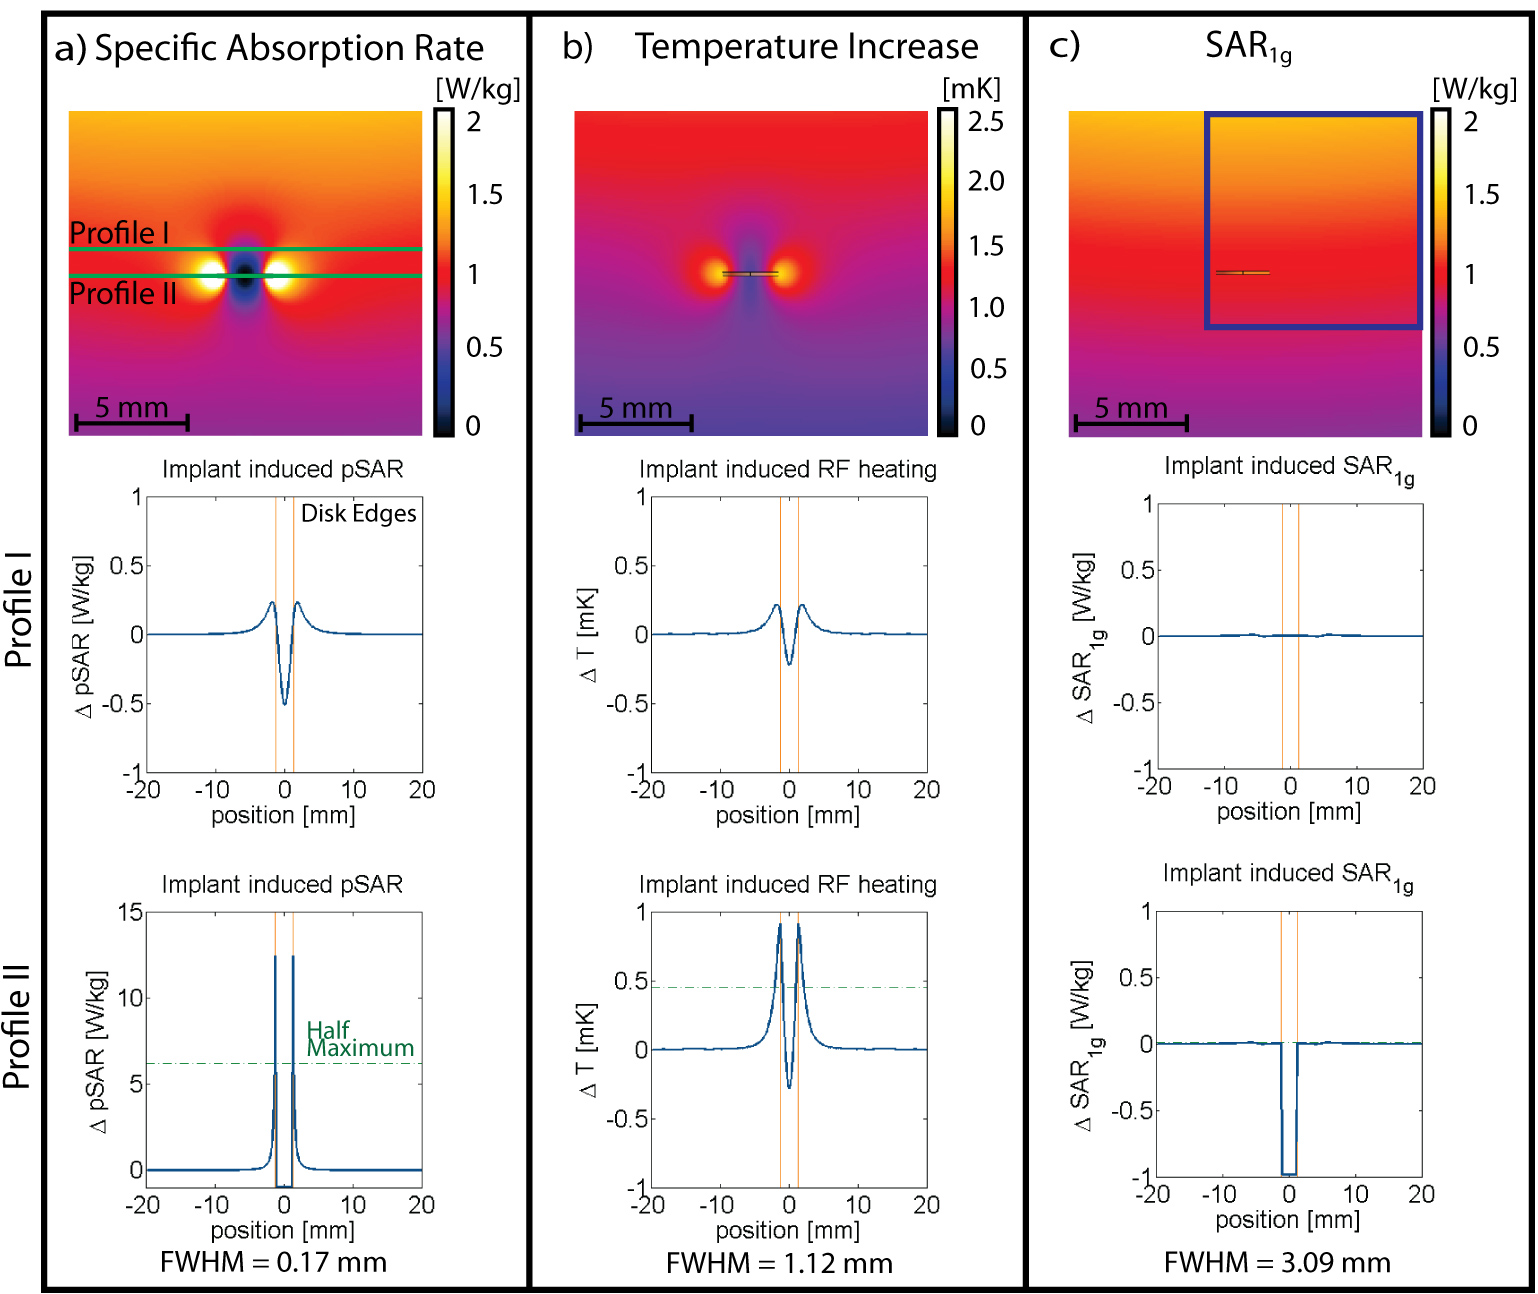
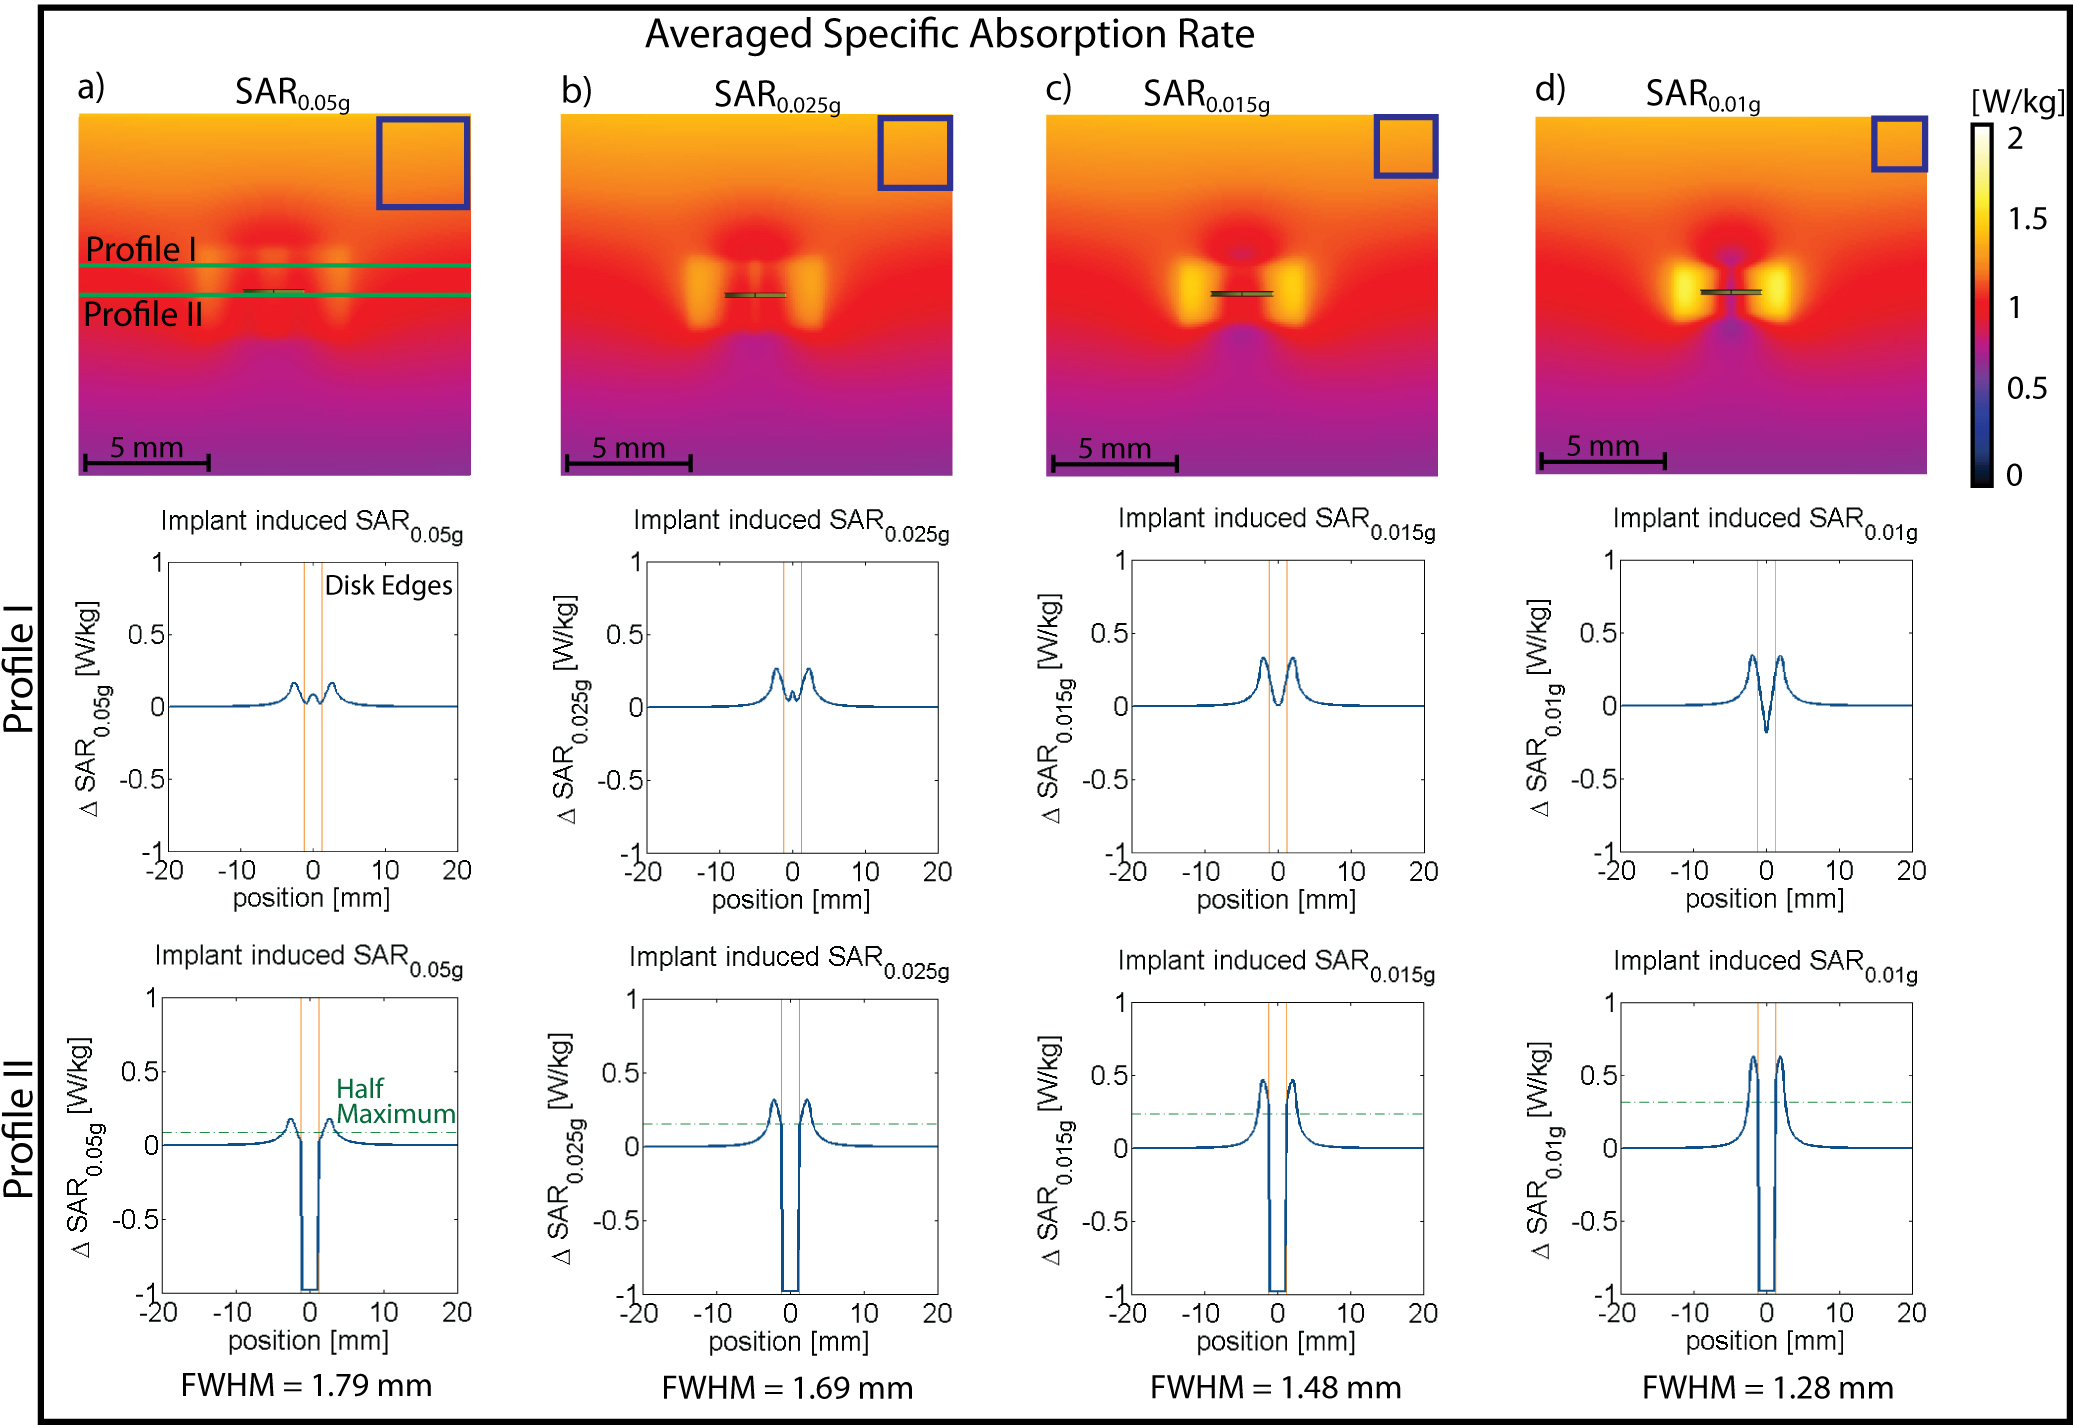
Point SAR(Fig.3a), temperature(Fig.3b) and SARave(Fig.3c) distributions were evaluated along profiles parallel to the long axis of the RF antenna(Fig.3a). To assess SAR and temperature increase caused by the implant, the baseline obtained for TSM was subtracted. ΔSAR-profiles were evaluated at two distances to the antenna. Profile I (Fig.3) was placed at a depth of d=23.95mm(Fig.3a), being slightly above the implant, investigating the overlapping of the two peaks. Profile II (d=24.95mm) covers the location of the SARmax and the implant. To quantify the hotspot size, the full width at half maximum (FWHM) was calculated for the left peak of profile II of ΔpointSAR, ΔT and ΔSARave(Fig.3+4). The distance between the two hot spots (i.e. the diameter of the implant) is 2.5mm. For accurate depiction, the Nyquist theorem requires sampling with a resolution of 1.25mm10. In the TSM (ρ=1.04g/cm³), this yields an averaging mass of only mave=0.002g. Not only is this mass a factor of 500 smaller than the smallest commonly used averaging mass of SAR1g, it can be also debated as to what extent the computational downscaling of investigated spatial distributions is still applicable to the complex (thermoregulatory) system of the human body. Addressing this limitation, we identified largest averaging volume still accurately depicting the peak of the ΔT-profile. The acceptable discrepancy between FWHM(ΔT) and FWHM(ΔSAR) was set at 15%. Profile I showed the expected increase of SARave above the implant center for all averaging masses. For mave>0.015g, a third hotspot appeared(Fig.4a,b) by the overlapping of the two peaks, underlining the need for a smaller averaging volume. Together with the evaluation of profile II, this returned a SAR averaging mass of mave=0.01g (Fig.4d), resulting in a cube length of a0.01g=2.1mm in the TSM.
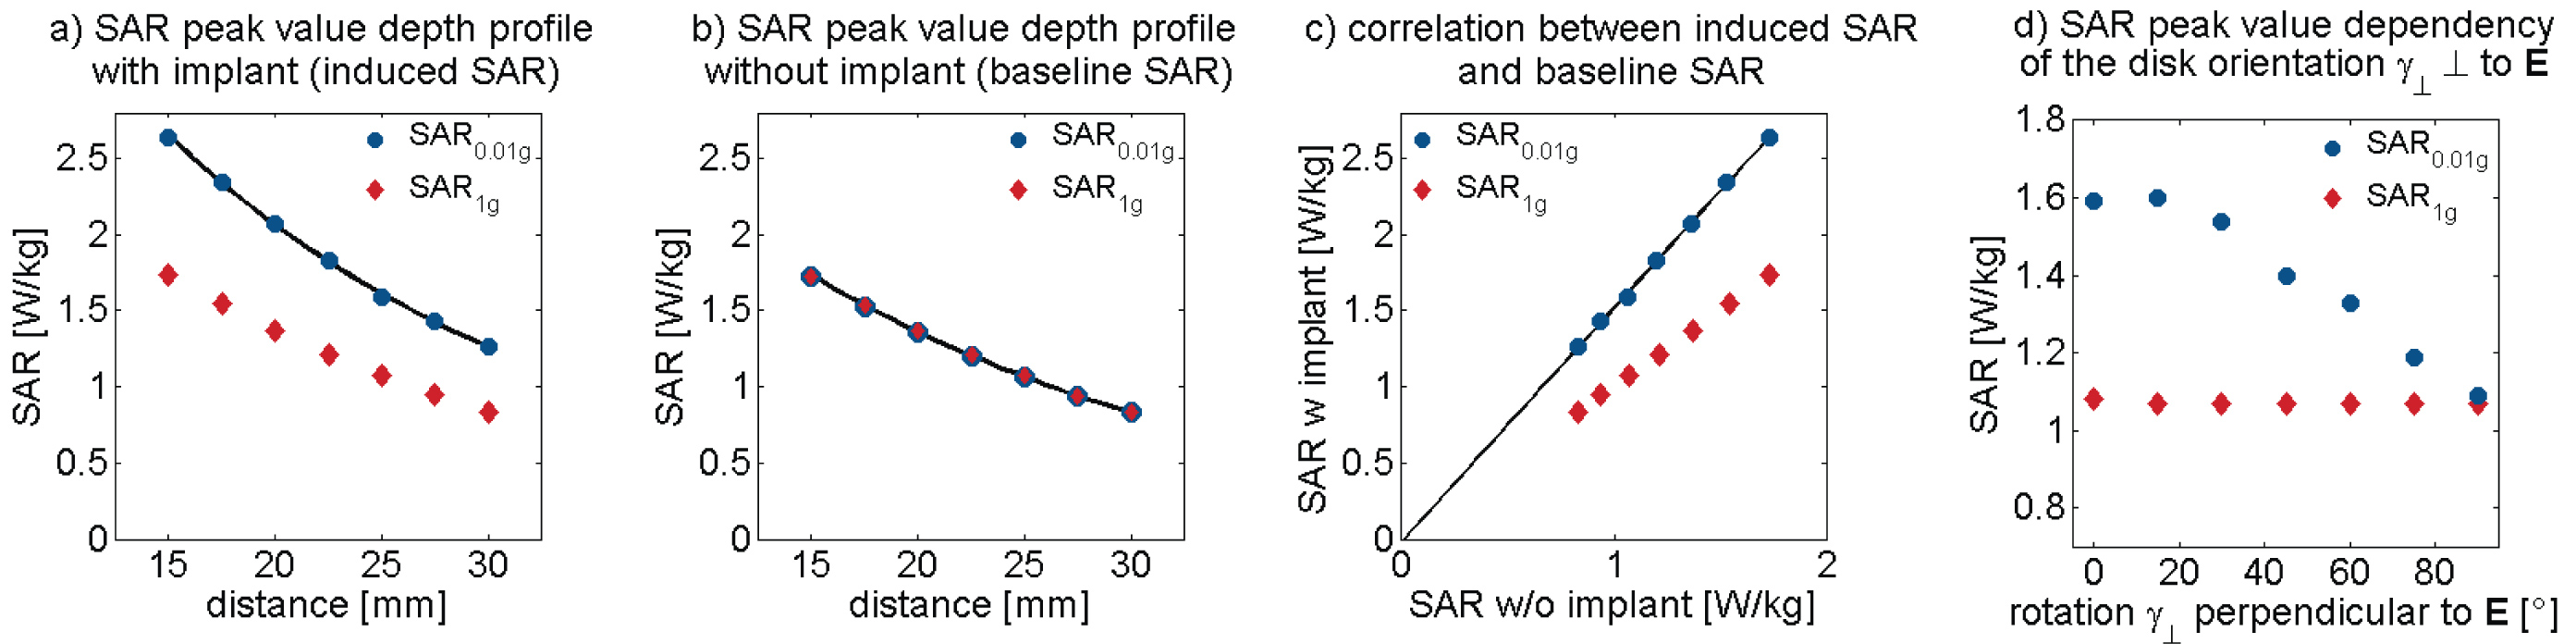
Investigating different implant positions revealed SAR0.01g peak values following an exponential decay with increasing distance between antenna and implant (R²=1;Fig.5a). Observing the same behavior in a uniform TSM phantom (“baseline SAR”,Fig.5b), a linear correlation was found between SAR0.01g(w) induced by the implant and SAR0.01g(w/o) without the implant: $$$ SAR0.01g(w)=1.54·SAR0.01g(w/o) $$$ (R²=1;Fig.5c). While SAR1g showed the same behavior as SAR0.01g, fitting the data revealed a correlation of only SAR1g(w)=1.005·SAR1g(w/o) (R²=1), confirming the smearing by the large averaging volume. Implant rotation perpendicular to the E-field lines yielded a cosine dependence (R²=0.96,Fig.5d) of peak SAR0.01g on the rotation angle γ⊥ . Again, this effect was not visible in the SAR1g data, yielding constant values for all orientations.
Discussion
Our SAR averaging mass considerations demonstrated a strong need to use averaging masses that are three orders of magnitude smaller than mave=10g provided by IEC guidelines1 to accommodate the small implant for an accurate SAR assessment. The proposed approach of examining SAR and temperature hot spots using the FWHM of profile peaks can be applied to the assessment of other implants and frequencies, as well as for the validation of the SAR10g-accuracy for any specific device under investigation.Acknowledgements
No acknowledgement found.References
1. IEC, 60601-2-33 Medical electrical equipment - Part 2-33: Particular requirements for the basic safety and essential performance of magnetic resonance equipment for medical diagnosis. Edition 3.0. 2010.
2. L. Winter, E. Oberacker, C. Özerdem, Y. Ji, F. von Knobelsdorff-Brenkenhoff, G. Weidemann, B. Ittermann, F. Seifert and T. Niendorf, On the RF heating of coronary stents at 7.0 Tesla MRI. Magnetic Resonance in Medicine, 2015. 74(4): p. 999-1010.
3. O. Kraff, K.H. Wrede, T. Schoemberg, P. Dammann, Y. Noureddine, S. Orzada, M.E. Ladd and A.K. Bitz, MR safety assessment of potential RF heating from cranial fixation plates at 7 T. Medical physics, 2013. 40(4): p. 042302.
4. J. Wezel, B.J. Kooij and A.G. Webb, Assessing the MR compatibility of dental retainer wires at 7 Tesla. Magnetic Resonance in Medicine, 2014. 72(4): p. 1191-1198.
5. E.S. Gragoudas, M. Goitein, A.M. Koehler, L. Verhey, J. Tepper, H.D. Suit, R. Brockhurst and I.J. Constable, Proton irradiation of small choroidal malignant melanomas. Am J Ophthalmol, 1977. 83(5): p. 665-673.
6. C.A. Amstutz, N.E. Bechrakis, M.H. Foerster, J. Heufelder and J.H. Kowal, Intraoperative localization of tantalum markers for proton beam radiation of choroidal melanoma by an opto-electronic navigation system: a novel technique. Int J Radiat Oncol Biol Phys, 2012. 82(4): p. 1361-1366.
7. P. Hasgall, F. Di Gennaro, C. Baumgartner, E. Neufeld, M. Gosselin, D. Payne, A. Klingenböck and N. Kuster, IT’IS Database for thermal and electromagnetic parameters of biological tissues, 2015, DOI: 10.13099/VIP21000-03-0.
8. L. Winter, C. Özerdem, W. Hoffmann, et al., Design and Evaluation of a Hybrid Radiofrequency Applicator for Magnetic Resonance Imaging and RF Induced Hyperthermia: Electromagnetic Field Simulations up to 14.0 Tesla and Proof-of-Concept at 7.0 Tesla. PLoS One, 2013. 8(4): p. e61661.
Figures