2630
Investigation of RF-induced heating of distal radius implant system1MR:comp GmbH, Gelsenkirchen, Germany, 2Max Planck Institute for Human Cognitive and Brain Sciences, Leipzig, Germany, 3MRI-STaR GmbH, Gelsenkirchen, Germany
Synopsis
At 64 and 127.7 MHz RF-induced heating on or near nine distal radius implant systems was investigated. The 3-D temperature distribution after 15 minutes continuous excitation was obtained for a plane wave incident field. For one implant, random trials followed by a gradient-based investigation revealed three screw configurations that resulted in a high maximum temperature rise. Due to the smooth outcome of random trials followed by a gradient analysis, even relatively small simulation numbers allowed to reveal the configuration with the highest temperature rise for a given incident electrical field.
Introduction
Most of commercially available implants are multi-component devices. With FDA released guidance FDA-2015-D-21041, reliability requirements for RF-induced assessment significantly increased compared to standard ASTM F2182-11a2 used widely in the past. Our goals were to analyze 64 and 127.7 MHz RF-induced heating of a distal radius implant system by: 1) simulating relevant configurations of one plate with longest length and narrow width of distal end to reveal different hotspot locations; 2) simulating other 8 plates with the screw configurations derived from analysis done for the first plate.Method
A system parameter matrix is shown in Fig. 1a. The plate and screws were placed in the middle of a box with dimensions 600x600x2400 mm3, filled with a medium with relative electric permittivity of 78 and electrical conductivity of 0.65 S/m, representing human muscle. The box was excited from one side by a 64 or 127.7 MHz source (Fig.1b). The screws were simulated as “nails” (Fig 1.c) to reduce computational complexity while only slightly increasing the temperature results uncertainty (~15%)3. A 3-D temperature distribution after 15 minutes continuous excitation with tangential electric field Etan(z)=100 V/m (peak-to-peak) was obtained by 3-D EM and thermal co-simulations. The maximum temperature rise (ΔTmax) was calculated as the highest difference of spatial temperature distribution for cases with and without the implant. For the first plate (N76) random trials followed by a gradient based investigation included 30 co-simulations at both 64 and 127.7 MHz. The remaining eight plates were simulated in only five configurations. Three configurations were derived from the gradient analysis of the first plate. To obtain a base line level estimation all plates were also simulated in two configurations: all screws with 24 mm length (AS24), and all screws with 10 mm length (AS10).Results and discussion
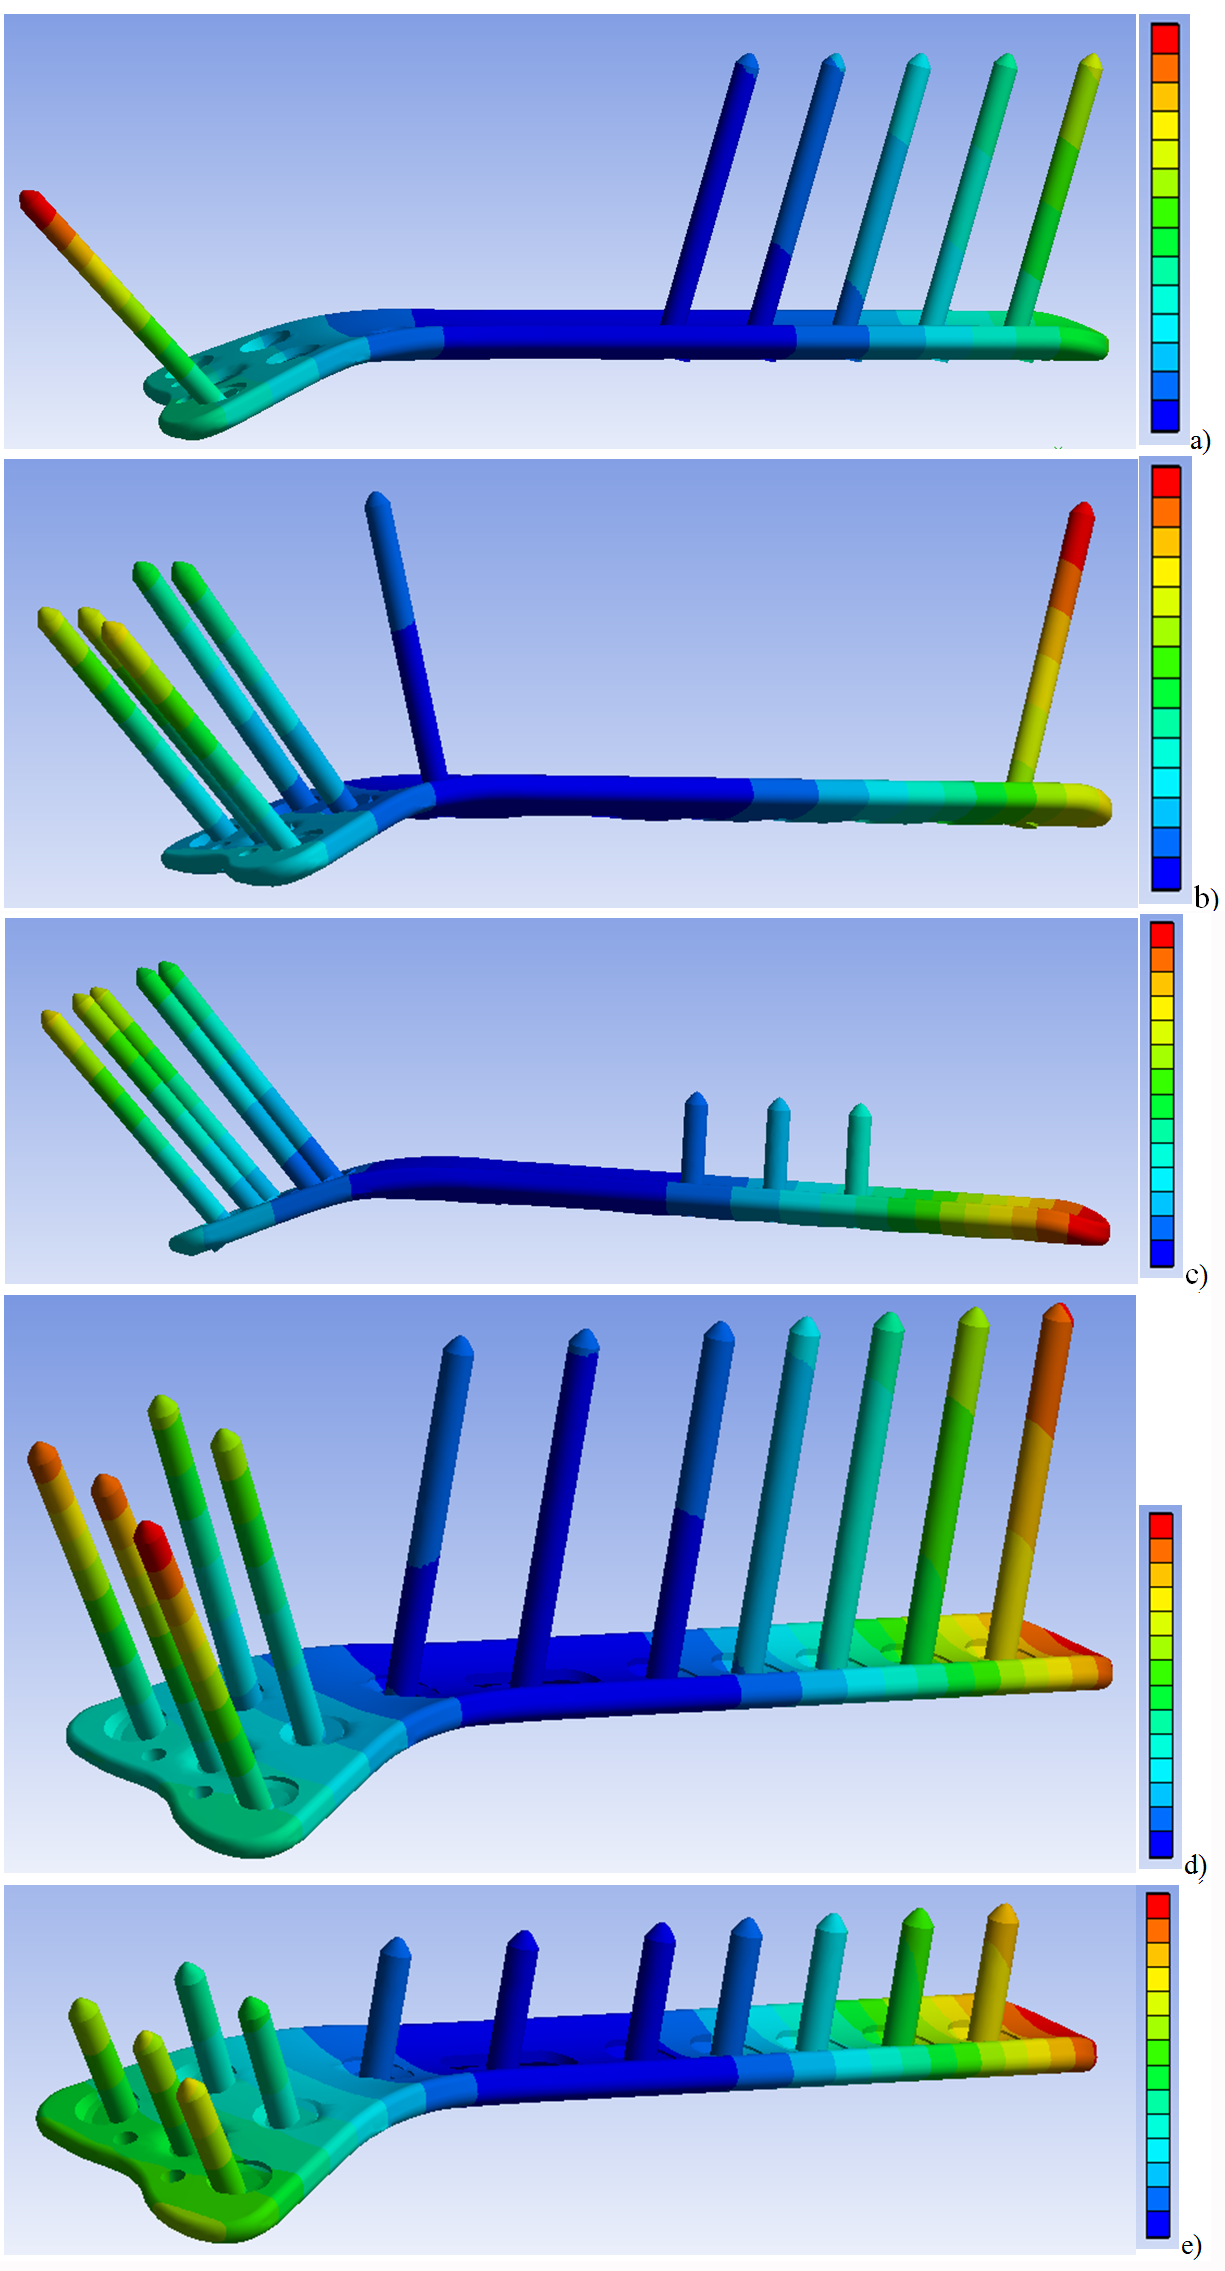
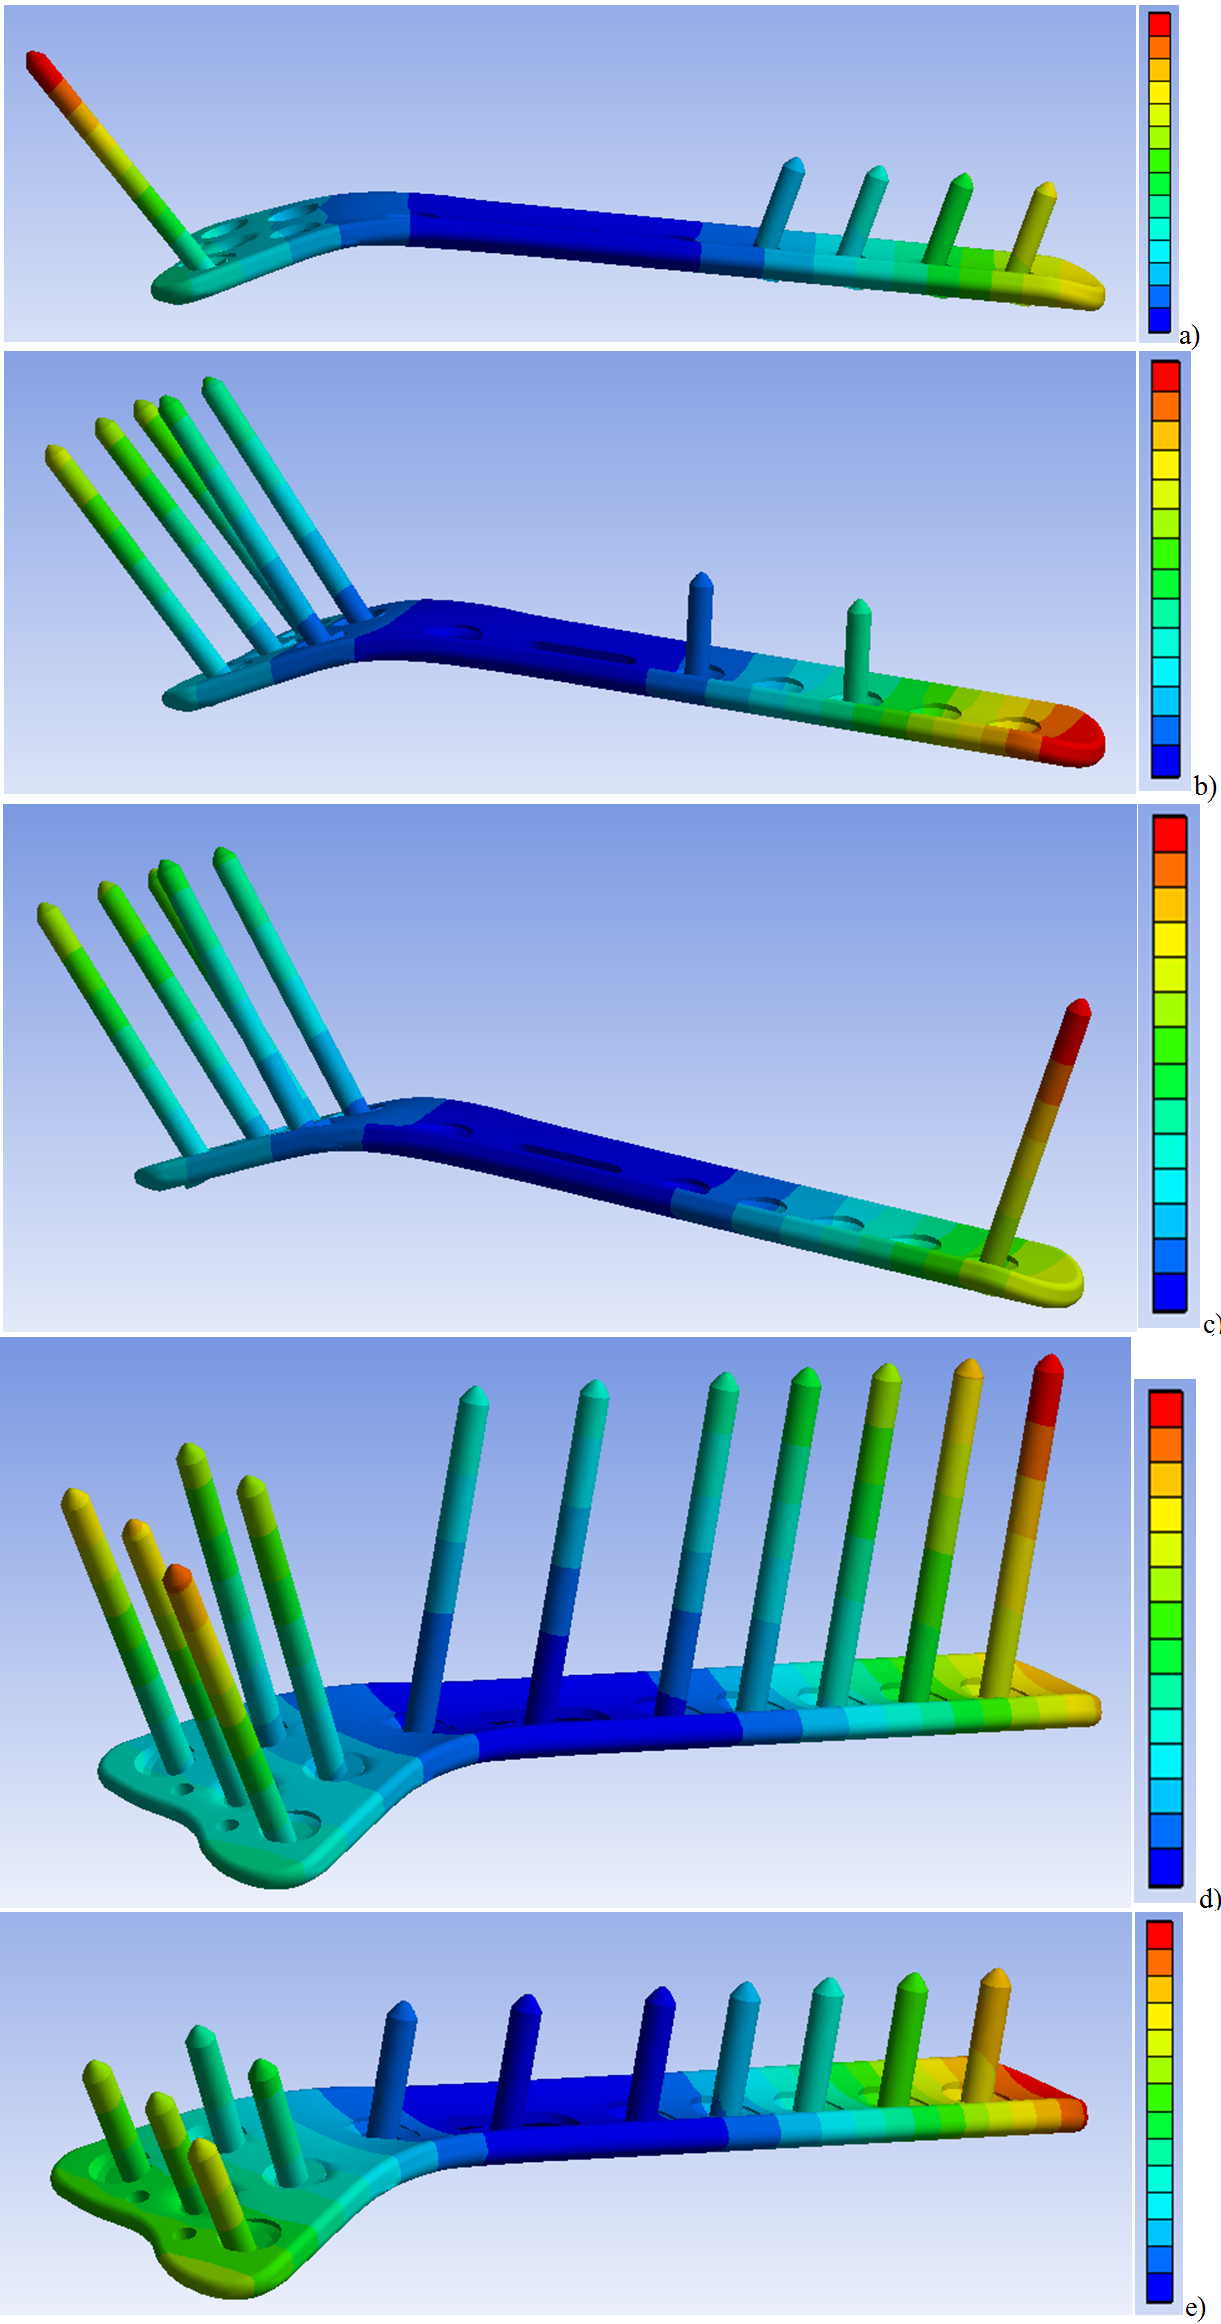
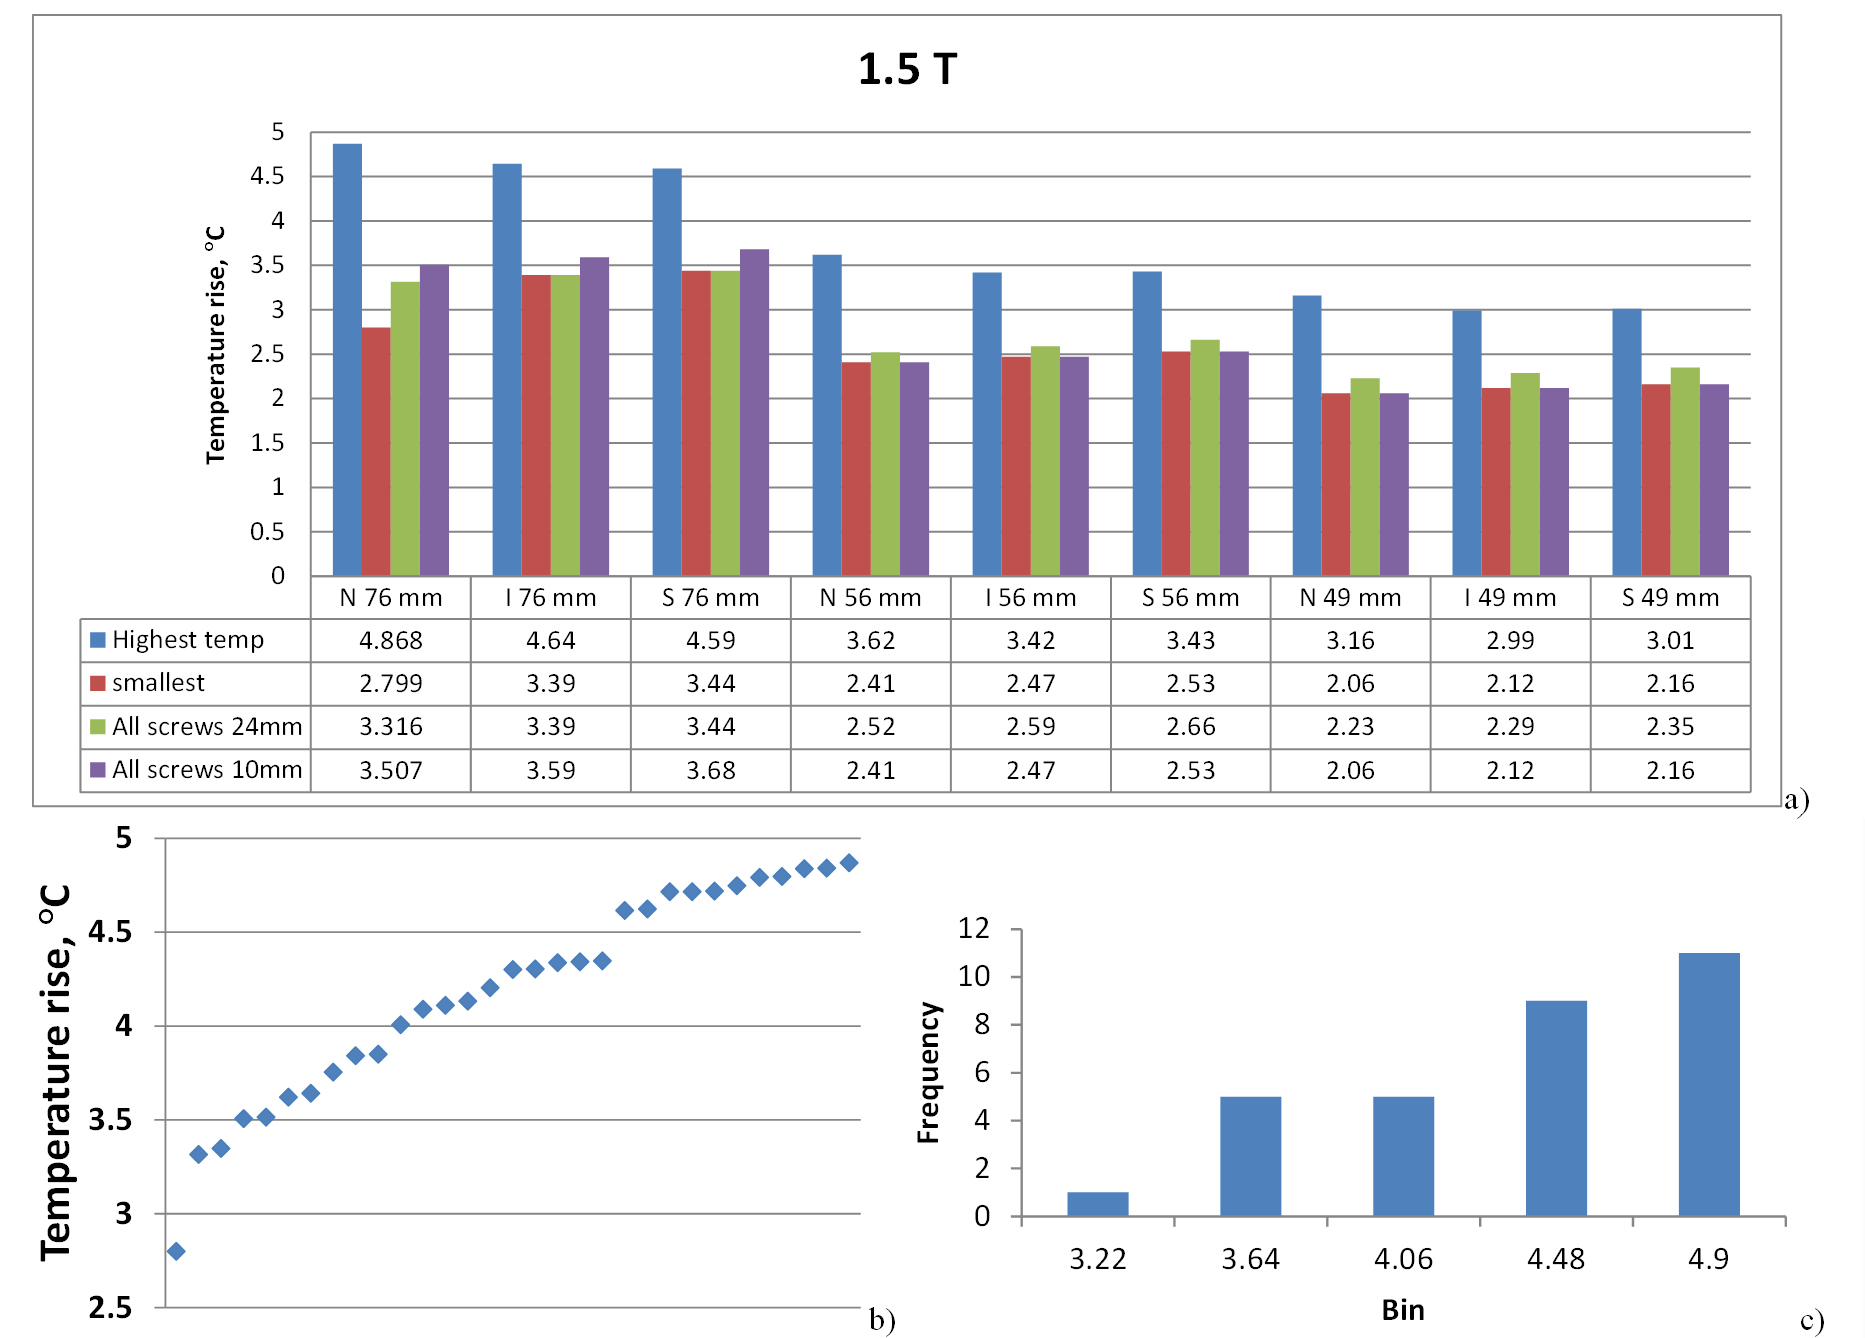
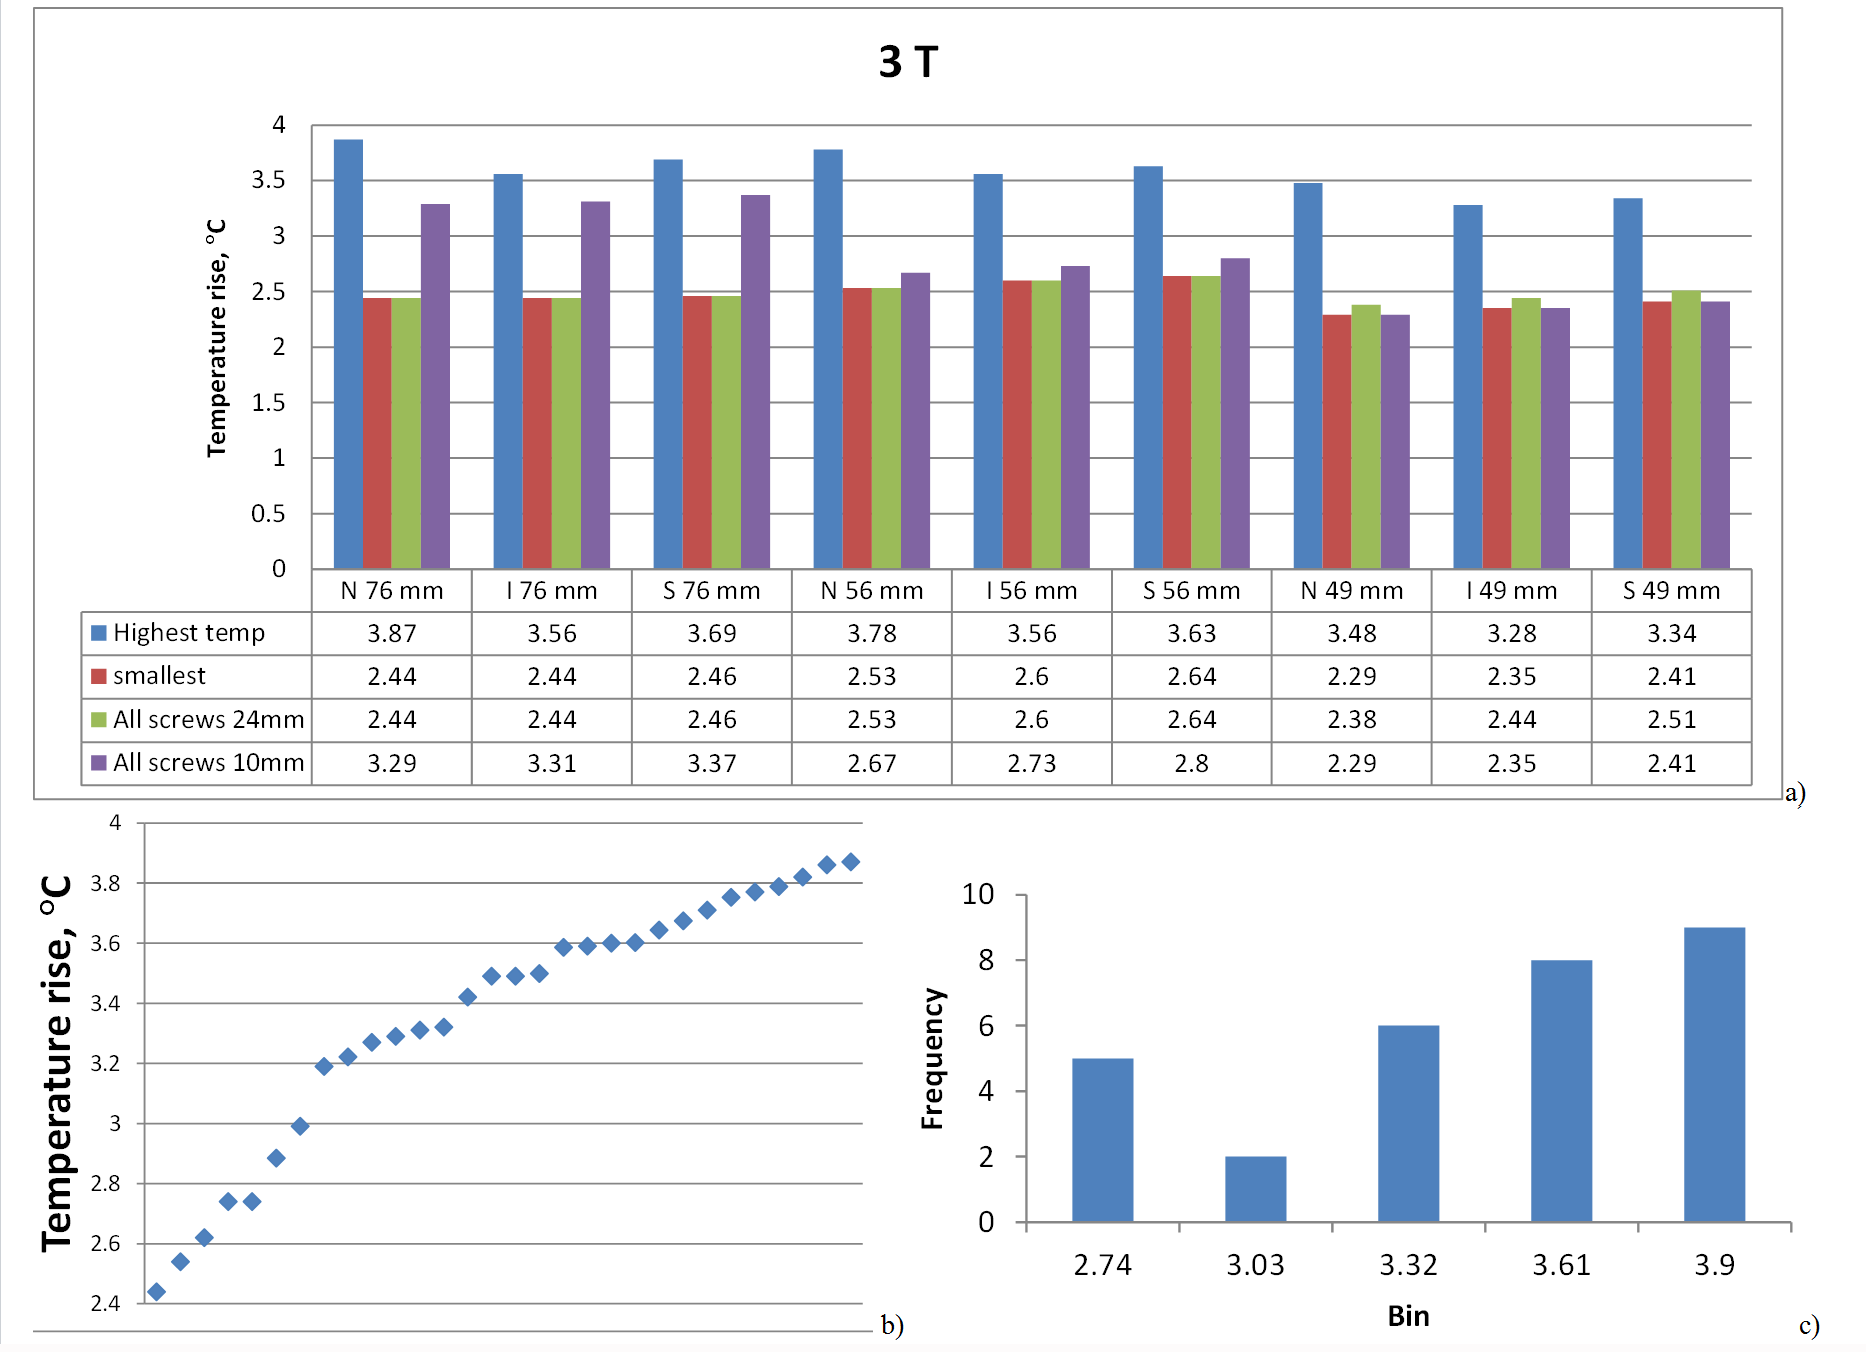
30 simulations were less than required to cover an entire parameter matrix using Monte-Carlo analysis with reasonable uncertainty. However at both 64 and 127.7 MHz, three screw configurations resulting in high ΔTmax (Fig. 2a-c and Fig. 3a-c) were revealed. The locations of ΔTmax were observed in the medium in close proximity of: screw #1 with -15° angle, screw #12 with 15° angle, and plate end face, respectively. ΔTmax variation for these cases was less than 12% and was ~75% higher than the minimum ΔTmax obtained (Fig. 4). Neighboring configurations suggested by gradient analysis, for example use of screws #10 or #11 instead of screw #12, resulted in a slightly decreased ΔTmax. For N76 , configurations AS24 and AS10 resulted in relatively moderate ΔTmax. At 64 MHz one of randomly selected configurations resulted in 20% smaller ΔTmax than for AS24 and AS10. At 127.7 MHz configuration AS24 resulted in the smallest ΔTmax (Fig.5). For all plates and frequencies investigated: a) AS24 and AS10 configurations did not result in the highest ΔTmax; b) ΔTmax for AS24 was not always higher that ΔTmax for AS10. Because gradient analysis was done only for N76, there is no guaranty that for other plates the highest ΔTmax was calculated. However because a) all plates were electrically short, b) the longest plate was investigated by gradient analysis, and c) the gradient analysis showed smooth behavior of ΔTmax across configurations that resulted in highest ΔTmax, a scientific rationale could be that for other plates, the difference between the highest ΔTmax and the smallest ΔTmax for AS24 and AS10 should be similar to this difference for N76. Thus based on available results the highest ΔTmax across all plates was estimated as (3.44+1.55)=4.99°C for 64 MHz and (2.64+1.43)=4.07°C for 127.7 MHz, which is a bit higher than the corresponding maximum ΔTmax obtained across all simulations. Cumulative numerical uncertainty for the given numerical setup was estimated as less than 10%. However single surrounding tissue approximation and only one orientation of the plate relative to the incident field propagation were substantial simplifications of different in-vivo multi-tissue cases. No uncertainties for these simplifications of very complex real cases, and possible variation of thermal and electrical properties were estimated in the given study.Conclusion
Because of the smooth outcome of random trials followed by a gradient analysis, even relatively small simulation numbers allowed to reveal the configuration with the highest ΔTmax for a given Etan(z). Our case study provided strong evidence that 3T static field strength cannot be considered as a worst-case for RF-induced heating. The specific results of this study, e.g., dependence of ΔTmax on plate dimension and screw configuration, cannot be simply extrapolated to other implants. This investigation without additional physical tests in MR environment is not sufficient to claim MR Conditional according to ASTM F2503.Acknowledgements
No acknowledgement found.References
1. FDA-2015-D-2104 “Assessment of Radiofrequency-Induced Heating in the Magnetic Resonance Environment for Multi-Configuration Passive Medical Devices”, March 2016, www.fda.gov
2. ASTM F2182-11a, Standard Test Method for Measurement of Radio Frequency Induced Heating On or Near Passive Implants During Magnetic Resonance Imaging, ASTM International, West Conshohocken, PA, 2011, www.astm.org.
3. Leewood, et. al “Simplified computational models of medical devices for accurate RF heating simulations with significantly reduced computational cost”, ISMRM 2015, p. 301.
Figures