2627
An Inexpensive, Modular, DSP-based SAR Monitor for Multichannel Transmit Systems1Electrical and Computer Engineering, University of Alberta, Edmonton, AB, Canada, 2Biomedical Engineering, University of Alberta, Edmonton, AB, Canada, 3Oncology, University of Alberta, Edmonton, AB, Canada
Synopsis
We describe a modular power (SAR) monitor for multichannel systems whereby both the forward and reverse power of each channel are sampled and averaged on a dedicated board. Each board houses an inexpensive microcontroller with built-in ADCs for sampling the output of two power detectors. The microcontroller is programmed to perform time averaging, forward-reverse power subtraction and threshold detection. Multiple boards communicate simultaneously with a graphical user interface on a host computer.
Purpose
Multichannel digital SAR monitors previously reported use expensive hardware for analog-to-digital (AD) conversion [1] and/or data processing [2]. Here we use an inexpensive microcontroller with on-board AD converters (ADCs) to perform data processing for each RF channel. Data from multiple channels is monitored individually. If any channel exceeds preset thresholds for average and instantaneous power the scan is stopped. The operator configures threshold values based on coil type and patient weight on the host computer, which monitors the outputs for each channel by displaying 10 s and 6 min SAR averages [3].Methods
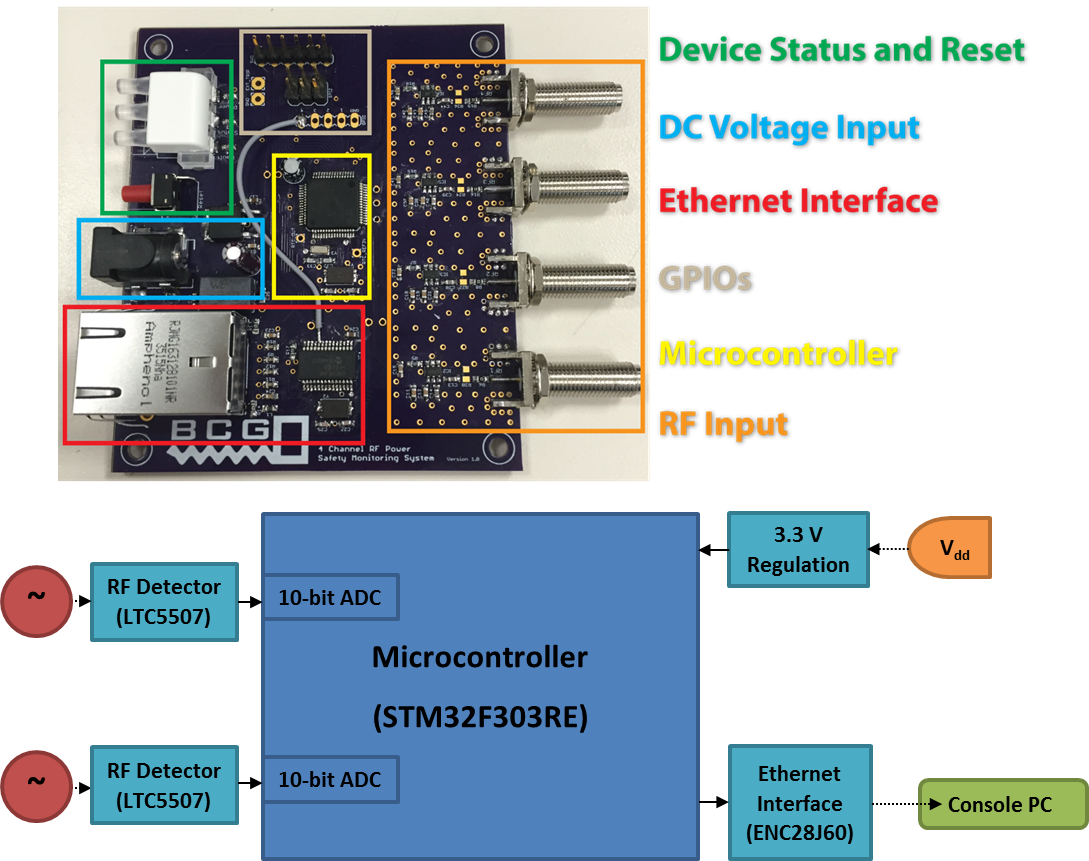
A PCB (Figure 1) was designed for two LTC5507 RF power detectors (Linear Technology); an STM32F303RE microcontroller (STMicroelectronics) with two simultaneously-sampled on-chip 10-bit ADC channels and digital signal processing (DSP) functionality; and an ENC28J60 (Microchip) Ethernet controller. Forward and reverse power from the directional coupler at the output of one RF amplifier channel are fed to corresponding power detectors on each board. Voltages at the detector outputs are sampled at 2 MS/s to allow sampling short or highly modulated pulses with acceptable fidelity. Firmware for the microcontroller was developed for fast conversions between digital voltage values and corresponding RF power levels using a look-up table. This enables near real-time response to RF power, with peak threshold detection taking place every 5 ms. The 1024 values in the look-up table are determined by a calibration procedure that consists of measuring the output from the ADC at 13 predefined, continuous-wave power levels (each of which was measured independently using a calibrated power sensor (LadyBug LB5918A)). The remaining values are calculated through linear interpolation between the measured points. To test the power detector’s ability to follow modulated pulses a test waveform (carrier frequency = 200.44 MHz, sine modulation with period = 50 μs) was produced by a Marconi 2023 RF signal generator and captured with the acquisition board.
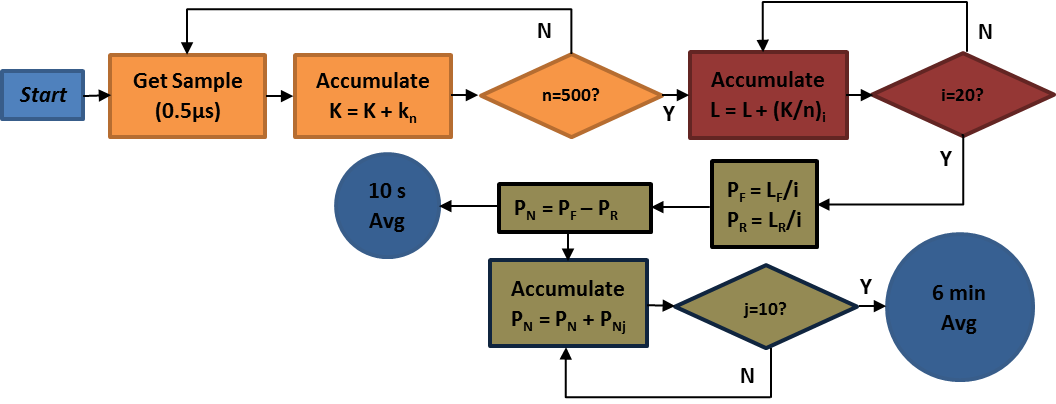
Firmware (Figure 2) with three digital averaging cycles was subsequently implemented to produce the time-averaged data from each RF channel. The two channels are sampled in simultaneous multichannel mode to enable direct forward/reflected power level comparisons. In the first cycle 500 samples (250 μs) are collected from each channel, summed into respective accumulator variables, and divided by 500 to produce the average. This is the level-1 average, which is then accumulated separately for 20 consecutive cycles (5 ms) and divided by 20 to yield the level-2 average. The level-2 average of the reverse channel is subtracted from that of the forward channel to produce the average net power value. This net value is inserted into a circular buffer of 2000 entries whose mean is the 10 s net power rolling average. The circular buffer is averaged using the arm_mean_f32 DSP function of the Cortex Microcontroller Software Interface Standard (CMSIS). A 6 minute rolling average is then calculated similarly by filling a separate ring buffer of length 7200 with the average of 10 level-2 averages (the level-3 50 ms average). The 10 s and 6 min net averages are communicated to the host computer every 5 s via User Datagram Protocol (UDP) through the Ethernet port and a switch to allow an operator to monitor at least 12 channels.
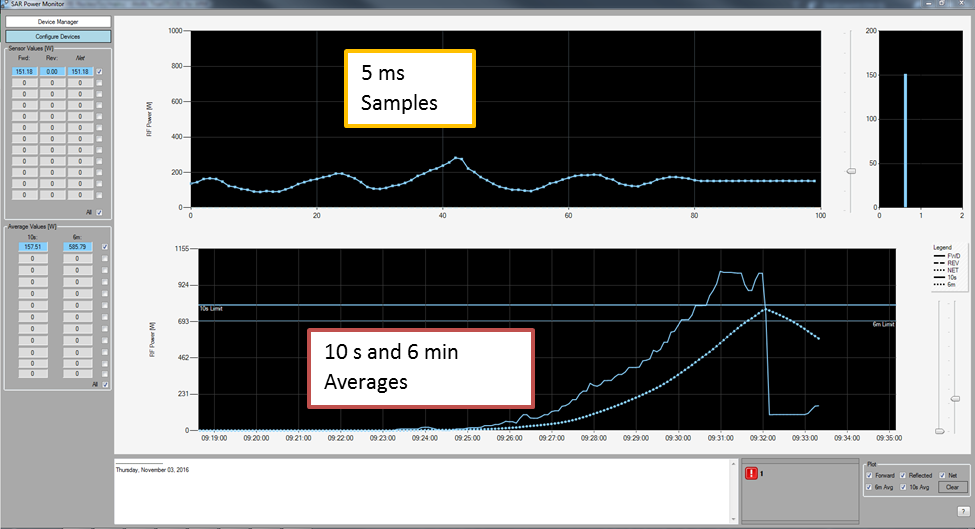
A graphical user interface on the host computer (Figure 3) displays the instantaneous and average power over the preceding 6 minutes. To prevent safety from being compromised by data communication errors or delays, all the power calculations and threshold comparisons are done locally by the microcontroller. If the instantaneous or averaged powers exceed predefined safety thresholds the microcontroller activates a digital signal that is combined with that from other controllers on a logic board, and blanks the RF amplifier and stops the scan if thresholds are exceeded on any channel.
Results
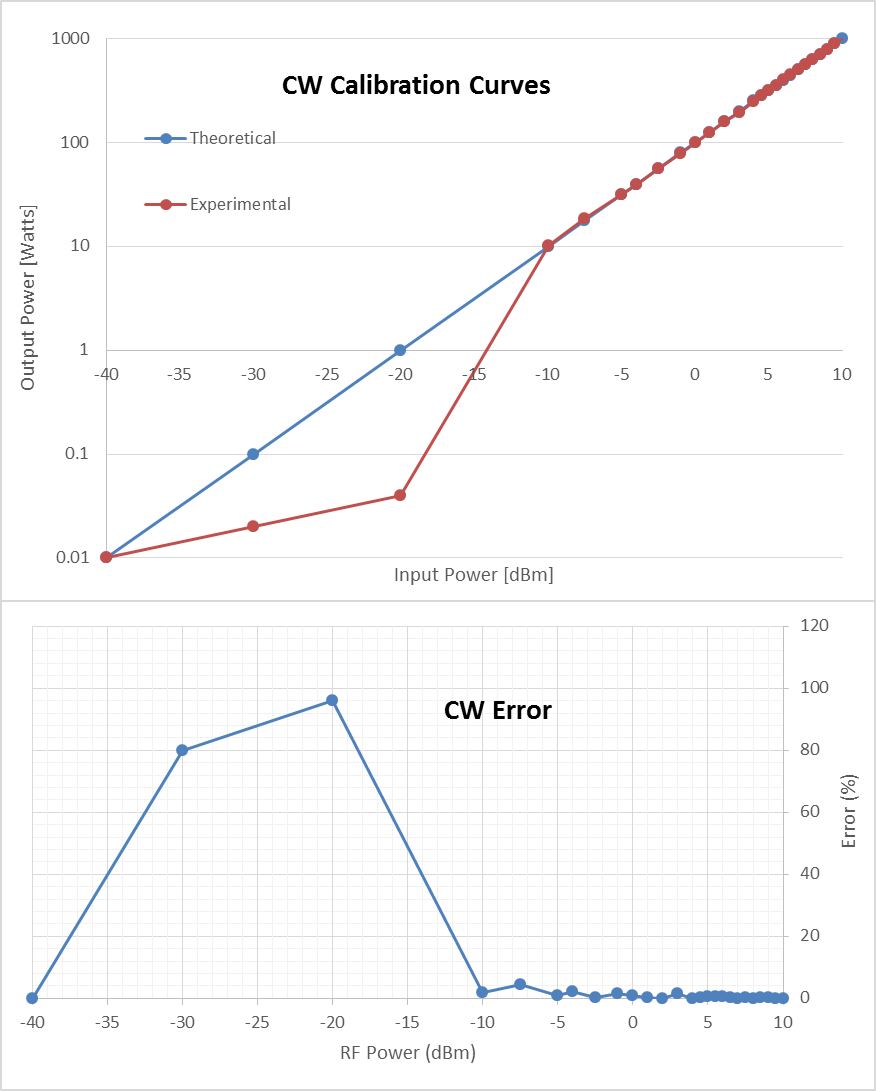
The oscilloscope signal of the sinusoidally-modulated pulse is shown in Figure 4 along with the output voltage of the detector and digitized output from the ADC. Indeed, the detector and ADC can detect modulated waveforms expected in MRI. Power calibration was tested by inputting various amplitudes of continuous wave RF power to the device and comparing the averages calculated by the device to the expected value (Figure 5a). Note that errors (Figure 5b) at lower amplitudes («1 mW) are acceptable for SAR monitoring applications.
Conclusion
We have developed a scalable multichannel SAR monitoring system using inexpensive components (~$20/ch). The system is able to capture modulated waveforms and is calibrated to a traceable standard. Testing on the scanner against an analog Varian SAR monitor is ongoing.Acknowledgements
The authors gratefully acknowledge funding from the Natural Sciences and Engineering Research Council (Canada) and from the Peter S. Allen MR Research Centre (University of Alberta).
References
1. Medical Physics 2012 May; 39(5): 2334–2341.
2. ISMRM 2016, #3662
3. IEC60601-2-33
Figures