2625
Experimental and simulated distribution of the RF electrical field inside a birdcage coil1Univ. Lyon, CREATIS ; CNRS UMR 5220 ; INSERM U1206 ; INSA-Lyon ; UJM-Saint-Etienne ; Université Lyon1, Villeurbanne, France, 2Univ. Savoie-Mont-Blanc, IMEP-LAHC, Le Bourget-du-Lac, France, 3Kapteos, Sainte-Hélène-du-Lac, France
Synopsis
High-field MR systems bring additional safety issues regarding the patient. One of main concern is the heating effect caused by the high-frequency and high-power signals that can be picked up by the conductors. It is thus required to identify these regions and to quantify the electrical E-field knowing that it is proportional to the square of the temperature elevation. For a direct measurement, an optical probe was used to perform a mapping of the E-field distribution inside a birdcage of a preclinical MRI. Experiments and simulations were found similar with E-field concentrations mainly located close to the capacitors.
Introduction
The spatial resolution of MR images could be improved by developing sophisticated radiofrequency (RF) transceiver coils or by increasing the static magnetic field B0-strength1. However, the fast and successful progresses of MR scanners could be the reason for additional safety issues regarding the patient2, 3. The specific absorption rate (SAR) is proportional to the square of B0 thus local heating is caused by the transmission of high-frequency and high-power electrical E-field along conductors or passive components e.g. capacitors. This requires a fast and an accurate assessment of the E-field concentrations in order to control the SAR-parameter during MRI exam. Detecting of the distribution of the E-field inside MRI or near metallic implants was already evaluated by dipole-based probes inserted in a phantom4, 5 and numerical simulations6. But, the metallic structure of the dipole probe may alter the electromagnetic fields and thus limits the accuracy of the measurements. In this study, we propose an optical-based probe for E-field measurements and we present a comparison between the simulated E-field distribution and the experimental map of the E-field using an optical-based probe inside a MRI birdcage.Methods
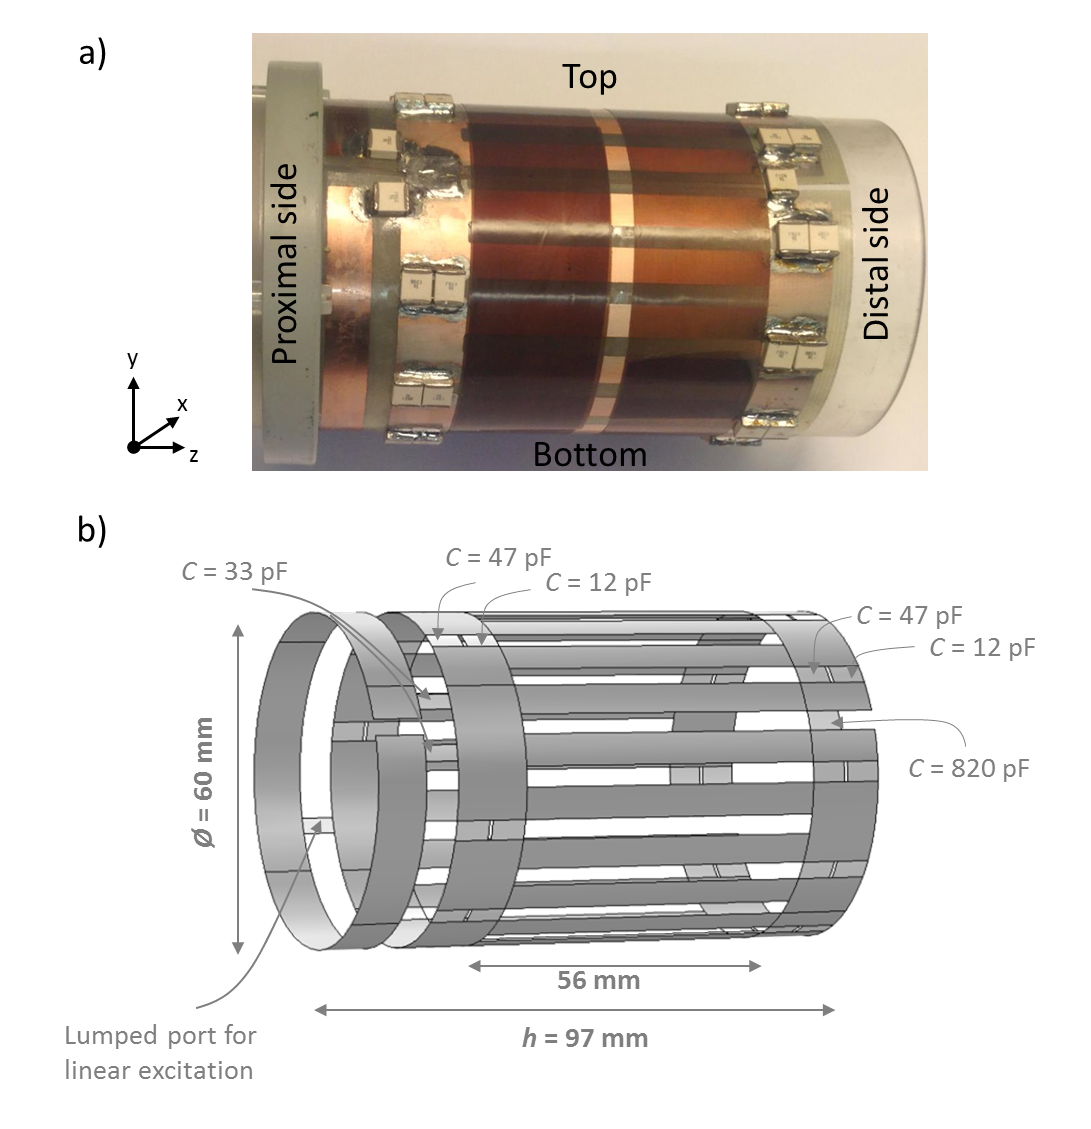
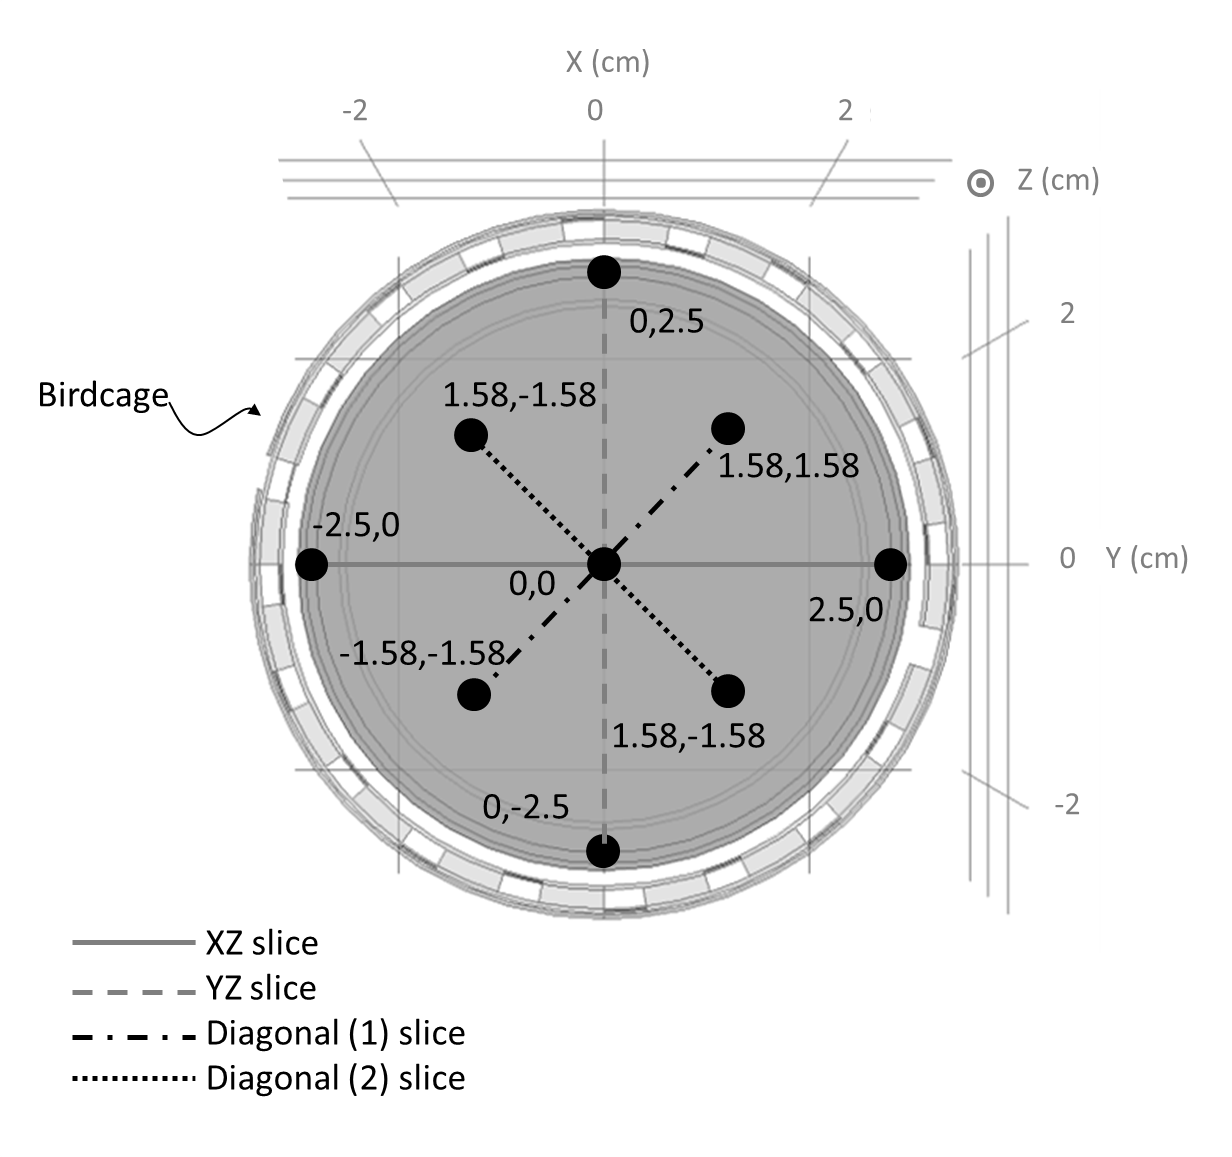
A finite element method simulation was performed using COMSOL Multiphysics. The birdcage consists of two circular conductive loop (end rings) where the capacitors are placed and nineteen conductive elements referred to as rungs (Fig 1). The capacitors of the coil are defined using lumped elements. The birdcage is linear thus only one lumped port boundary is used for RF excitation (P = 138W). The birdcage was placed inside a cylindrical RF shield. The experimental measurement of the E-field was performed in a 4.7-T preclinical MRI (Bruker) using an optical-based probe. The E-field probe operates based on Pockels effect; it consists of isotropic crystal that changes its optical proprieties according to the variation of the E-field. A laser diode was simultaneously applied to the crystal. The polarization of the laser changes with the applied E-field. Optoelectronic devices were used to analyze the modulation of the polarization and insure the optical-to-electrical conversion of the signal to be then visualized by a spectrum analyzer. The probe measures the radial component of the E-field. It was calibrated outside the MRI to determine the proportionality factor between the EO signal and the E-field. The proximal side of the birdcage corresponds to the plane Z=0. On this plane, we have chosen nine measurement points as shown in Fig 2. For these nine points, we have measured the E-field every 1cm by moving the probe along z-axis. The measurements points have been used to plot 2D maps of the E-field using Matlab language. For these experiments, a FLASH sequence with hermite shape RF pulse was used.Results
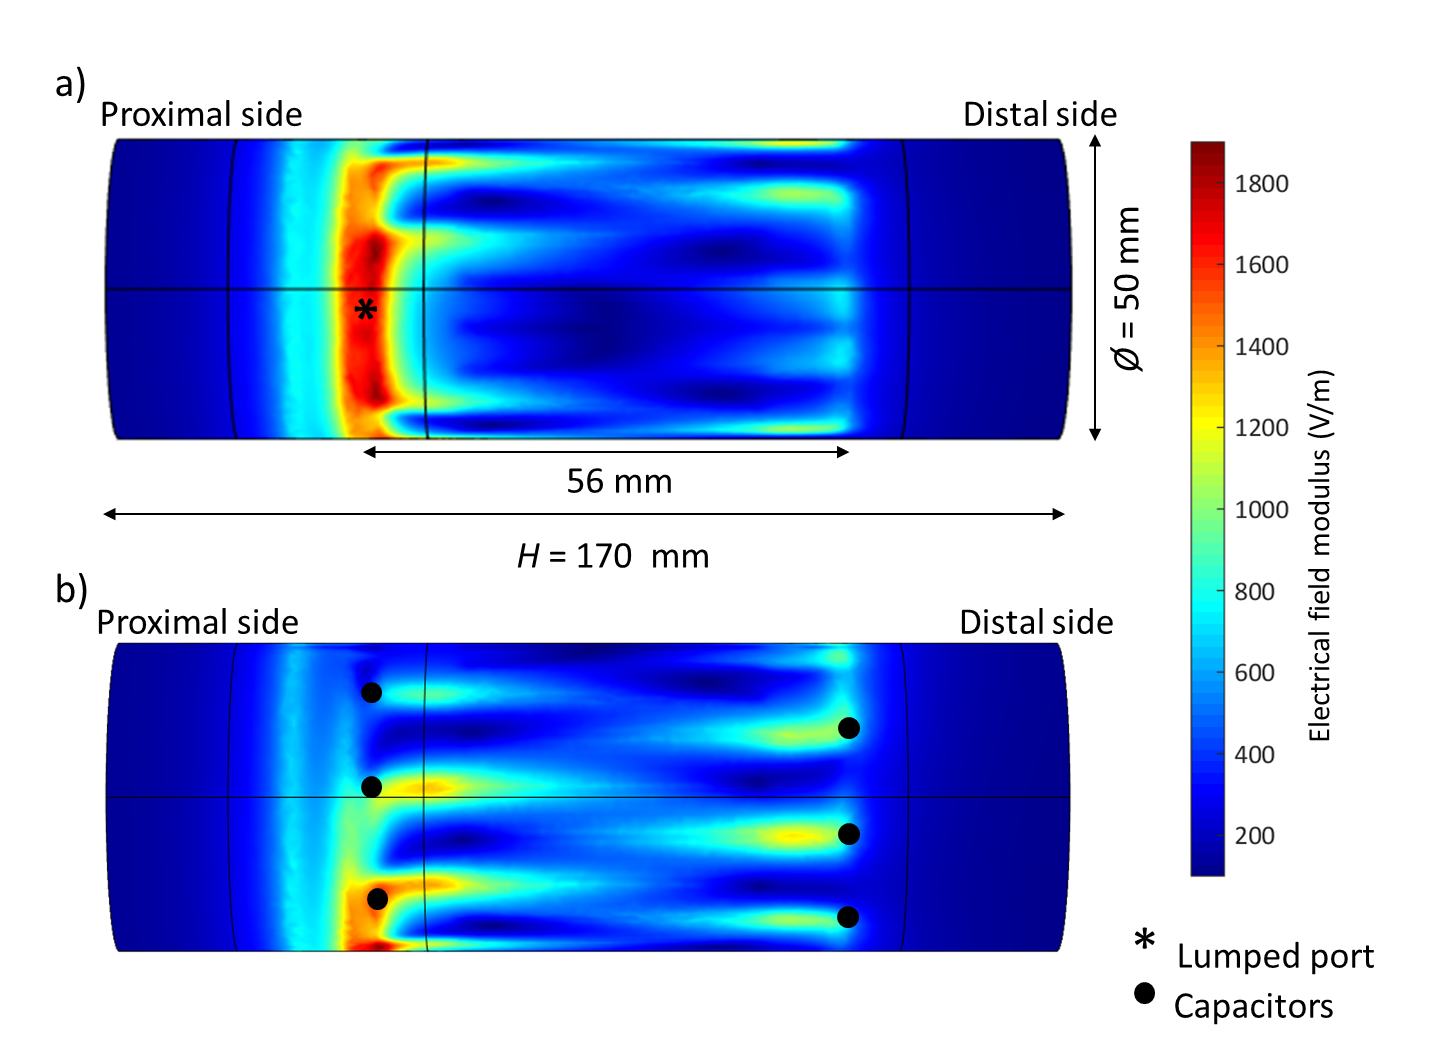
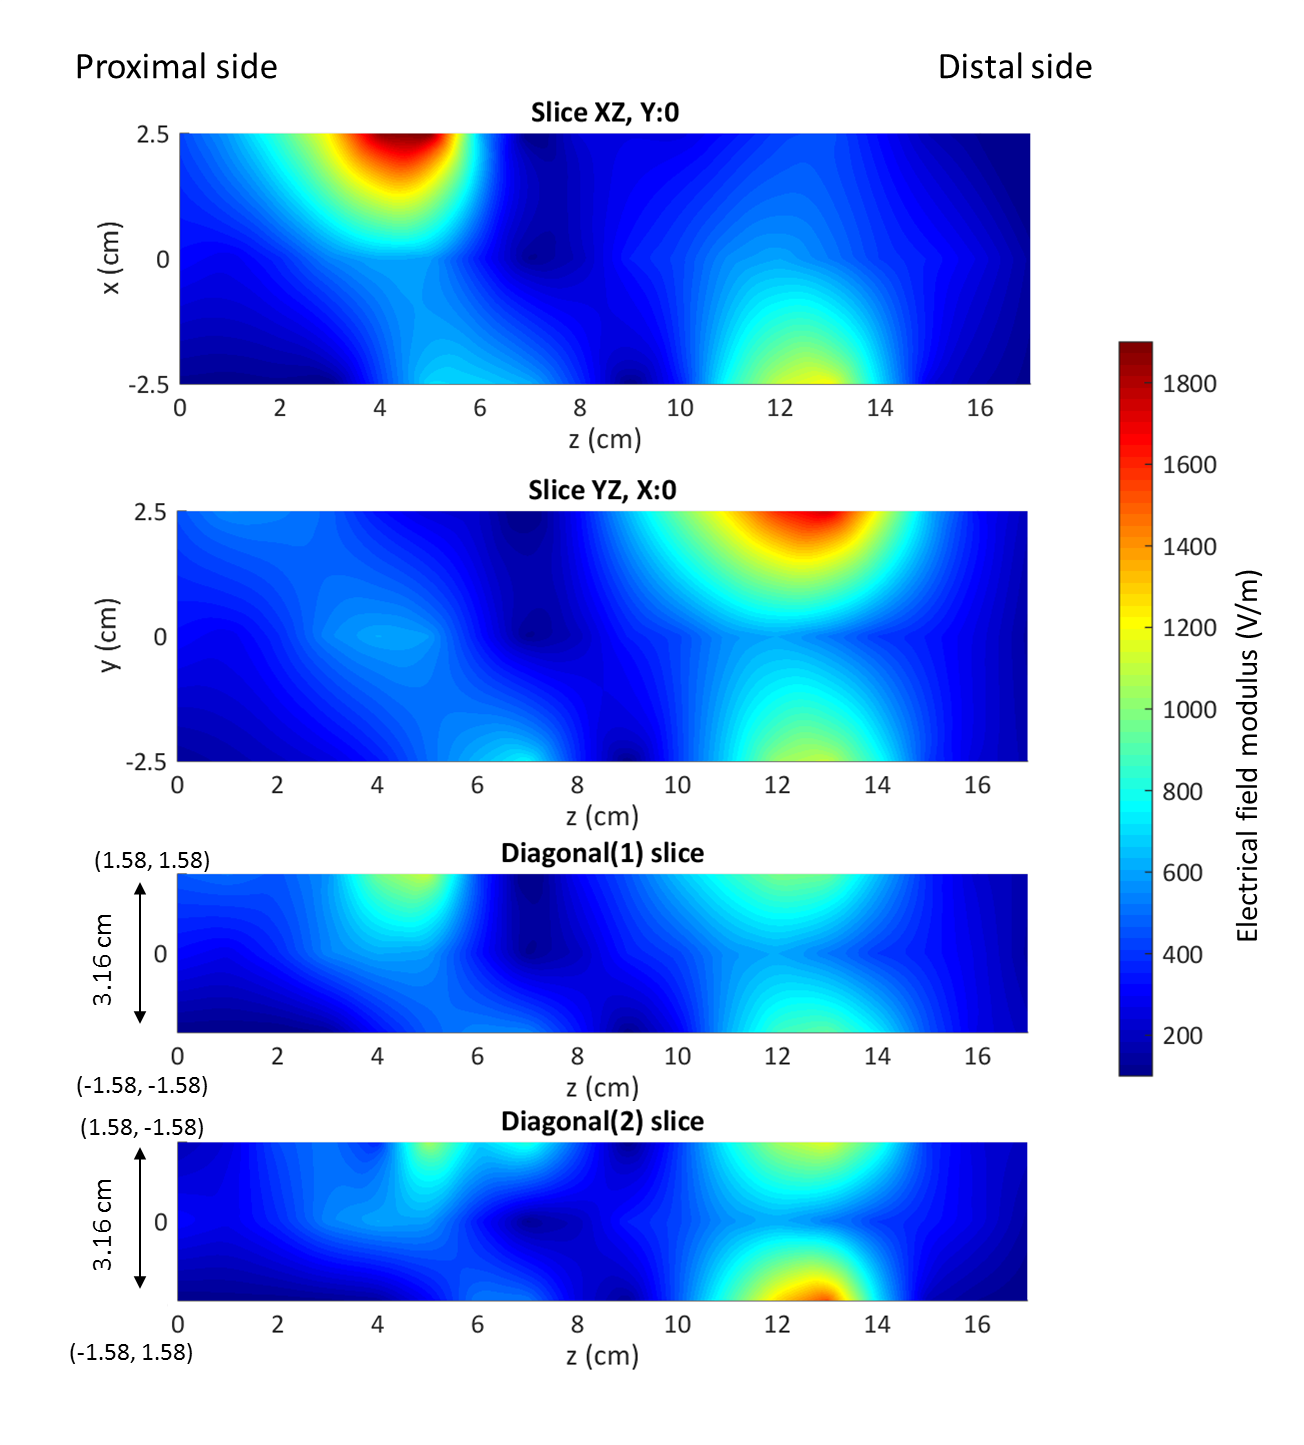
The simulated results show that the E-field is not uniform within the birdcage. Figure 3 exhibits clearly the positions of the E-field concentrations regarding the geometry of the birdcage. The high-concentrations areas (around 1900 V/m) are mainly located near the lumped port and the capacitors. The concentrations-value gradually decreases along the copper rungs to have the lowest value (100 V/m) in the middle of the birdcage rungs/legs. Experimental maps are shown in the Fig 4. The E-field high-concentrations are located at Z-values equal to 5 cm and 11 cm for all the slices. The E-field was measured with a factor of proportionality equal to 417714.9 m-1. The maximum value was around 1900 V/m and decreases progressively by approaching to the center.Discussion
The E-field measurements and simulations were performed in air in order to determine the distribution of the E-field inside a birdcage and specifically near its walls without any limitations due to the dimensions of a phantom4, 5. The experimental maps of the E-field are very close to the simulation in terms of distribution and value. The high concentrations of the E-field are in proximity of the birdcage wall and the weakest concentrations are in the center. The simulation shows that the E-field high-concentrations are located near lumped port and capacitors. The distance between the two rings is 56 mm, therefore the high-concentrations in the experimental maps corresponds exactly to the locations of the capacitors.Conclusion
We proved that the optical-based probe has the ability to measure in air the E-field inside a birdcage within picoseconds. This probe would also be used inside a phantom or a biological tissue to control the SAR-parameter and could definitely replace thermal sensors commonly used as an alternative method for SAR assessment but cause additional measurement errors due to the conviction and the diffusion of the temperature in the medium nearby.Acknowledgements
This work was supported by the Rhône-Alpes region and performed within the framework of LABEX-PRIMES (ANR-11-LABX-0063) of Lyon University, and the program “Investissements d’Avenir” (ANR-11-IDEX-0007) operated by the French National Research Agency.References
1. L. Quettier, et al. Expected magnetic field quality from the preliminary measurements performed during the manufacturing of the Iseult/Inumac whole-body 11.7-T MRI magnet. IEEE Trans. Appl. Supercond. 2016;26(4):1–4.
2. P. Röschmann. Radiofrequency penetration and absorption in the human body: Limitations to high-field whole-body nuclear magnetic resonance imaging. Med. Phys.1987;14(6):922–931.
3. D. I. Hoult et al. Sensitivity and power deposition in a high-field imaging experiment. J. Magn. Reson. Imaging. 2000;12(1):46–67.
4. A. Kangarlu, et al. Electric field measurements and computational modeling at ultrahigh-field MRI. Magn. Reson. Imaging. 2007; 25(8):1222–1226.
5. P. Nordbeck, et al. Spatial distribution of RF-induced E-fields and implant heating in MRI. Magn. Reson. Med. 2008; 60(2):312–319.
6. B. Park, et al. Analysis of conservative and magnetically induced electric fields in a low-frequency birdcage coil. Journal of Electromagnetic Analysis and Applications. 2013;5:271–280.
Figures