2623
Applicability of lead electromagnetic model for an external wire with skin contact1Neurophysics, Max Planck Institute for Human Cognitive and Brain Sciences, Leipzig, Germany
Synopsis
We calculated the electromagnetic (EM) model of an external wire with an electrode that contacts human skin at 123.2 MHz and evaluated the influence of the electrode dimension as well as the distance between the wire and the human body on the EM model using an approximation of the human body by a single tissue flat phantom. Our case study provided a strong evidence that at 123.2 MHz there is no worst-case distance between a wire and a human body that maximizes the power deposition for any wire length or electrode width.
Introduction
MRI investigations are increasingly combined with other studies that require additional sensor setups that entail an external wire with an electrode that is in contact with the human skin. The wire enters the radio-frequency (RF) coil effective exposure volume and operates as an antenna whose performance depends on relative positioning of the wire and human body as well as the electrical contact of the electrode with the skin. RF-induced power deposition (p) can result in significant temperature rise in the area where the electrode contacts the skin. It remains a challenge to perform a large number of 3D electromagnetic (EM) simulations (that are required for the reliable safety assessment) of different relative positioning of a sensor/wire located in close proximity of different human body models. For fully implanted devices a procedure was developed that separates the analysis of relevant incident tangential electric fields (Etan(z)) along the lead pathways from calculations of the lead responses to these Etan(z) using a lead electromagnetic model1 expressed as:
$$p=A\cdot\mid\int_{0}^{L}S(z)\cdot E_{tan}(z)\cdot dz \mid^{2}$$
where A is the calibration factor and S(z) is the complex transfer function. Without specifying a particular type of implant it is impossible to define the relevant implant trajectories inside the human body and to obtain a set of relevant Etan(z). However for an approximate estimation of p for insulated leads for various purposes, a set of analytically defined Etan(z) can be used. Our set included: 1) homogeneous Etan(z), i.e. both amplitude |Etan(z)| and phase φ(Etan(z)) distributions were constant; 2) inverse phase distribution Etan(z), i.e. |Etan(z)| was equal to a constant and φ(Etan(z)) = -φ(S(z)). It is known1 that the second Etan(z) resulted in the largest power deposition for a given constant |Etan(z)|. Our goals in this study were: to calculate the EM model of an external wire with an electrode that contacts human skin at 123.2 MHz; to evaluate the influence of the electrode dimension as well as the distance between the wire and the human body on the EM model using an approximation of the human body by a single tissue flat phantom.
Method
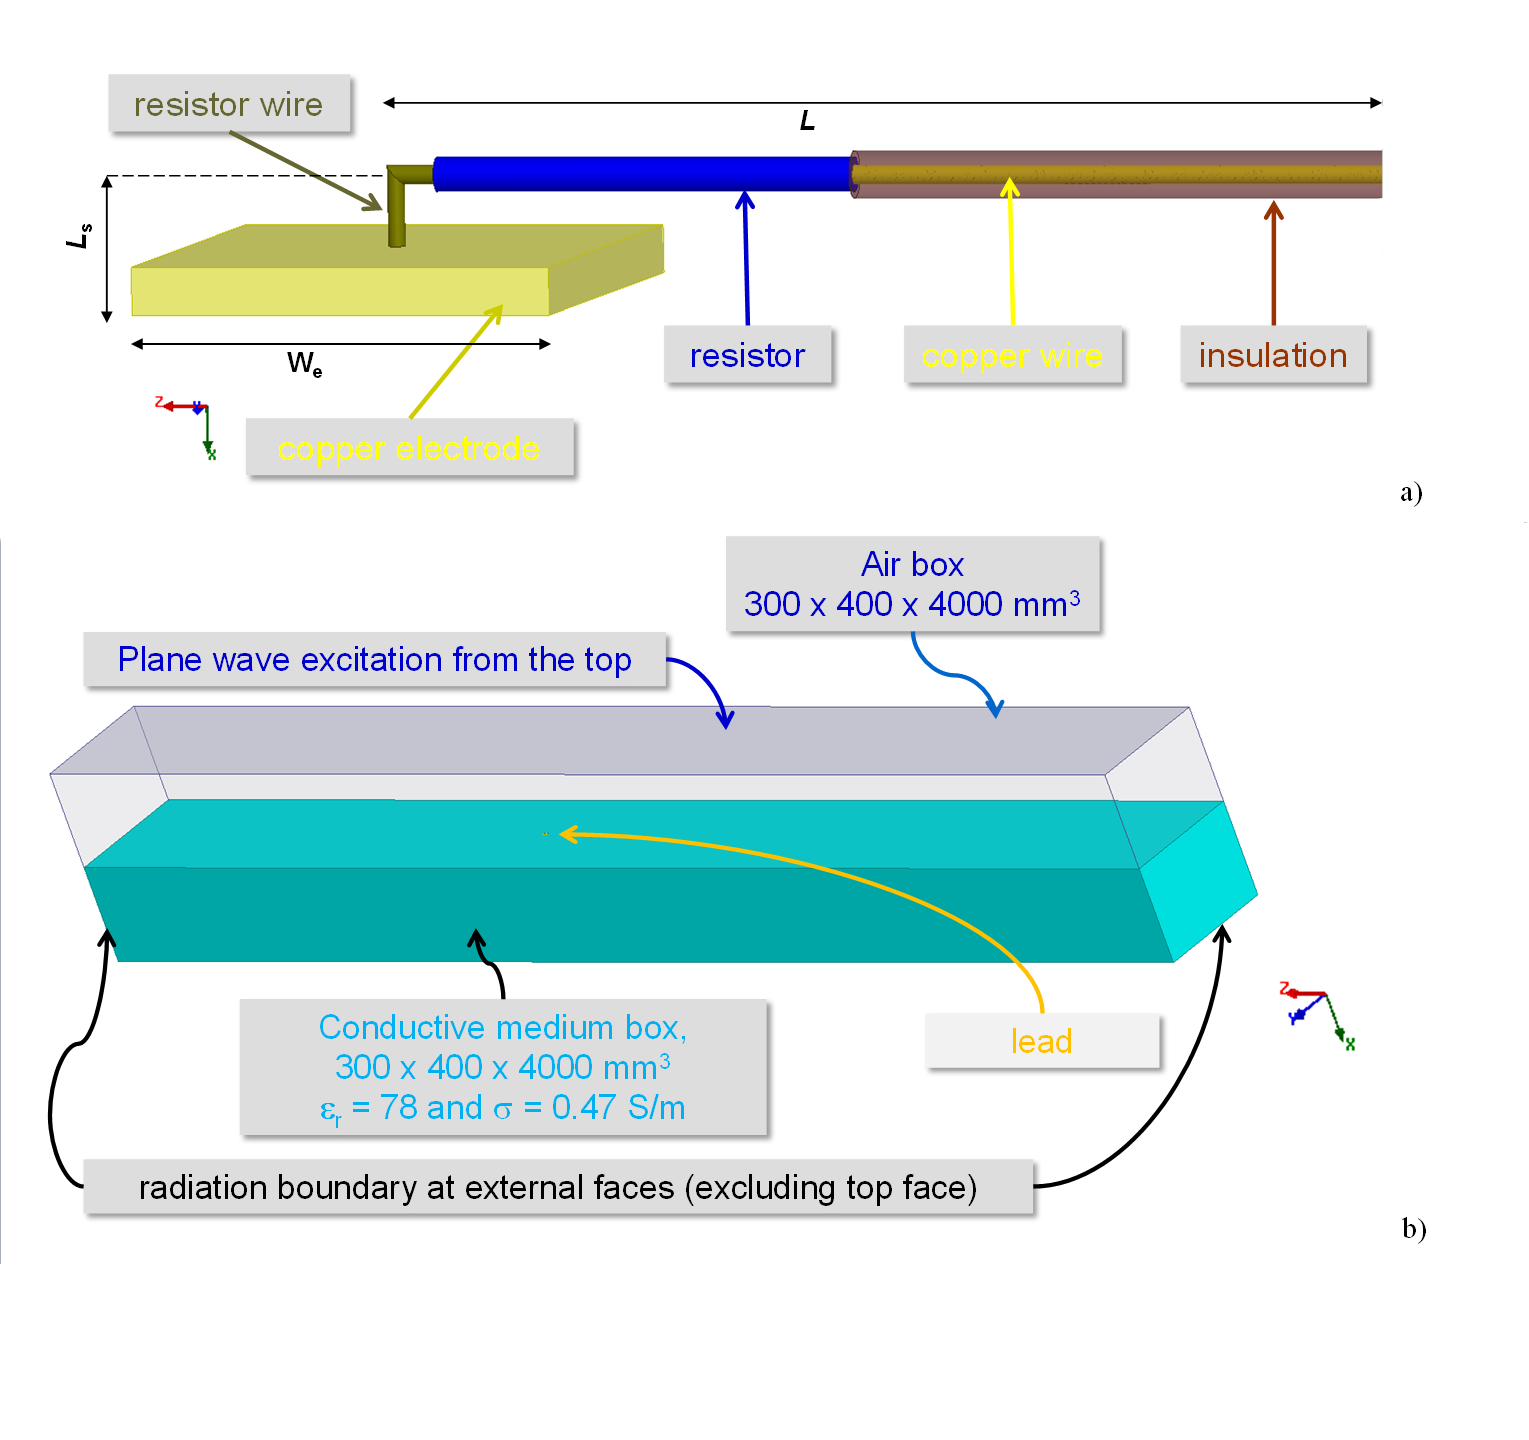
An insulated copper wire of 1.46 mm diameter with insulation thickness of 0.605 mm was capped at one end and connected through a resistor (Rr={1e-6,1e4}Ω) to a quadratic copper electrode of 1 mm in thickness and width (We) of 5 or 10 mm (Fig. 1a). The wire was located in an air box adjacent to another box filled with a conductive medium (Fig. 1b). The electrode was in contact with the medium. Wire length (L) was varied from 50 mm to 800 mm in steps of 10 mm. Two distances (Ls) of 2.5 and 15 mm between wire and medium were evaluated. Lead electromagnetic models were calculated with the reciprocity approach described in2. To obtain the calibration factor A, the air box was excited from the side opposite to the contact face to the phantom by an ideal 123.2 MHz plane-wave source in the 3D EM domain. On all other faces an enclosed numerical domain radiation boundary was defined.Results and Discussion
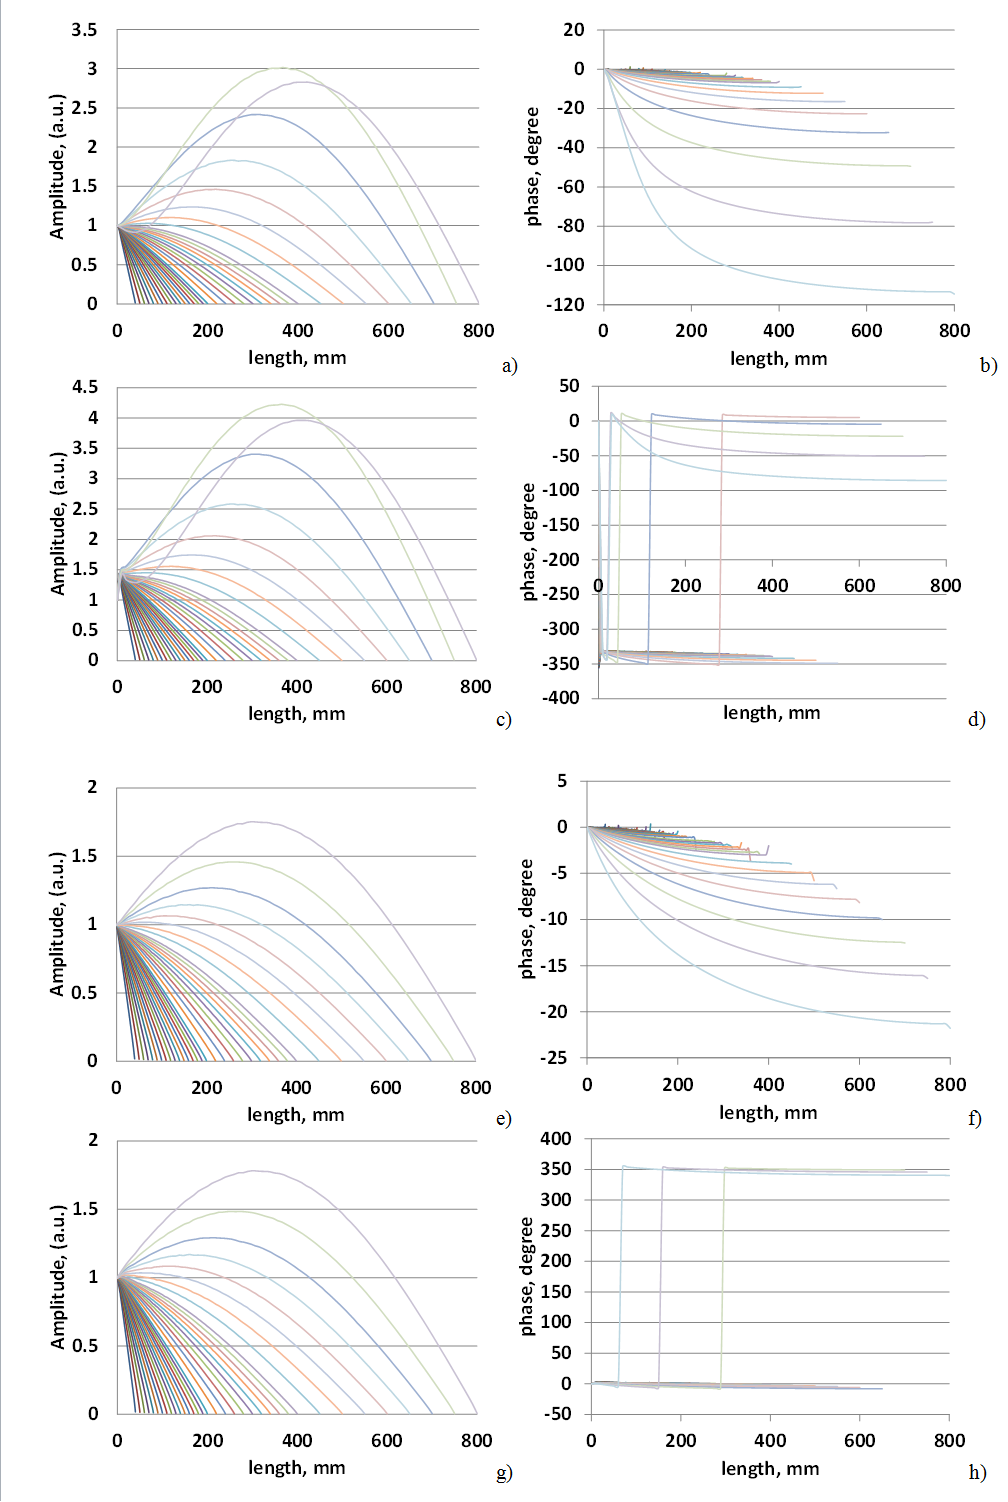
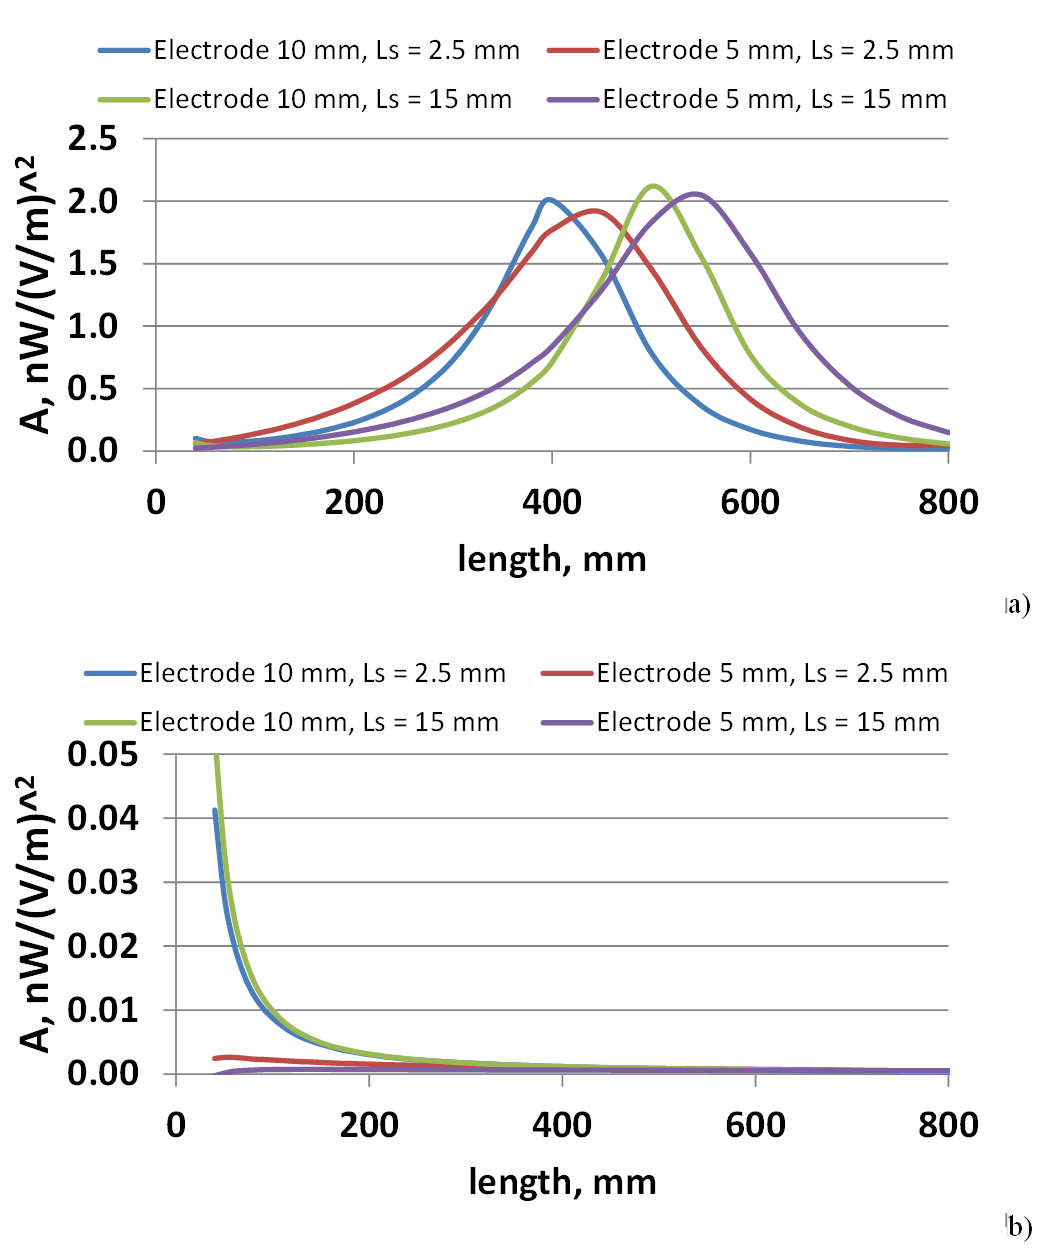
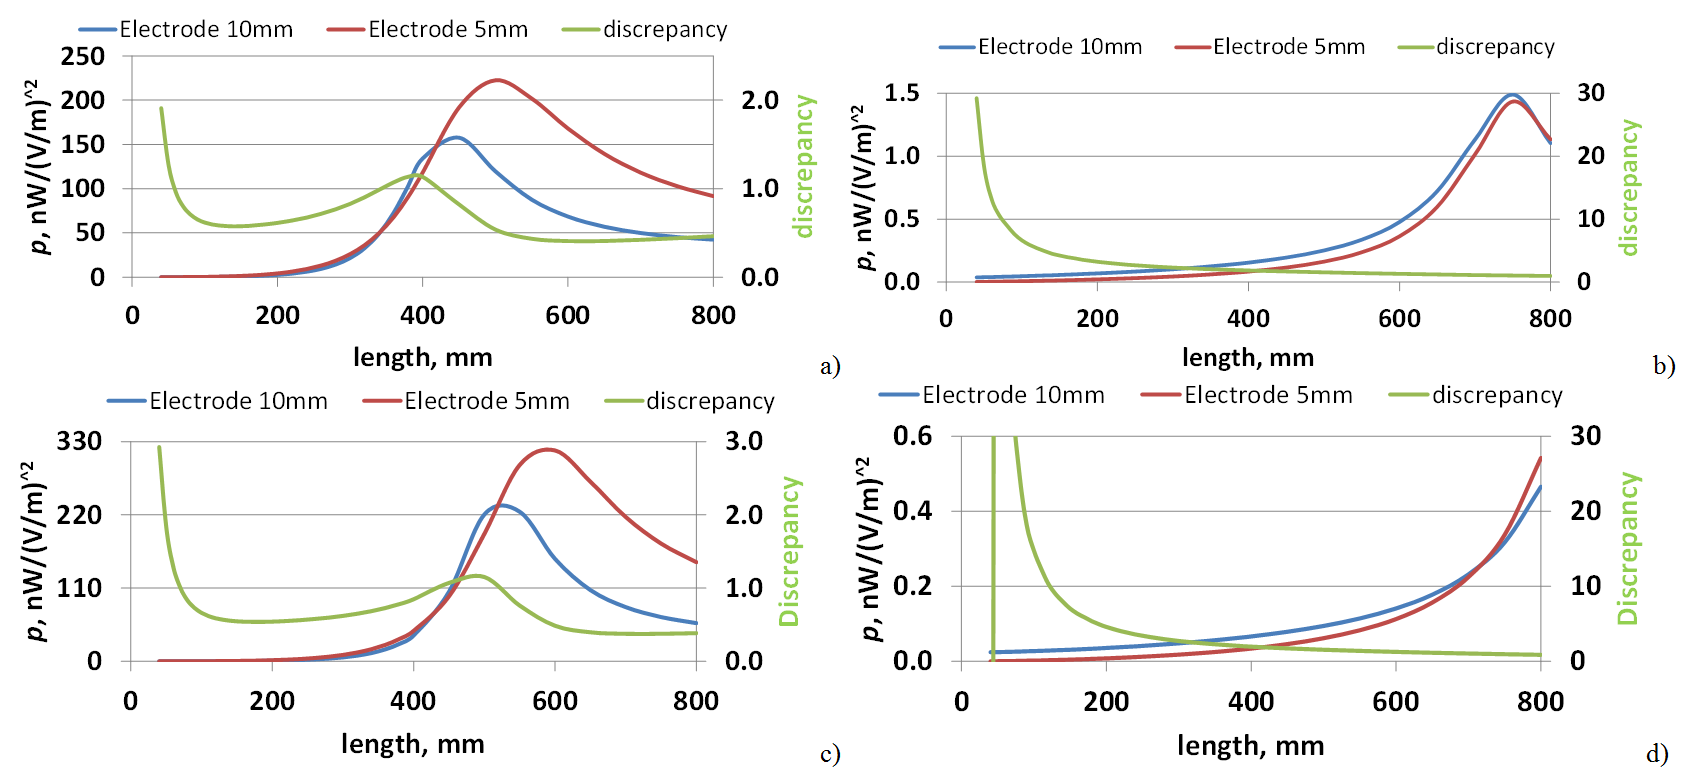
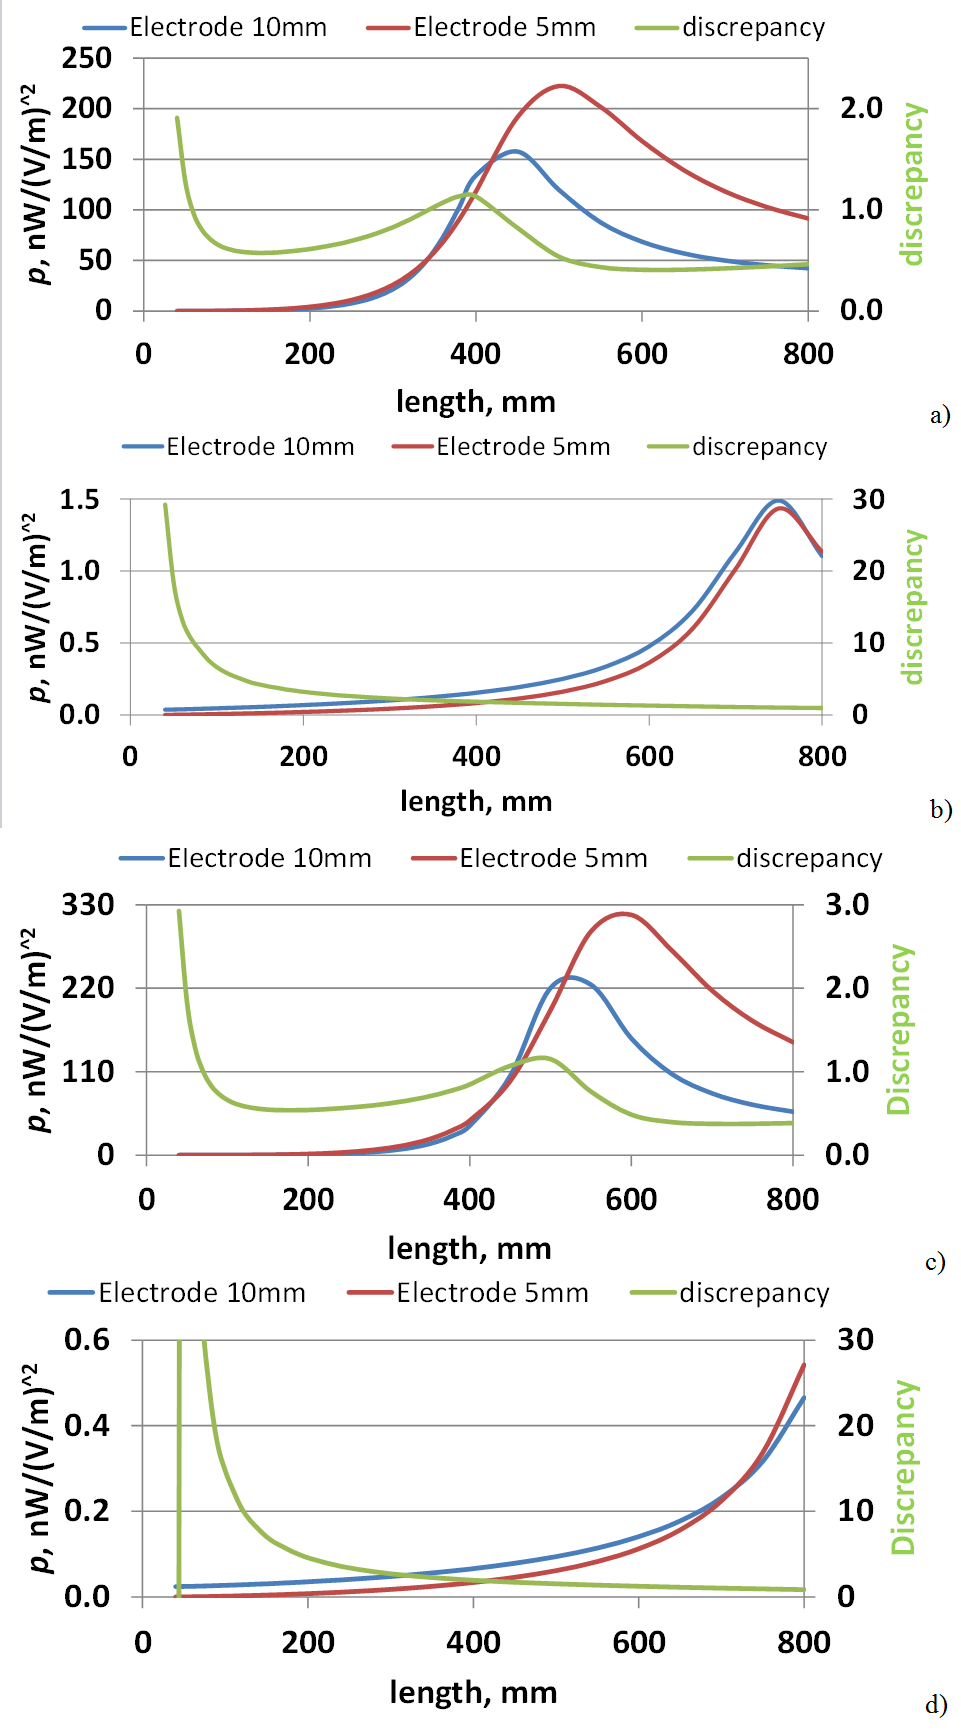
The S(z) significantly depends on Ls (Fig. 2), substantially depends on We and slightly depends on Rr. The A significantly depends on Ls and Rr (Fig. 3) and substantially depends on We. Due to limited space only S(z) for We=10 mm are presented in Fig. 2. For the investigated insulated wire, the electrical length of wire depended on We, Ls, and Rr. This dependence was significant and non-linear. Use of a resistor of Rr=10 kΩ resulted in a 100-fold decrease in power deposition. At 123.2 MHz increasing the distance between the wire and the human body can decrease or increase p. For the inverse phase distribution Etan(z) p were very close to the corresponding values obtained for the homogeneous Etan(z). This is due to the very small variation of φ(S(z)). Such behavior was very seldom observed for a lead located inside the human body. Our case study showed that a lead EM model can be calculated for a wire or lead located outside the human body contacting the skin through a electrode.Conclusion
Our case study provides strong evidence that at 123.2 MHz there is no worst-case distance between a wire and a human body that maximizes p for any wire length or electrode width. High impedance resistors used between a wire and an electrode can decrease p by several orders of magnitude. However, the resistor can also decrease the sensitivity of a given measurement modality (e.g. electroencephalography) thus a best trade-off should be found.Acknowledgements
No acknowledgement found.References
1. S-M. Park, K. Kamondetdacha, and J. A. Nyenhuis, Calculation of MRI-induced heating of an implanted medical lead wire with an electric field transfer function, J. Magn Reson Imaging, 26(5), 2007, 1278–1285.
2. S. Feng, R. Qiang, W. Kainz, and J. Chen, “A technique to evaluate MRI-Induced electric fields at the ends of practical implanted lead,” IEEE Transactions on Microwave Theory and Techniques, 63(1), 2015, 305-313.
Figures