2622
3D dB/dt measuring bench design and building for safety assessment1IADI, Université de Lorraine, Nancy, France, 2Healtis, Nancy, France, 3U947, INSERM, Nancy, France, 4CIC-IT 1433, University Hospital, Nancy, France
Synopsis
In this project, the goal was to build a 3D dB/dt measuring bench to map in the MR scanner gradients fields components and to detect critical positions for safety assessment. Such positions are mandatory to assess gradients induced vibrations worst cases as described in the ISO TS 10974.
Purpose
The main goal of this study was to provide a 3D dB/dt
measuring bench to map the MR tunnel in
order to detect in 3D dB/dt critical positions and allow to detect worst case positions
for safety and vibrations measurements according ISO TS 109741.Methods
Measurements were conducted on a 3T MRI system (MR750w, GE Healthcare, WI, USA).
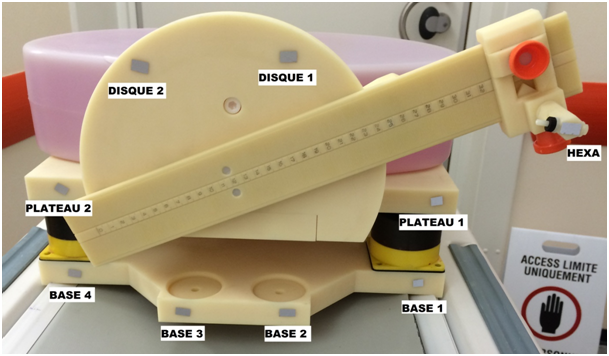
First component of our measuring bench is a MR compatible bench built with 4 air-cushions allowing mechanical decoupling with the MR table ensuring optimized measurements. It was home designed. It constitutes a cylindrical base and allows to fix our dB/dt sensor (and all devices of interest) in all possible positions in the MR tunnel as shown on Figure 1.
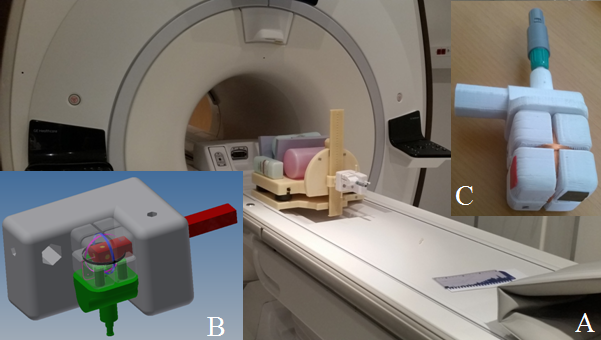
Second component of our measuring bench is a specific 3D research coil, which was home built. This dB/dt sensor is composed of 3 orthogonal coils as shown on Figure 2A. This allow to measure the three components of the dB/dt vector. According to Lenz-Faraday’s law, we have for each of the three coils the following relationship between electromotive force, or emf, and dB/dt: emf = -N*S*dB/dt, with N, the number of spire and S, the surface of the spire. We choose thin copper net, N=71 and S=2*π*3cm in order to spread measured induced emf between -10V and +10V.
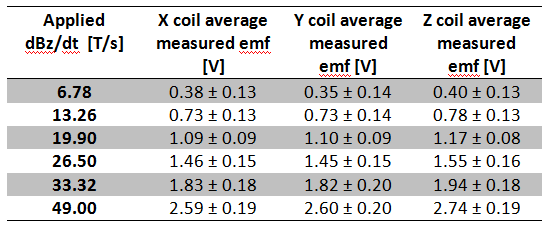
For our sensor calibration, a specific support was design and 3D printed to place and measure at the exact same location induced emf on each coil and dBz/dt using a magnetometer (THM1176, Metrolab, Germany) as displayed on Figure 2B. Each of the three coils was placed on our bench on this support, 30 cm far from isocenter orthogonaly to z-axis. Six different bipolar z-axis gradients with six different rise times were programmed leading to six different dGz/dt: 25/50/75/100/150/183 T/m/s with a TR of 0.5s. For each gradient values, induced emf on each coil were assessed. Then, again for each gradient values, dBz/dt was measured using a magnetometer. Emf values were recorded with a Labview acquisition system PXI. Both 3D dB/dt coil and magnetometer signals measurements were averaged on 10s measurements.
Calibration coefficients were extracted using linear regression analysis performed for each coil between its emf values against dBz/dt values obtained with the magnetometer. After calibration, dBz/dt along the central line in the MR tunnel (x=0, y=0) was assessed using the z-axis gradient producing the highest dBz/dt (183 T/m/s). Spatial steps along z-axis were in cm : [90 70 60 50 45 42.5 40 37.5 35 25 15 5 0 -5 -15 -25 -37.5 -40 -50].
Results
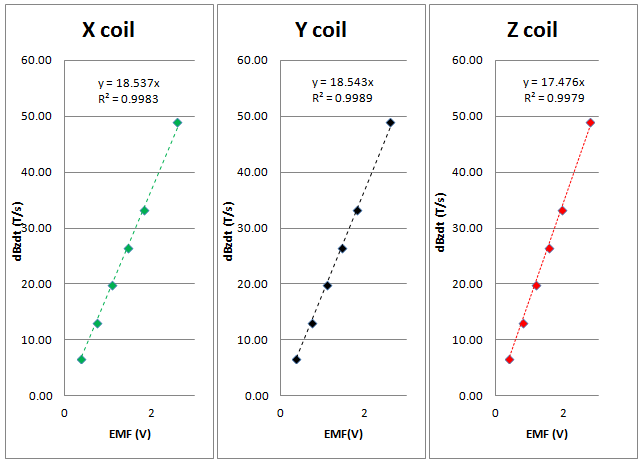
Calibration results are shown in Table 1. From
analysis, we obtained the following calibration coefficients for the X, Y and Z
coil respectively: dBz/dt=18.537*emf; dBz/dt=18.543*emf and dBz/dt=17.476*emf
respectively. Linear regression coefficient were very good (R2>0.997)
as displayed on Figure 3.
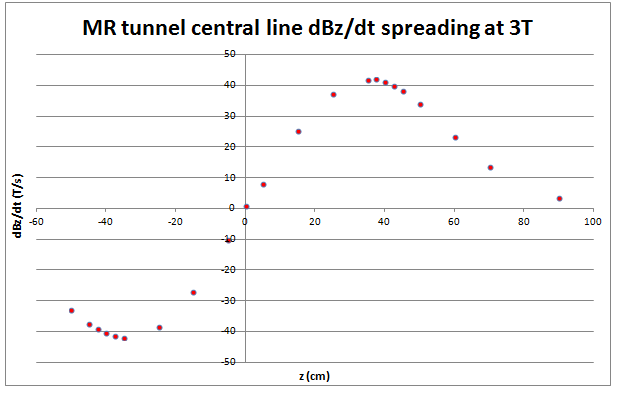
dBz/dt along the central line is presented on Figure 4.
Maximum positions on z axis line were around ±37.5 cm.
Discussions
Theoretical calibration coefficient was very close (19.926) from assessed ones in our study.
Results showed expected gradients field spatial distribution, however more spatial positions than the ones used to
measure dBz/dt on the MR tunnel central line are required to map more precisely dBz/dt.Conclusions
This study presented a new 3D dB/dt measuring bench.Its calibration was performed. A trade-off between a thinner spatial steps and interpolation should be assessed in order to map the dB/dt in the tunnel precisely and efficiently. Future works will consists in assessing 3D dB/dt coil reproducibility and then mapping the three components of dB/dt of the whole MR tunnel and extract position of interest e.g. position with the highest dB/dt to performed further safety analysis. Such a 3D map might be compared with gradients field model obtained in simulation.Acknowledgements
The authors thank the F.E.D.E.R. and the Région Lorraine for financial support.References
1. ISO/TS 10974:2012, "Assessment of the safety of magnetic resonance imaging for patients with an active implantable medical device", May 2012.Figures