2618
Multiparametric Comparison of Quantitative Susceptibility Mapping, R2*, and 89Zr-PET for Quantification of Targeted Magnetic Drug Therapy Biodistribution1Radiology and Biomedical Imaging, University of California San Francisco, San Francisco, CA, United States
Synopsis
Targeted magnetic drug delivery could reduce toxicity of transarterial chemoembolization when used in combination with a magnetic filtration device, and accurate quantification is necessary. We utilized 89Zr-iron oxide nanoparticles (IONP) to evaluate quantitative susceptibility mapping (QSM), R2*, and 89Zr-PET uptake. Phantom evaluations demonstrated linear correlation between QSM, R2*, and 89Zr-PET/MR. Substantial increase in QSM and R2* was observed in a single hepatic lobe in a preliminary in vivo experiment after injection using MR only. These cross-validated techniques demonstrate a linear relationship between IONP concentration and QSM, R2*, and 89Zr-PET in vitro and show promise in assessing magnetic nanoparticle tracking.
Introduction
Targeted drug delivery using magnetic nanoparticles (1,2) could reduce systemic toxicity of transarterial chemoembolization by conjugation to a chemotherapeutic drug, which is then extracted via the temporary deployment of an intravenous magnetic filtration device (3) downstream of a tumor. Current in vitro methods use 89Zr-iron oxide nanoparticles (IONPs) to measure particle capture (4) and accurate quantification of the drug distribution is necessary to show efficacy in vivo. Prior work demonstrated intrahepatic fusion of magnetic-targeted carrier-Doxorubicin via susceptibility artifact under MRI (5). The recent development of new imaging methods, such as PET/MR and quantitative susceptibility mapping (QSM) using ultra-short echo time (UTE) imaging, provides a unique opportunity to simultaneously acquire and compare several multiparametric techniques. UTE has been used to measure T2* (6), R2 (7) and QSM (8) of IONPs in phantoms. Other groups have previously measured R2* and QSM in liver with and without iron overload (9). Our goal was to compare QSM, R2*, and 89Zr-PET uptake in a phantom, and to test the feasibility of using MR to quantify the biodistribution of IONPs in the liver in vivo.Methods
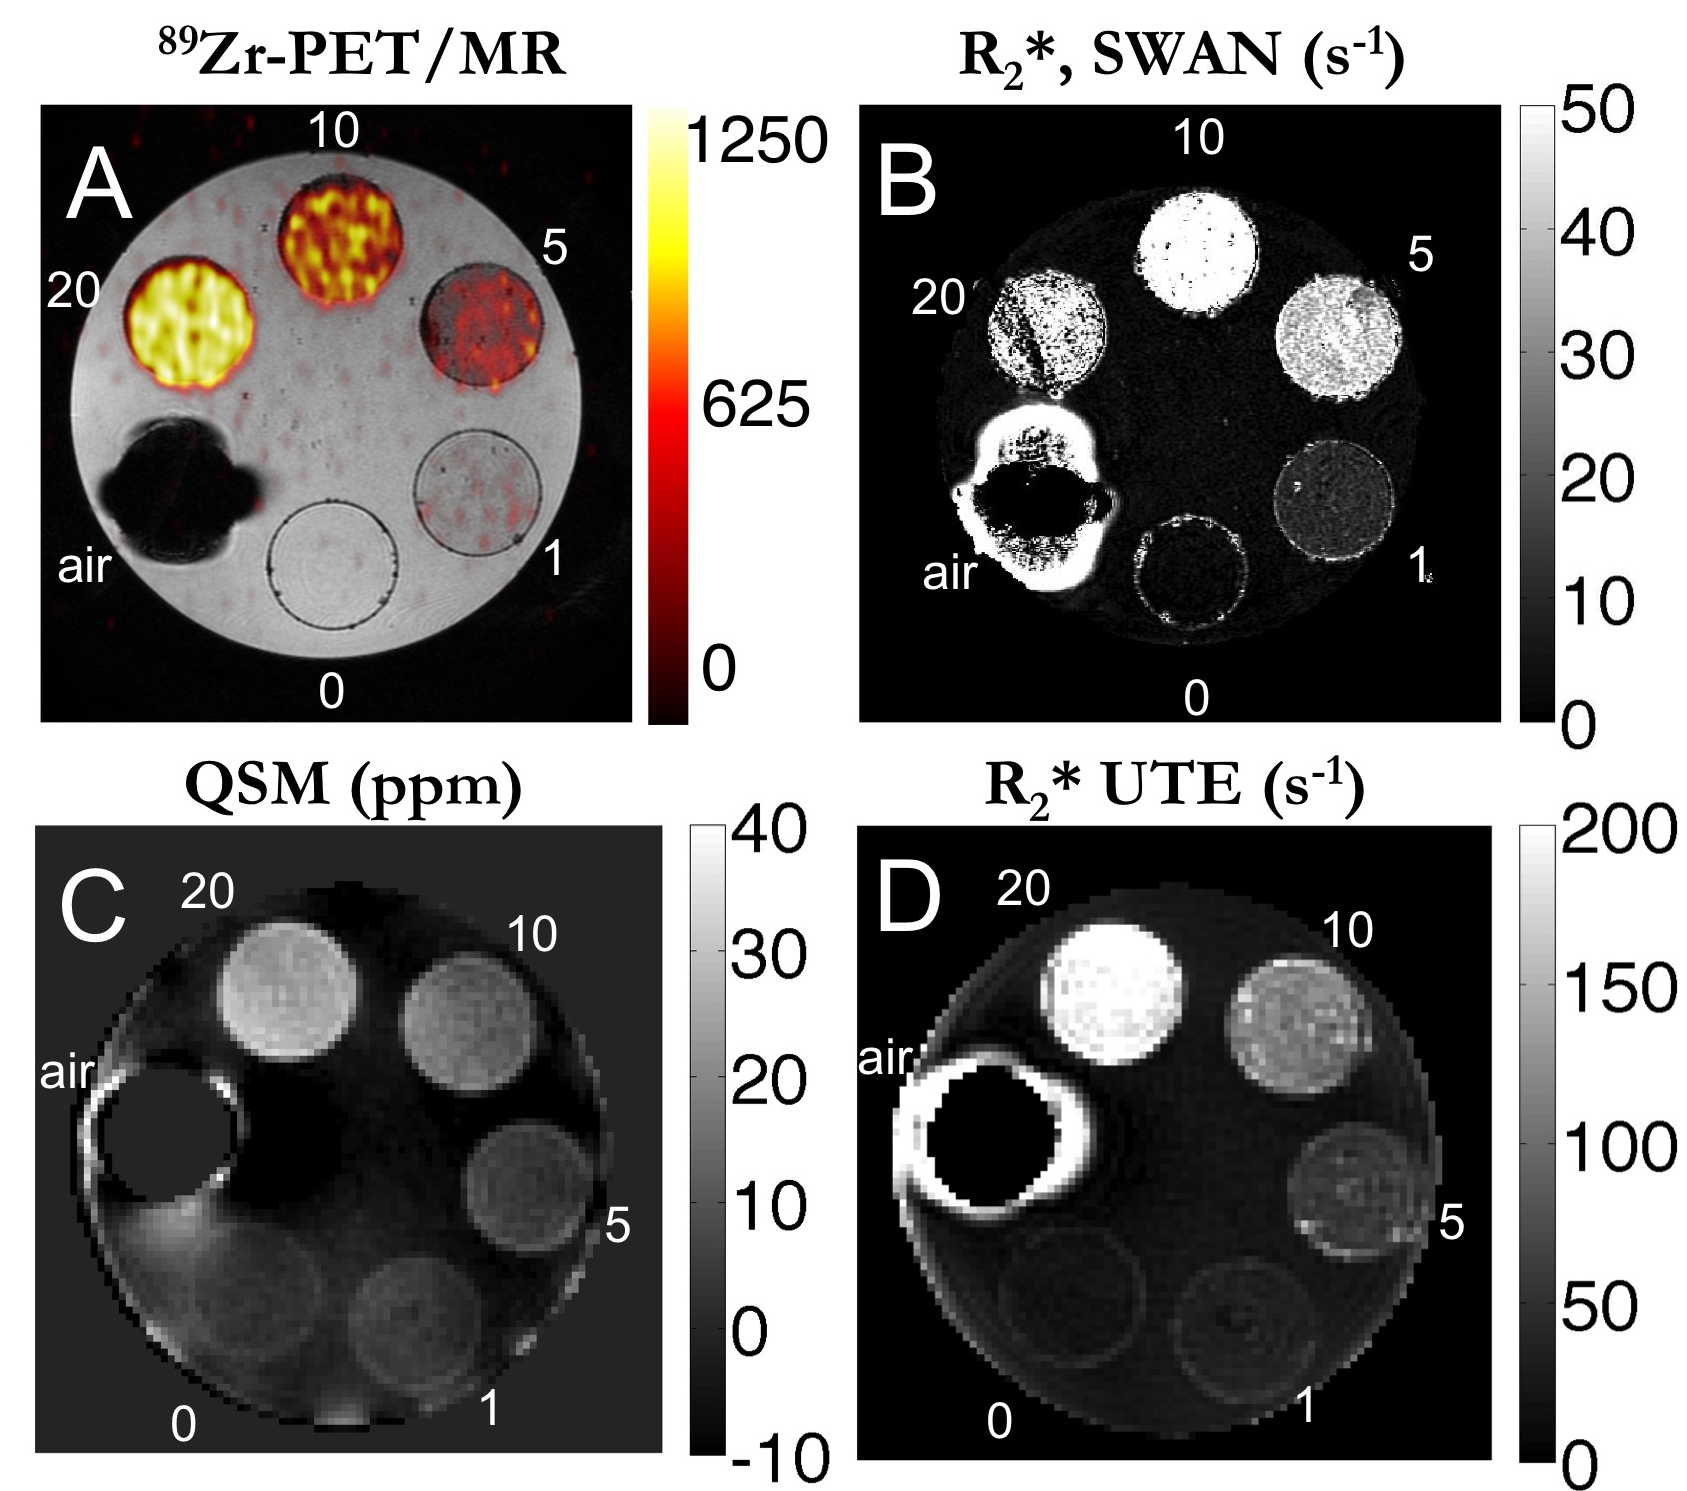
Phantom experiments: A phantom was constructed using a cylinder of gelatin with 5 ping pong balls with increasing concentrations of 0, 1, 5, 10, and 20 mg/L of radiolabeled 89Zr-IONP (Fe3O4). The 50–100 nm diameter IONPs were radiolabeled with a ratio of 2.5 × 10⁻⁶% of 25 mg IONPs. One ping pong ball remained empty with air for reference. A 3T PET-MR hybrid system (GE Healthcare, Milwaukee, WI) was used for the simultaneous acquisition of a 10 minute time-of-flight PET acquisition and a 3D multi-echo GRE sequence (SWAN) with TE = [13.0, 18.4, 23.9, 29.3, 34.8] ms, TR = 55.7 ms, and a 12-channel head coil. Separately, after radioactivity decayed to zero, a 3D multi-echo radial UTE sequence combined with non-selective hard pulse excitation was performed on a 3T MR750w scanner (GE Healthcare) using TE = [0.06, 1.9, 4.8, 6.7] ms, TR = 12.5 ms, and a 12-channel head coil.
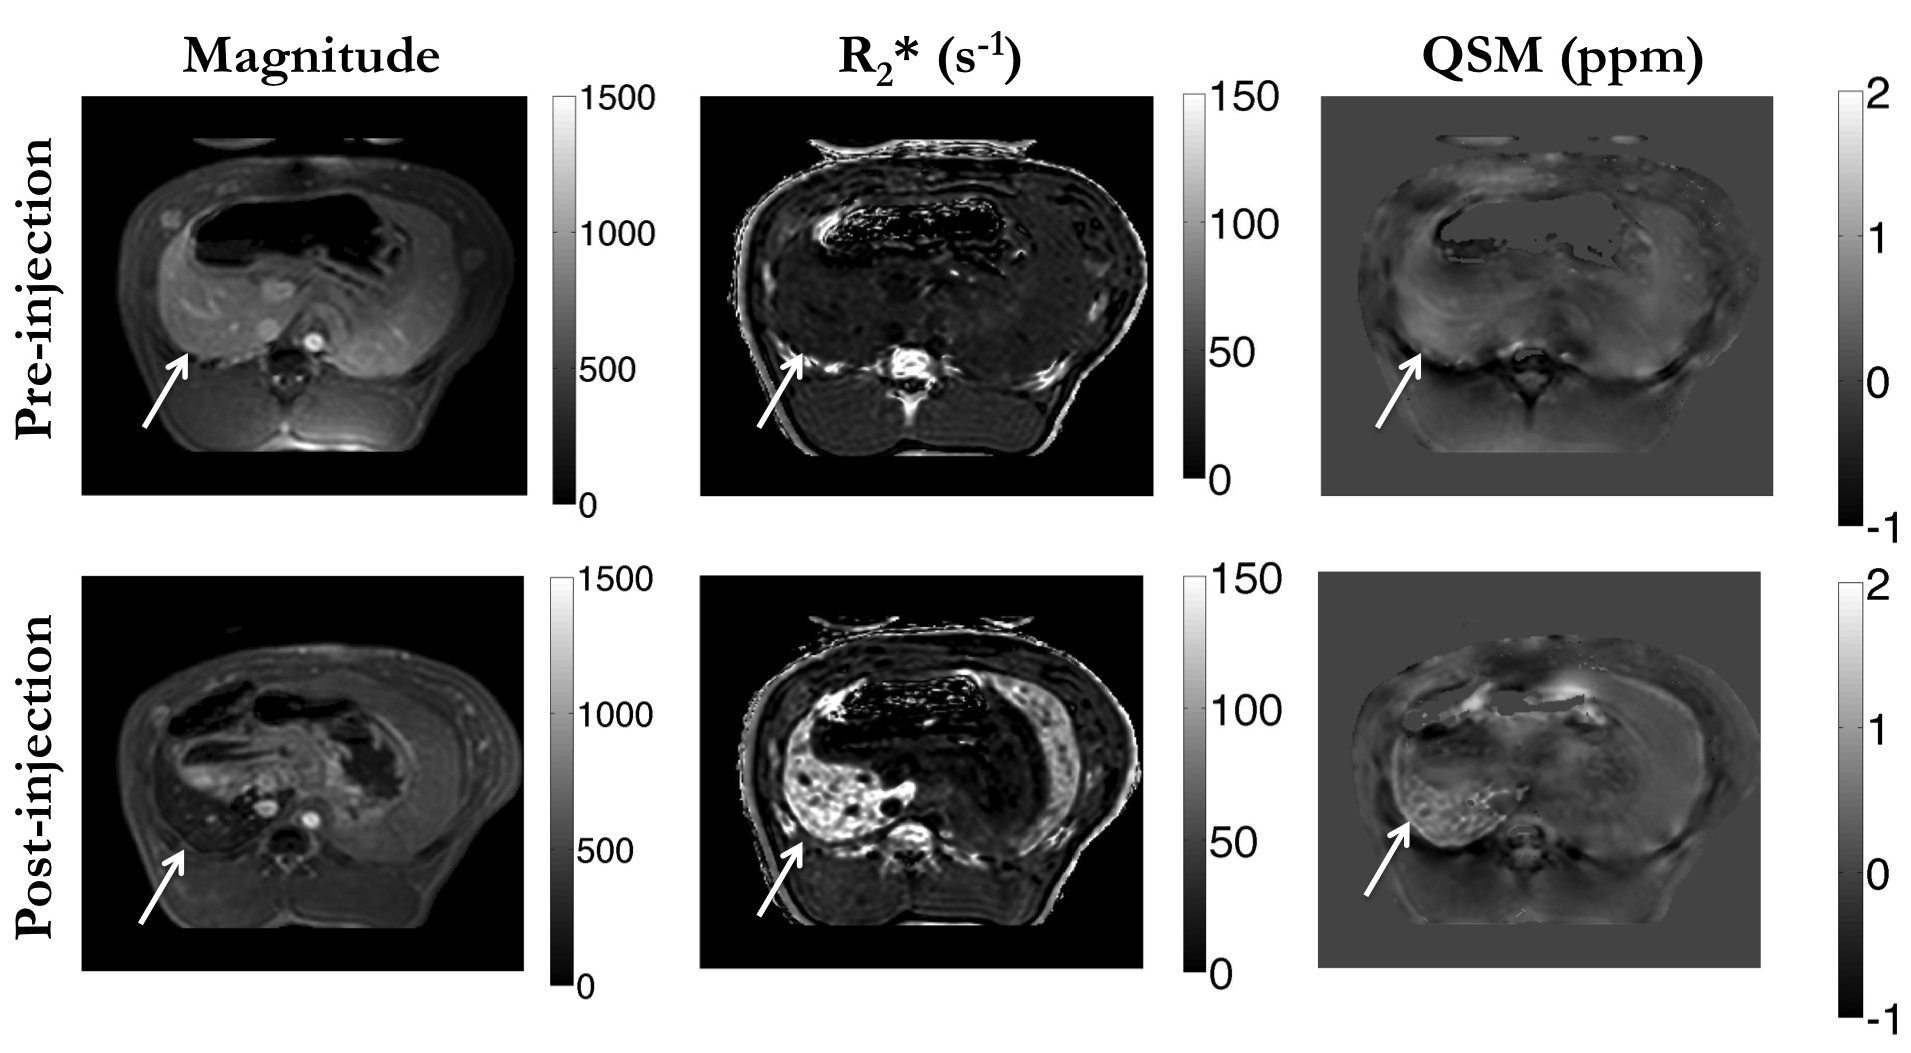
In vivo experiment: Under IACUC approval, we performed a preliminary in vivo experiment by injecting non-radiolabeled 100 mg IONPs in 50mL saline (2000 mg/L) in the common hepatic artery of a single swine. Using a breath-held multi-echo GRE on a 1.5T scanner (Achieva, Philips Healthcare) with TE = [7.0, 14.0, 21.0, 28.0, 35.0, 42.0] ms, TR = 47.0 ms, and a 4-channel body coil, we imaged the animal before the injection, infused over a 5-minute period outside the scanner room, then imaged again after 10 minutes.
Post-processing: To obtain the R2* maps, we performed a mono-exponential fit of the magnitude images, then took the inverse pixel-wise. We used STI Suite (10) to calculate susceptibility maps from the first echo of the phantom data, and the fourth echo of the in vivo data. Mean ± standard deviation of selected ROIs were calculated. A linear regression analysis between each imaging parameter and IONP concentration, then between each contrast mechanism, was performed using MATLAB (Natick, MA) and the coefficient of determination (R2) was calculated.
Results
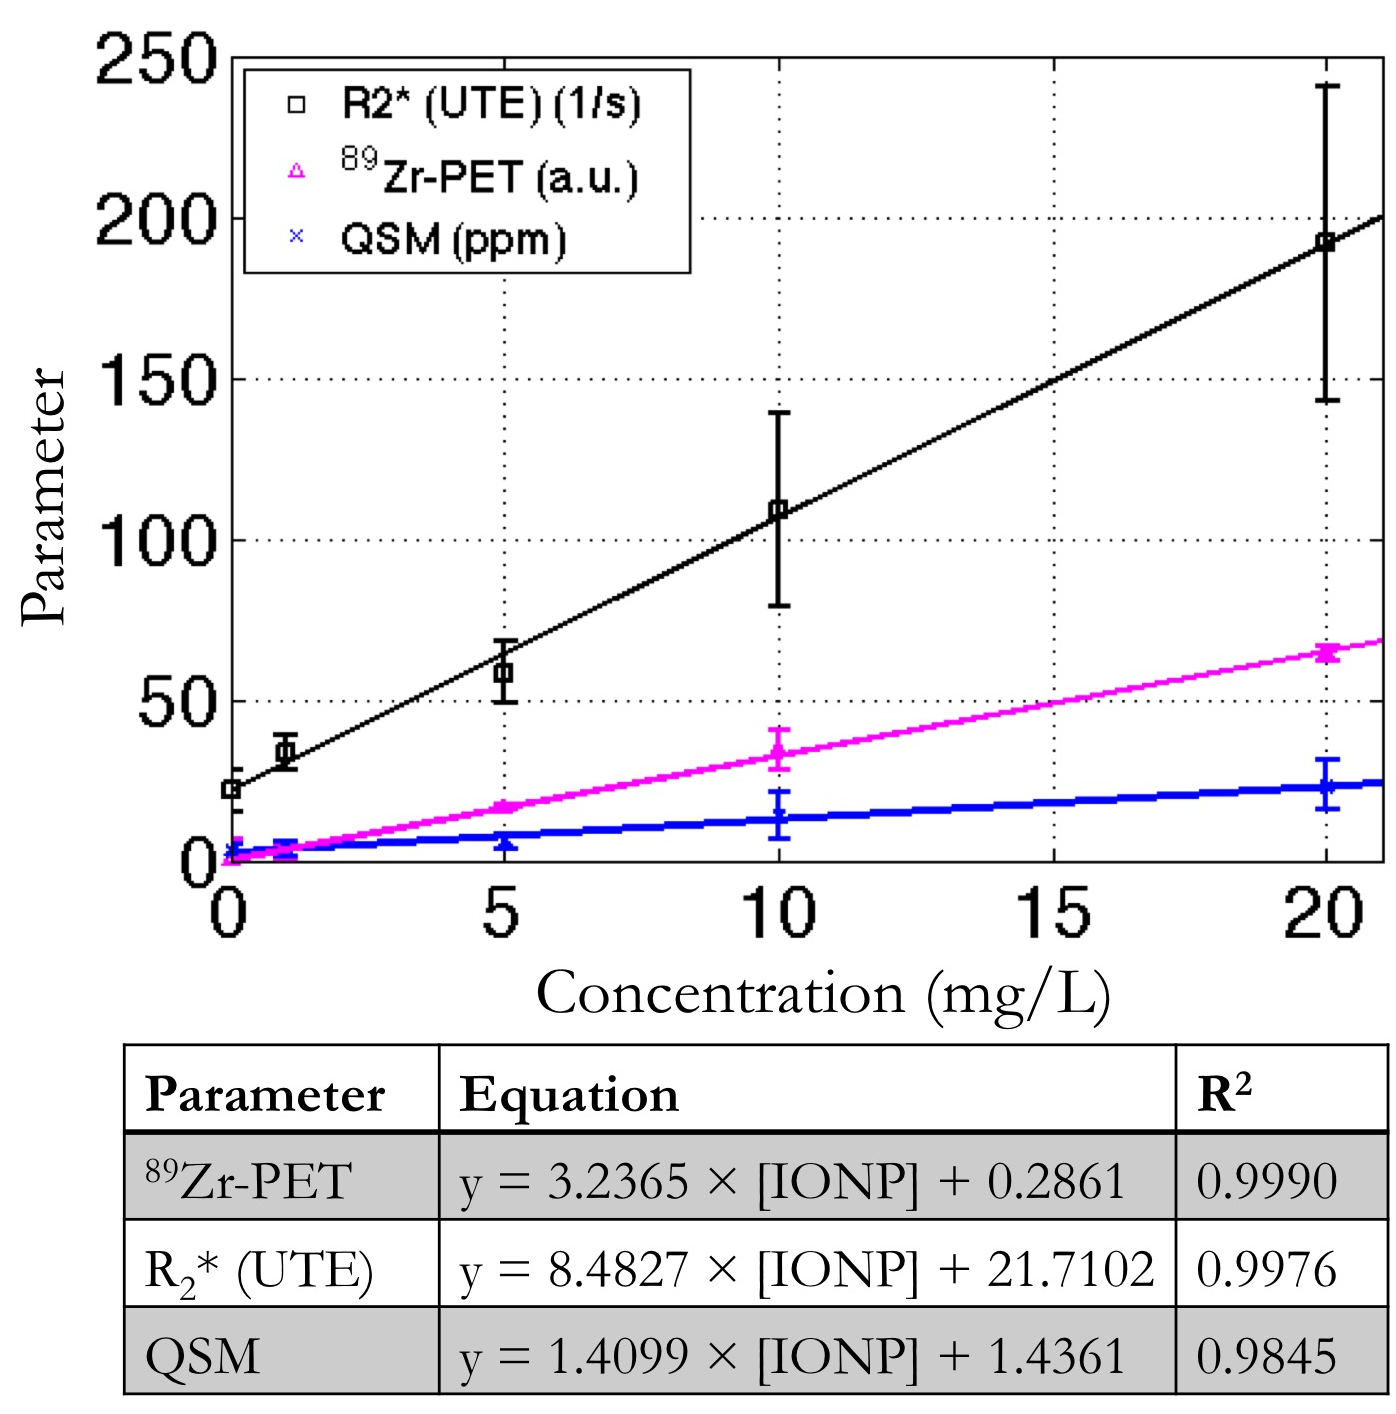
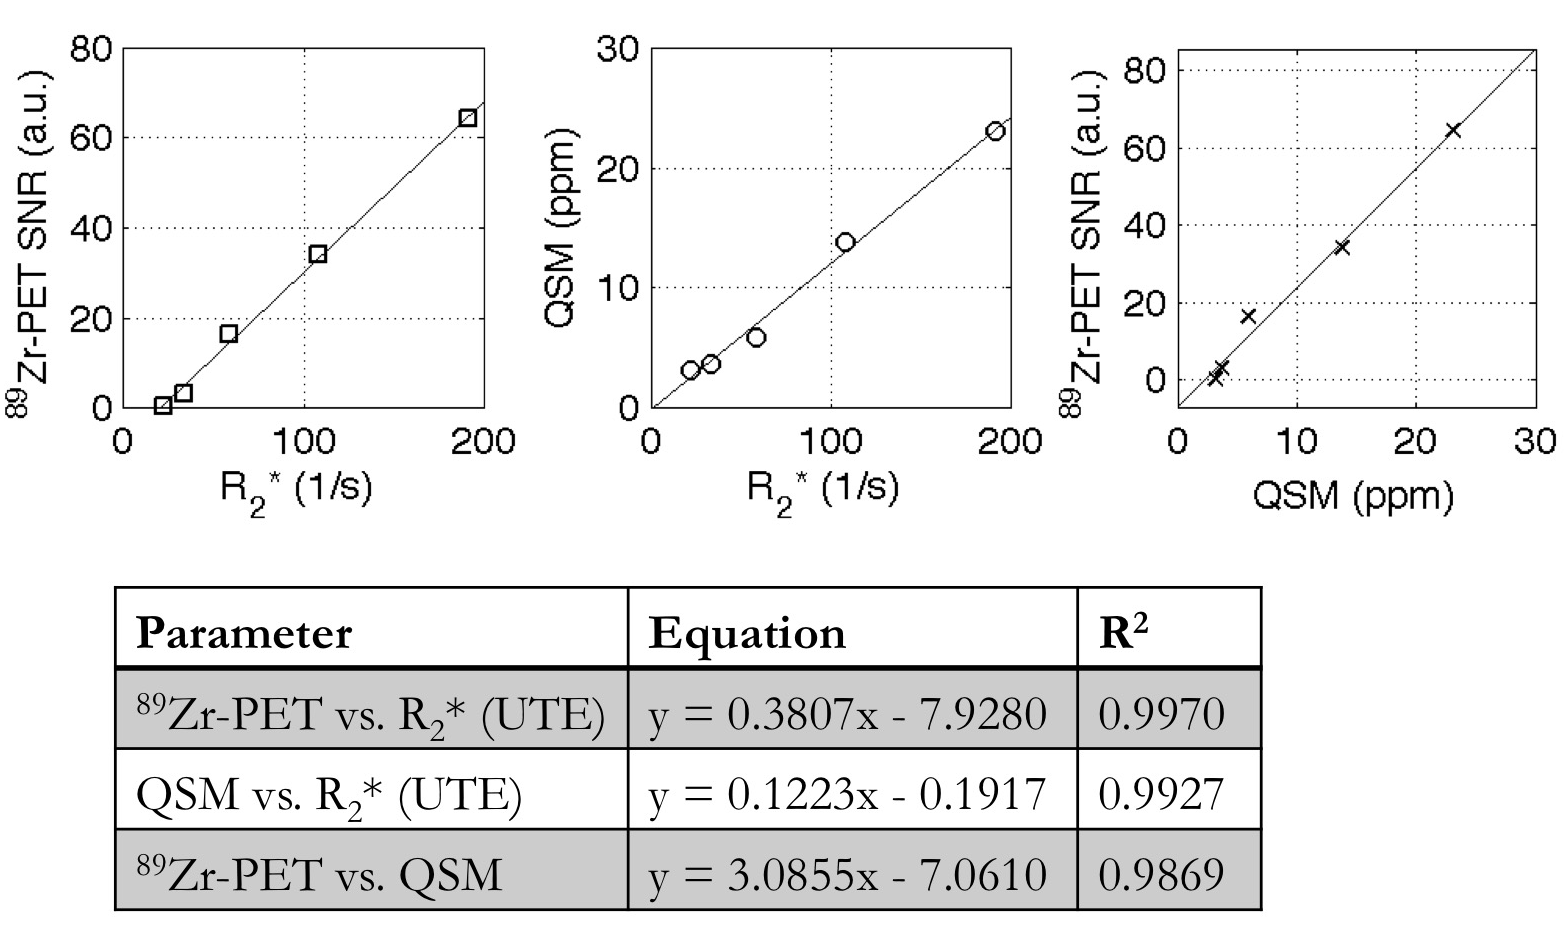
Phantom experiment: Figure 1A shows the 89Zr-PET/MR fusion on the SWAN R2* map (Fig. 1B), which had good fits for lower concentrations. The quantitative susceptibility map (Fig. 1C) the UTE R2* map (Fig. 1D) demonstrated good SNR. 89Zr-PET, R2* (UTE), and QSM had a linear relationship with radiolabeled IONP concentration, which were well described by the least-squares fit line (Fig. 2). 89Zr-PET, R2* (UTE), and QSM had a linear relationship with each other, which were also well explained by the least-squares fit line (Fig. 3).
In vivo experiment: Infusion of IONP in the common hepatic artery resulted in substantial changes in the posterior hepatic lobe before and after injection in the R2*, and QSM images (Fig. 4). The mean susceptibility increased from 0.23 ± 0.11 ppm to 0.45 ± 0.21 ppm and mean R2* increased from 23.1 ± 4.8 1/s to 105.7 ± 27.7 1/s.
Discussion
QSM, R2* (UTE), and 89Zr-PET had a good linear relationship with the iron oxide concentration in phantoms that was well explained by the equation, and also demonstrated good cross-correlation. Substantial increase in QSM and R2* was observed in a single posterior lobe of the liver in a preliminary in vivo experiment after injection of magnetic nanoparticles, indicating that QSM and R2* may be feasible for in vivo radiolabeled IONP injections.Conclusion
These multiparametric techniques were cross-validated to demonstrate a linear relationship between IONP concentration and QSM, R2*, and 89Zr-PET in vitro. A preliminary in vivo study demonstrated proof of principle for assessing magnetic nanoparticle tracking.Acknowledgements
This work is supported by NIH R01 EB012031. The authors gratefully acknowledge Dr. Hongjiang Wei and Dr. Chunlei Liu for assistance with STI Suite and Dr. Youngho Seo assistance with PET imaging parameters.References
1. Thomsen LB, Thomsen MS, Moos T. Targeted drug delivery to the brain using magnetic nanoparticles. Ther Deliv. 2015 Oct;6(10):1145–55.
2. Dobson J. Magnetic nanoparticles for drug delivery. Drug Development Research. 2006. p. 55–60.
3. Mabray MC, Lillaney P, Sze C-H, et al. In Vitro Capture of Small Ferrous Particles with a Magnetic Filtration Device Designed for Intravascular Use with Intraarterial Chemotherapy: Proof-of-Concept Study. J Vasc Interv Radiol. 2016 Mar 16;27(3):426–432.e1.
4. Kondapavulur S, Cote AM, Neumann KD, et al. Optimization of an endovascular magnetic filter for maximized capture of magnetic nanoparticles. Biomed Microdevices. 2016;In Press.
5. Wilson MW, Kerlan RK, Fidelman NA, et al. Hepatocellular carcinoma: regional therapy with a magnetic targeted carrier bound to doxorubicin in a dual MR imaging/conventional angiography suite - initial experience with four patients. Radiology. 2004;230:287–93.
6. Girard OM, Du J, Agemy L, et al. Optimization of iron oxide nanoparticle detection using ultrashort echo time pulse sequences: Comparison of T1, T2*, and synergistic T1 − T2* contrast mechanisms. Magn Reson Med. 2011 Jun;65(6):1649–60.
7. Seethamraju RT, Nielles-Vallespin S, Huang S, Sosnovik DE. Optimization of Ultrashort TE Imaging for Angiography and Molecular Imaging of Iron-Oxide Nanoparticles. Proc Intl Soc Mag Reson Med. 2010. p. 3743.
8. Liu T, Spincemaille P, de Rochefort L, Wong R, Prince M, Wang Y. Unambiguous identification of superparamagnetic iron oxide particles through quantitative susceptibility mapping of the nonlinear response to magnetic fields. Magn Reson Imaging. 2010;28(9):1383–9.
9. Sharma SD, Hernando D, Horng DE, Reeder SB. Quantitative susceptibility mapping in the abdomen as an imaging biomarker of hepatic iron overload. Magn Reson Med. 2015 Sep;74(3):673–83.
10. Li W, Avram A V., Wu B, Xiao X, Liu C. Integrated Laplacian-based phase unwrapping and background phase removal for quantitative susceptibility mapping. NMR Biomed. 2014;27(2):219–27.
Figures