2610
Feasibility of Zero TE MR based Radiation Therapy Planning for Head and Neck application1GE Global Research, Munich, Germany, 2Department of radiation sciences, Umeå University, Umeå, Sweden, 3GE Healthcare, Danderyd, Sweden
Synopsis
We describe a method to convert Zero Echo Time (ZTE) MR images into synthetic CT at the resolution required for Radiation Therapy (RT). The method was tested for the head and neck application on N=8 patient data. The dose was calculated with a RT planning software and the results were compared relative to co-registered CT data.
Purpose
The demand of MRI in Radiation Therapy is rapidly growing due to its superior soft tissue contrast when compared to CT. To enable its use for RT, treatment planning results comparable to CT need to be demonstrated. Key to reaching this goal are the accurate tissue density estimation and the geometrical accuracy from MR data. ZTE MR imaging was recently demonstrated for robust and efficient bone depiction as well as for its relevance in the context of PET/MR attenuation correction1,2. The purpose of this study is to demonstrate ZTE based derivation of synthetic CT for MR-based RT planning.Methods
Eight patients were enrolled in this study per ethical approval Dnr 2014-269-32M. A 3-tesla GE SIGNA PET/MR scanner (GE Healthcare, Waukesha, WI) and a GEM head array coil were used for ZTE data acquisition. The following proton density weighted parameters were used: FA=1deg; BW=125kHz; FOV=26.4 cm; res=1.4mm. A CT scan was also provided for each patient.
ZTE data were normalized by setting the soft tissue intensity to 1. A high intensity artifact in case of patient proximity to the receive coil was observed and a damping for ZTE values larger than one was introduced not to allow them to exceed the value of 1.2. A histogram-based bias correction was then implemented in a multiresolution approach1. A threshold-based pixel conversion was applied where for air (ZTE <0.2) and soft tissue (ZTE>0.8) a fixed value of -1000 and 42 Hounsfield Units was assigned respectively while for bone an inverse linear scaling was used1. Partial volume effects (PVE) at the boundary between soft tissue and air resulted in voxels with an apparent bone density, while PVE on bone/soft tissue boundaries resulted in underestimation of spinal bone. Both were identified and reclassified based on neighborhood information. The 1.4 mm isotropic resolution was not sufficient to resolve the dense presence of air/tissue interfaces in the nasal sinus causing an excess of bone false positives. Therefore, the nasal region was identified based on two anatomical landmarks (air distributions and neck position) and no bone was then allowed in the nasal sinus. Below, a connected component analysis within the air/tissue interfaces ensured proper segmentation of the trachea and lungs.
The ZTE based synthetic CTs were imported into the RT planning software. Rigid registration provided by this software was used to match corresponding CT scans for each patient. A treatment plan was then computed based on the CT data set, evaluated on both sets and compared. Gamma pass rates calculated by the software MICE (Medical Interactive Creative Environment, Umeå University, Sweden3) were also used to compare each pair of results.
Results
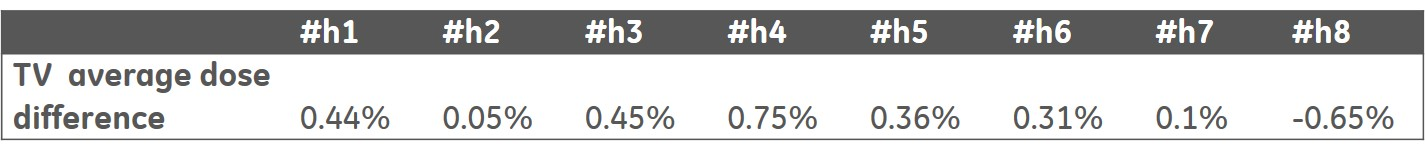
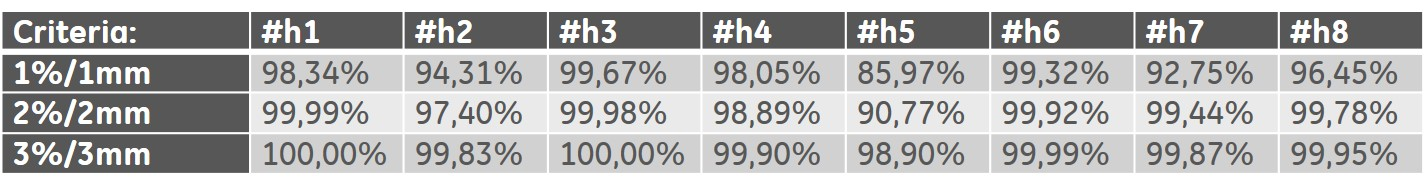
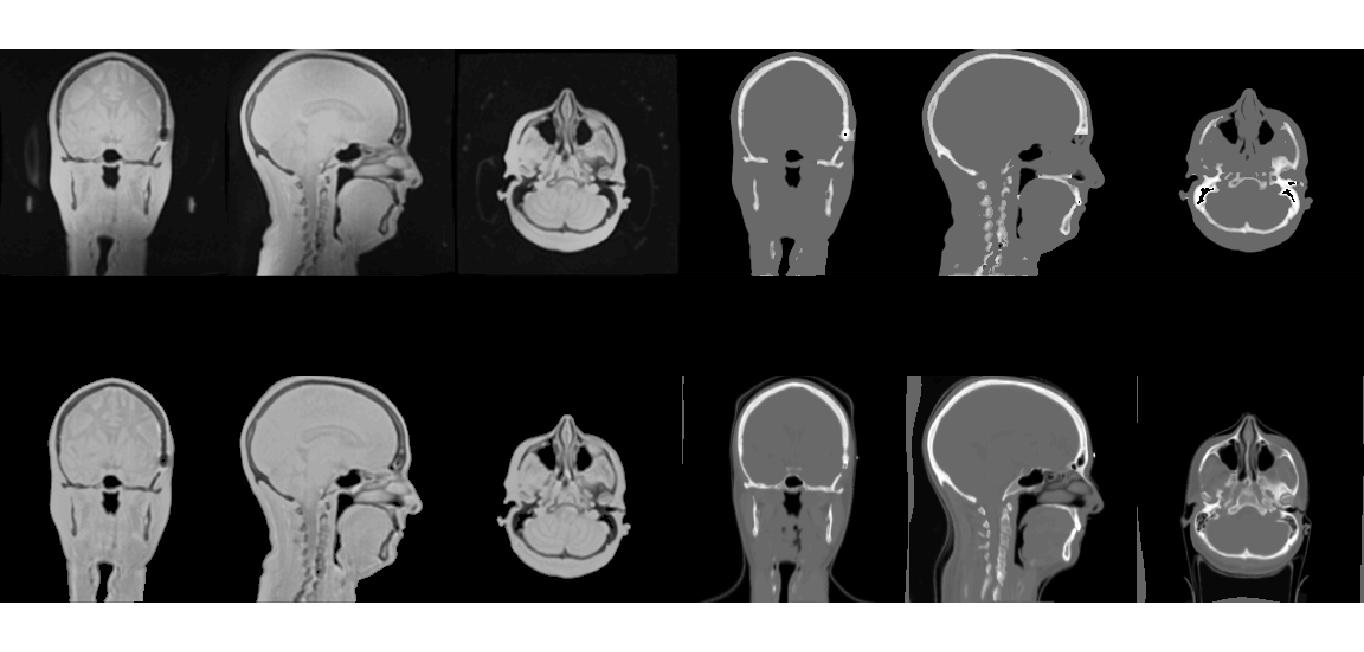
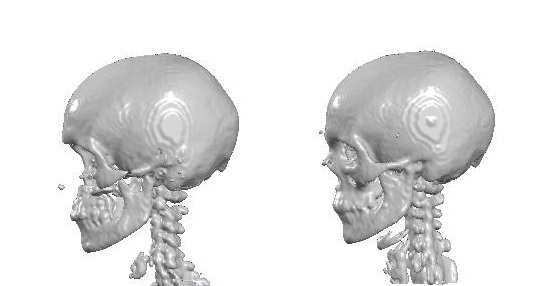
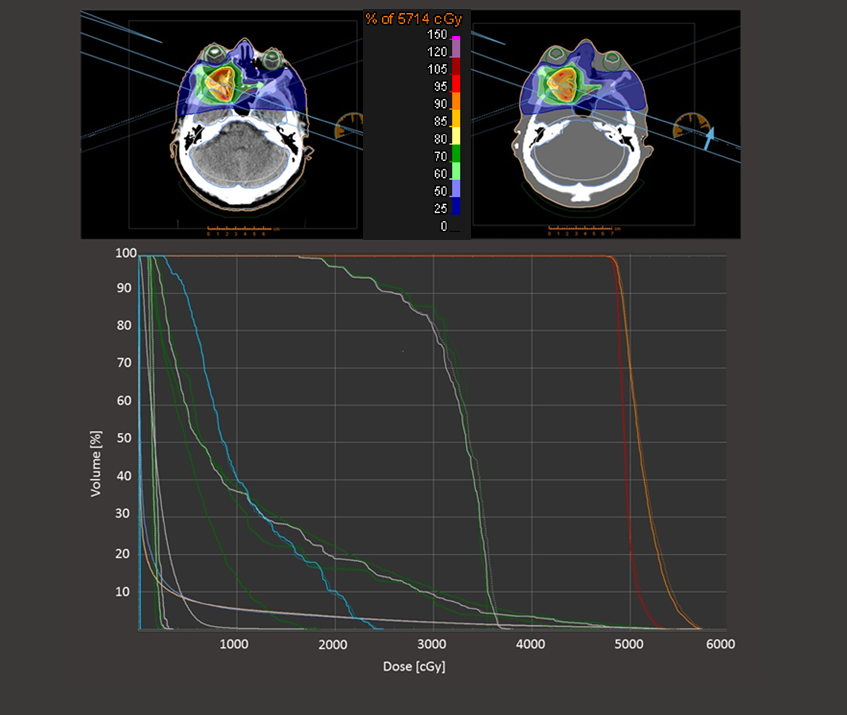
In Figure 1 the ZTE raw data are shown at the top left, the bias corrected data at the bottom left, followed by the synthetic CT (top right) and the co-registered CT data (bottom right). With th exception of the nasal sinus, good correspondence between the synthetic and real CT can be observed, including the spine depiction. In figure 2, a 3D bone rendering of the same data is presented. In figure 3 the treatment planning for the synthetic CT and the real CT is shown for the same patient which shows a deviation in average dose on the Target Volume (TV) <0.5%. The TV average dose difference for all patients is shown in Table 1. The gamma pass rate defined as the percentage of points satisfying a given criteria, was calculated over the full volume (defined by the CT scan) for three different criteria as shown in Table 2. The patient (#h1) in the tables indicates the results for the patient shown in figures 1, 2 and 3.Discussion and Conclusion
The feasibility of ZTE for MR based Radiation Therapy planning was discussed. We demonstrated proton density weighted ZTE to be a robust contrast mechanism to segment air, bone and soft tissue. The correspondence between synthetic CT and real CT and the bone depiction for both imaging modes was shown. The deviations on the TV are very small (<1%) also in the case of #h5 where gamma pass rates were inferior to average.
These results suggest that the ZTE protocol and the derived synthetic CT are a suitable imaging method for Radiation Therapy Planning.
Acknowledgements
No acknowledgement found.References
1. F. Wiesinger et al., „Zero TE MR bone imaging in the head“, Magnetic Resonance in Medicine (2015)
2. F. Wiesinger et al. “ZT-AC: Zero-TE based PET/MR attenuation correction, ISMRM Singapore (2016)
3. http://gentleradiotherapy.se/downloads/mice/
Figures