2605
Stepwise optogenetic activation of the rat thalamic nuclei with MRI-guided robotic arm (MgRA)1Research Group of Translational Neuroimaging and Neural Control, High-Field Magnetic Resonance, Max Planck Institute for Biological Cybernetics, Tuebingen, Germany, 2Graduate School of Neural Information Processing, University of Tuebingen, Tuebingen, Germany
Synopsis
An MRI-guided multiple degree-of-freedom robotic arm positioning system is developed to guide the fiber optic insertion inside a small animal MRI scanner. The fiber optic is positioned at different depth in the rat thalamus to deliver light pulses for optogenetic fMRI. The corresponding functional spatial patterns and time courses can be achieved in a stepwise manner. The MgRA positioning system provides an alternative way to study global functional projections by mapping fMRI signals driven optogenetically from different brain nuclei.
Target Audience
Scientists who are interested in high resolution
fMRI, cerebrovascular imaging and optogenetics.Introduction
Cortical states profoundly regulate many aspects
of behavior, from states of consciousness to perception, learning and cognition1.
The thalamus contains ~40 nuclei, each innervating a different combination of
cortical areas2. It remains challenging to characterize the
precise functional projections of individual thalamic subdivisions to the
cortex despite the existing resting-state functional connectivity mapping
schemes3. Optogenetic fMRI allows visualization of the causal effects of
specific neural projection circuits defined not only by genetic identity and
cell body location, but also by axonal projection target4. Therefore,
an MRI-guided robotic arm (MgRA) positioning system with high targeting
accuracy and precision is crucial to target optic fiber at different thalamic nuclei
and map the BOLD-fMRI functional patterns globally. Methods
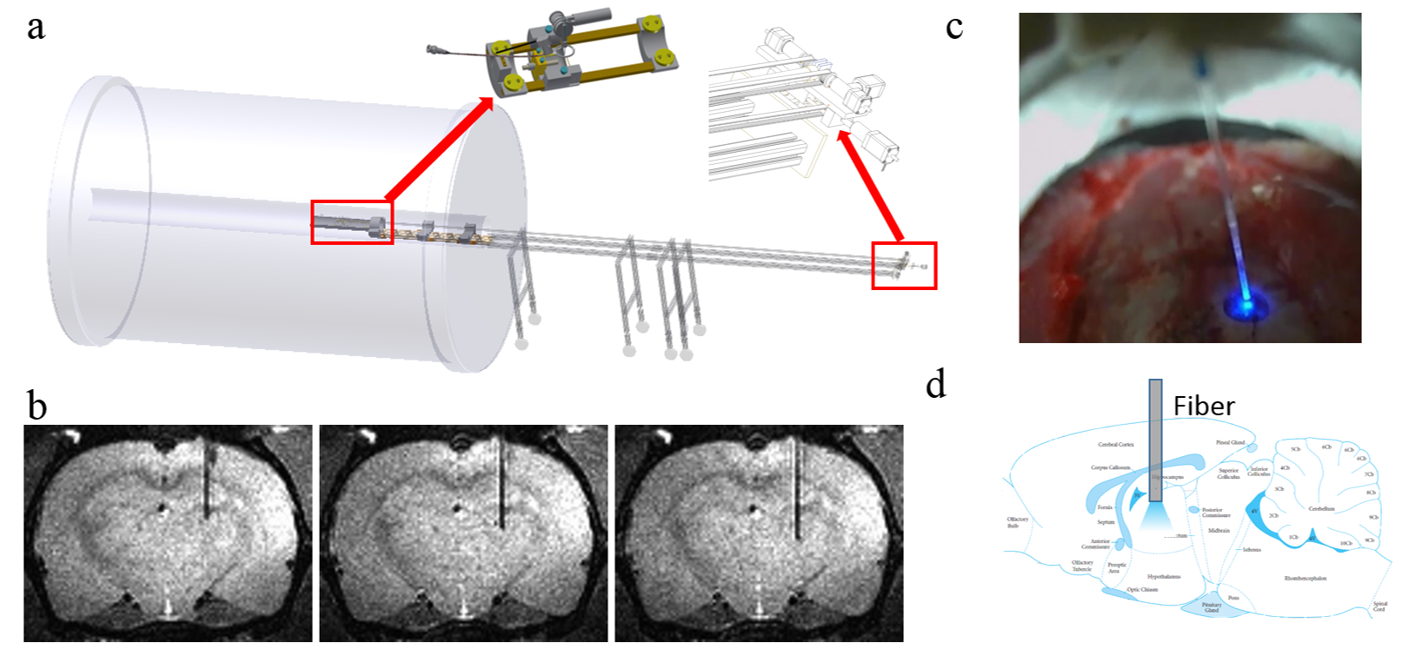
An MRI-compatible MgRA positioning system was
developed for the 14.1T horizontal MR scanner with 12cm inner diameter gradient
(Fig.1a). Fig.1c illustrates the camera-based visual guidance of fiber optic
positioning on the rat skull craniotomy at the iso-center of the horizontal
bore magnet. Driven by MgRA, the optic fiber was inserted to target multiple
coordinates in the thalamus. A 24mm-diameter custom-designed transmit/receive
surface coil was attached on the rat head. Anatomical images for fiber location
were acquired using 2D rapid acquisition with relaxation enhancement sequence:
TR, 1200ms, TE, 7ms, 1.92cmX1.50cm FOV, 128X100 matrix, 150X150um in-plane
resolution, 800um thickness. fMRI scans were performed using 3D Echo
planar imaging sequence: TR, 1.5s, TE,11.5ms, 1.92X1.92X1.92cm3 FOV, 48X48X48 matrix, 400X400X400 um3 spatial resolution. Fig.1b demonstrates three
continuous MRI images with step distance 400um. AAV5.CAG.ChR2.mcherry
viral vectors were stereotaxically injected in the thalamus in 4-week old rats.
The detailed surgical procedures for
optogenetic fMRI were described previously5. The
optical fiber(~200um) delivered blue light pulses (473nm) at 5Hz, 10ms width with
4s duration for the fMRI block design. The
EPI-fMRI data were acquired in a stepwise manner when the fiber optic was
inserted at different locations of the thalamus. MRI data analysis was
performed using Analysis of Functional NeuroImages software(NIH, Bethesda).Results
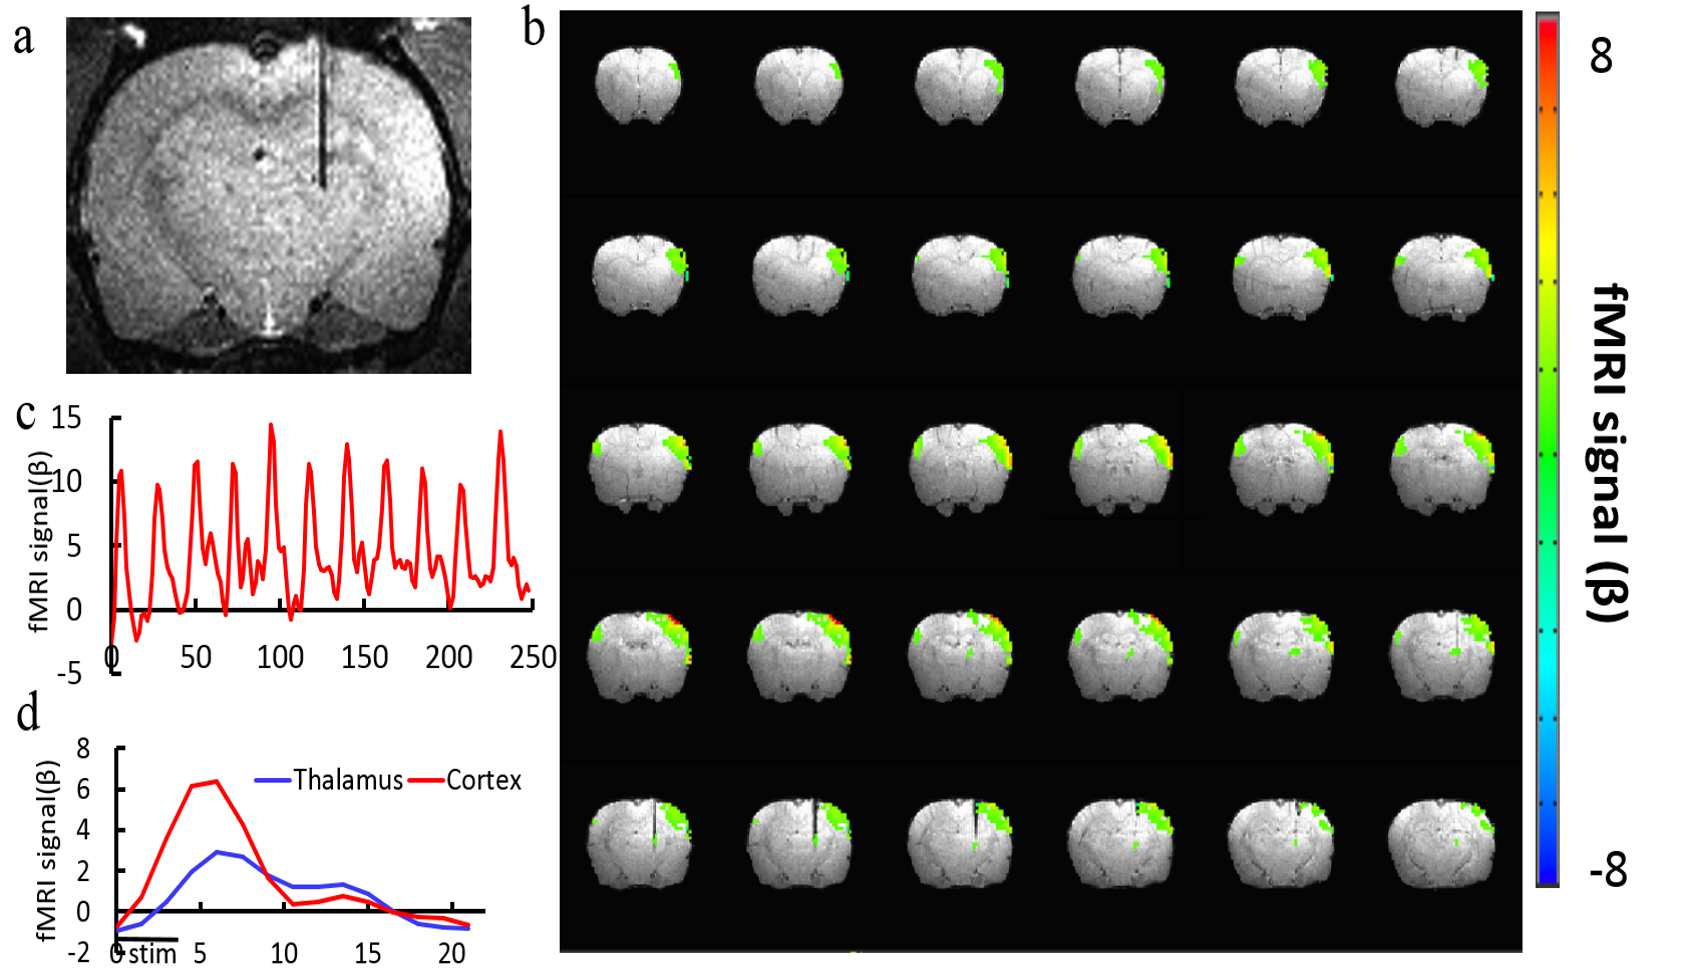
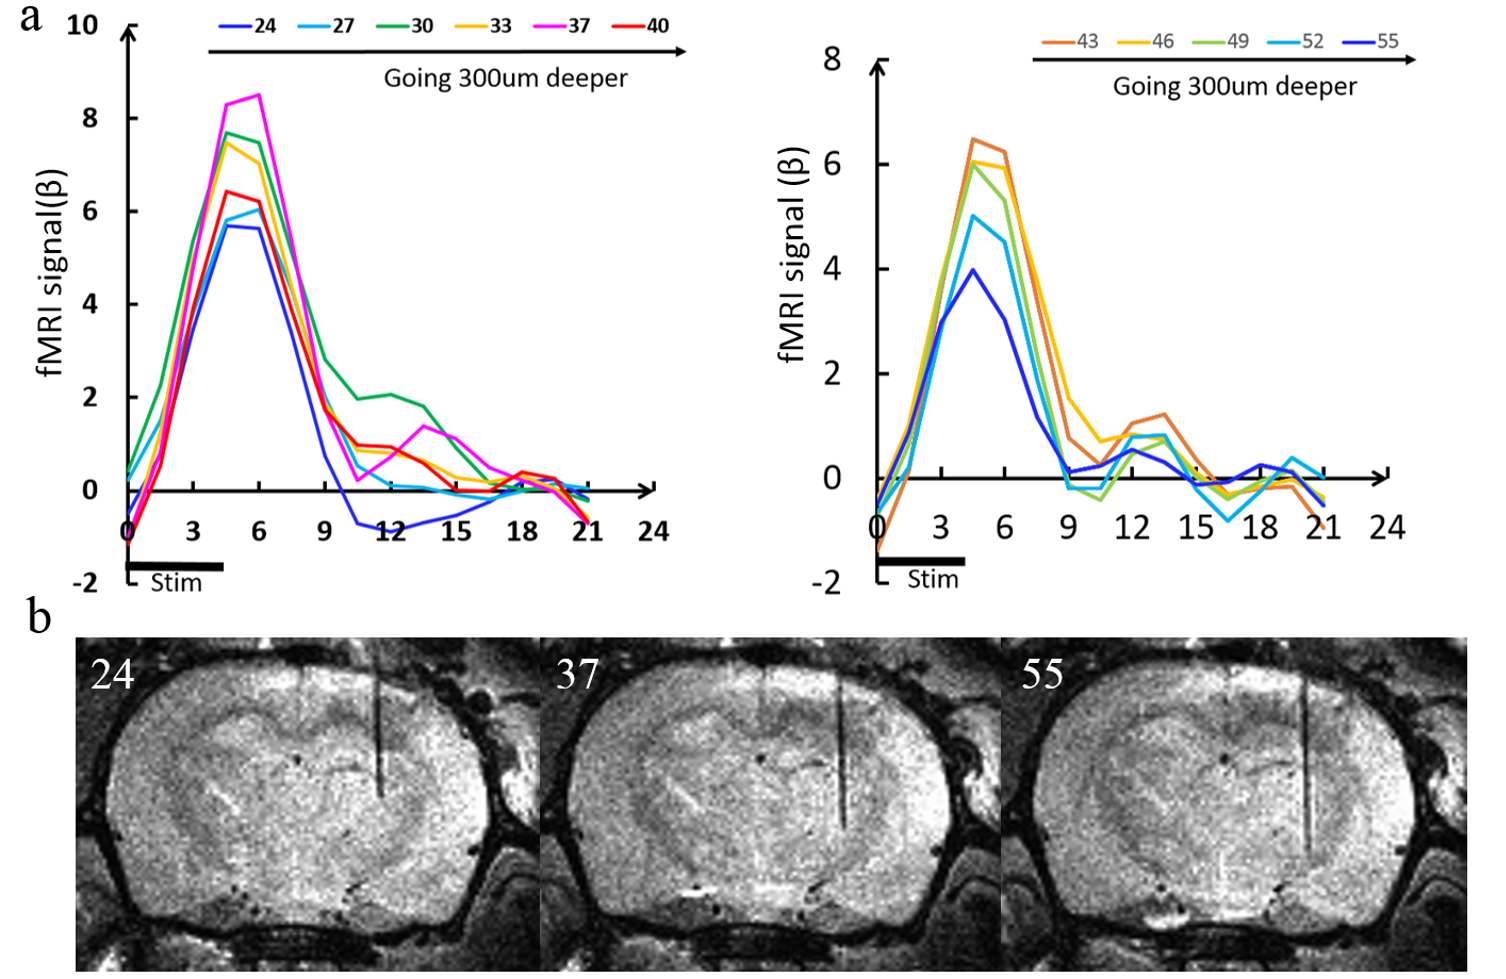
Fig 2 shows the broad cortical activation after the optogenetic stimulation of the thalamus. Although the fiber optic was located at the dorsal part of the thalamus, the BOLD signal spread through the major cortical regions in the ipsilateral hemisphere, as well as a small part of the contralateral hemisphere. In addition, the BOLD signal could be detected at the thalamic regions close to the fiber tip. Fig 3 shows the BOLD signal changes of the somatosensory cortex when the fiber optic was lowered at different depth of the thalamus. It clearly showed that the amplitude of the BOLD signal approached to peak when the fiber optic was at the depth (trial # 37) and gradually decreased when the fiber was inserted to deeper thalamic area ( trial # 55).Conclusion
The optogenetically stepwise activation of
different thalamic nuclei can be achieved by the MgRA positioning system. This
work shows that MgRA provides a precise and effective method to target multiple
deep brain nuclei and makes it possible to map the functional activation
patterns consecutively along the fiber insertion trajectory.Acknowledgements
We thank Mr. Shanyi Yu for building up the first prototype of the robotic arm and Mr. Johannes Boldt for helping to improve the MgRA system. The financial support of the Max-Planck-Society and the China Scholarship Council (PhD fellowship to Yi Chen) are gratefully acknowledged.References
1. Haider, B. & McCormick, D.A. Rapid Neocortical Dynamics: Cellular and Network Mechanisms. Neuron. 2009;62(2):171–189.
2. Jones, E.G. The Thalamus, 2 Volume Set (Cambridge University Press, 2007).
3. Monica Giraldo-Chica, Neil D. Woodward. Review of thalamocortical resting-state fMRI studies in schizophrenia. Schizophrenia Research. (2016),http://dx.doi.org/10.1016/j.schres.2016.08.005
4. Lee JH, Durand R, et al. Global and local fMRI signals driven by neurons defined optogenetically by type and wiring. Nature; 2010:465(7299):788-792.
5. Yu X, He Y, Wang M, Merkle H, Dodd SJ, Silva AC and Koretsky AP. Sensory and optogenetically driven single-vessel fMRI. Nature Methods;13:337-340.
Figures