2601
Quantification of Acoustic Radiation Force Induced Flow Velocity Changes by Phase-Contrast MRIChe-Wei Wu1, Chen-Hua Wu1, Po-Hung Hsu2, Hao-Li Liu2, Chih-Kuang Yeh1, and Hsu-Hsia Peng1
1Biomedical Engineering and Environment Science, National Tsing Hua University, Hsinchu, Taiwan, 2Electrical Engineering, Chang-Gung University, Taoyuan, Taiwan
Synopsis
We adopted phase-contrast MRI to real-time acquire flow velocity information with transmitting focused ultrasound pulses on microbubbles in a flowing phantom. We aim to evaluate the velocity changes resulted from the formation of bubbles by secondary acoustic radiation force. We observed that temporal standard deviation of velocity and %velocity change increased with increasing MBs concentrations. It can be attributed to the formation of aggregated bubbles, which can narrow the chamber diameter and accordingly lead to higher flow velocity. In conclusion, we verified the feasibility of using phase-contrast MRI to evaluate the impact of secondary acoustic radiation force.
Introdution
The acoustic radiation force (ARF) induced by focused ultrasound (FUS) with microbubbles (MBs) was well-known as a scheme of localizing drug delivery. The primary radiation force and secondary radiation force can propel MBs to the wall of chamber or vessels and aggregate MBs to form a large-size bubble, respectively.1,2 At the presence of secondary ARF, the larger-size bubbles on one side of the chamber or vessel wall can be seen as a barrier of flow, which may change the local flow velocity. A previous study reported the influence of MBs concentrations, acoustic pressure and flow velocity on the aggregated bubble size.3 In this study, we adopted phase-contrast MRI (PC-MRI) to real-time acquire flow velocity information with transmitting FUS pulses on MBs in a flowing phantom. We aim to locate the positions of aggregated bubbles and evaluate the velocity changes resulted from the formation of bubbles.Method
MBs were diluted to the concentration of 0.1%, 0.2%, 0.5%, and 1%. As shown in Figure 1, the solutions of MBs (lipid shell with C3F8, mean diameter=1.25 µm (Number %)) were injected with a velocity of 1 cm/s into a gel phantom with 6-mm hollow chamber. Continuous FUS pulses were transmitted by a single-element probe (central frequency 1 MHz, 2.5 cm diameter, 2.0 cm curvature, RK300, FUS Instruments, Toronto, Canada) to MBs solutions with acoustic pressure of 100 kPa. All images were acquired with PC-MRI (TR/TE= 26.9/8.4 ms, voxel size= 0.31 x 0.31 x 1 mm3, pixel bandwidth= 260 Hz/pixel, flip angle= 10, Venc = 6 cm/s, temporal resolution = 2.2 s) in a 7 Tesla scanner (ClinScan, Bruker, Germany). The imaging slices were selected in a transverse view of the chamber. We acquired 30 measurements (Pre-FUS=1-9, FUS=10-20, Post-FUS=21-30). A self-developed analyzing program was written in Matlab. The regions-of-interest were determined in magnitude images and transferring to phase images for analyzing the flow velocity information, as shown in Figure 2a. We calculated the pixel-wise temporal standard deviation (STD) of velocity and %velocity change to evaluate the influence of the formation of bubbles.4 The pixels with top 90% of STD were defined as the region with velocity change due to the aggregated bubbles (Figure 2b). (%velocity change = (all image – average pre-FUS)/average pre-FUS * 100%)Results
The histograms shown in Figure 3 demonstrated that the maximum of STD increased with the increase of MBs concentrations. Figure 4a displayed high correlation between MBs concentrations and temporal STD (R2 = 0.97, p = 0.01), indicating that FUS can induce more fluctuating flow velocity in MBs with higher concentrations. In respect of %velocity change, it also presented high positive correlation (R2 = 0.95, p = 0.046) with MBs concentrations (Figure 4b). The mean %velocity change within the ROI at different statuses was displayed in Figure 4c.Discussion and Conclusion
In this study, we used PC-MRI to real-time evaluate the temporal STD of velocity and %velocity change in a chamber with flowing MBs. Masuda et al reported that the size of MBs aggregations by ARF was related to acoustic pressure, MBs concentration, and pulse duration time. In our work, we also observed that the temporal STD of velocity as well as the %velocity change increased with increasing MBs concentrations. This finding can be attributed to the increased aggregated bubbles size and thus more substantial disturbance of local flow. The %velocity change increased from pre-FUS to FUS_early was resulted from the formation of aggregated bubbles, which can narrow the chamber diameter and accordingly lead to higher flow velocity. In conclusion, we verified the feasibility of using PC-MRI to evaluate the temporal STD of velocity and %velocity change in a chamber with flowing MBs. By quantifying the velocity, it is potentially helpful to identify the size of aggregated bubbles and thereby to evaluate the impact of secondary ARF. In the future, a systematic investigation of various MBs and FUS conditions shall be conducted to comprehend the association between the measured flow velocity changes and the aggregated bubble size.Acknowledgements
This study was supported by Center for Advanced Molecular Imaging and Translation, Chang Gung Memorial Hospital for facilities.References
1. Dayton et al, A Priliminary Evaluation of the Effects of the Primary and Sondary Radiation Forces on Acoustic Contrast Agents, IEEE TRANSACTIONS ON ULTRASONICS, fERROELECTRICS, AND FREQUENCY CONTROLL, 1997, 1264-12772. Dayton et al, Acoustic radiation force in vivo: A mechanism to assist targeting of microbubbles, Ultrasound in Medicine and Biology,1999, 1195-1201
3. Masuda et al, Observation Of Flow Variation In Capillaries Of Artificial Blood Vessel By Producing Microbubble Aggregations, Proceedings of the Annual International Conference of the IEEE Engineering in Medicine and Biology Society, EMBS,2012, 2064-2067
4. Lankhaar et al, Correction of phase offset errors in main pulmonary artery flow quantification,Journal of Magnetic Resonance Imaging, 2005,73-79
Figures
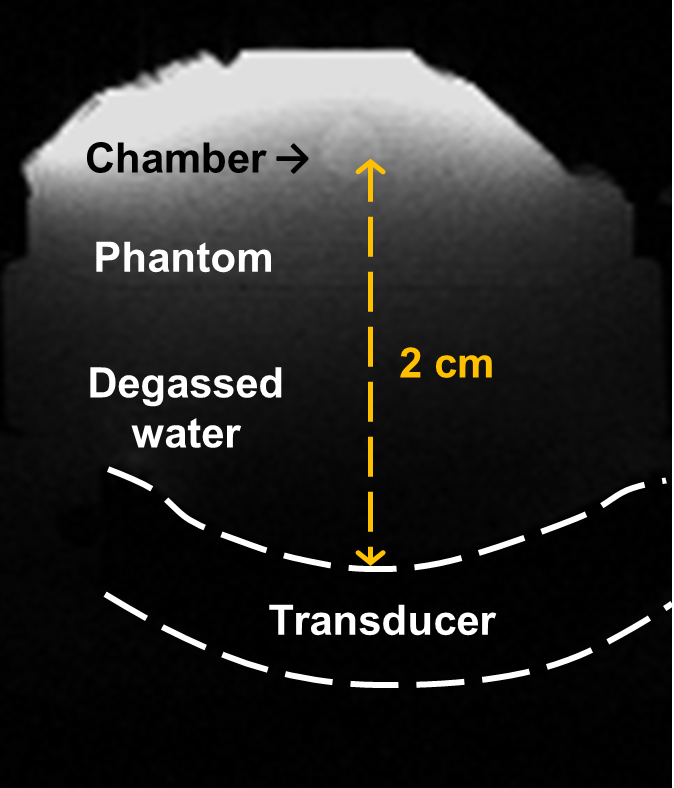
Figure 1. The experimental setup of FUS
transducer and phantom with flowing MBs solutions in the hollow chamber. The
flowing direction was into the slice.
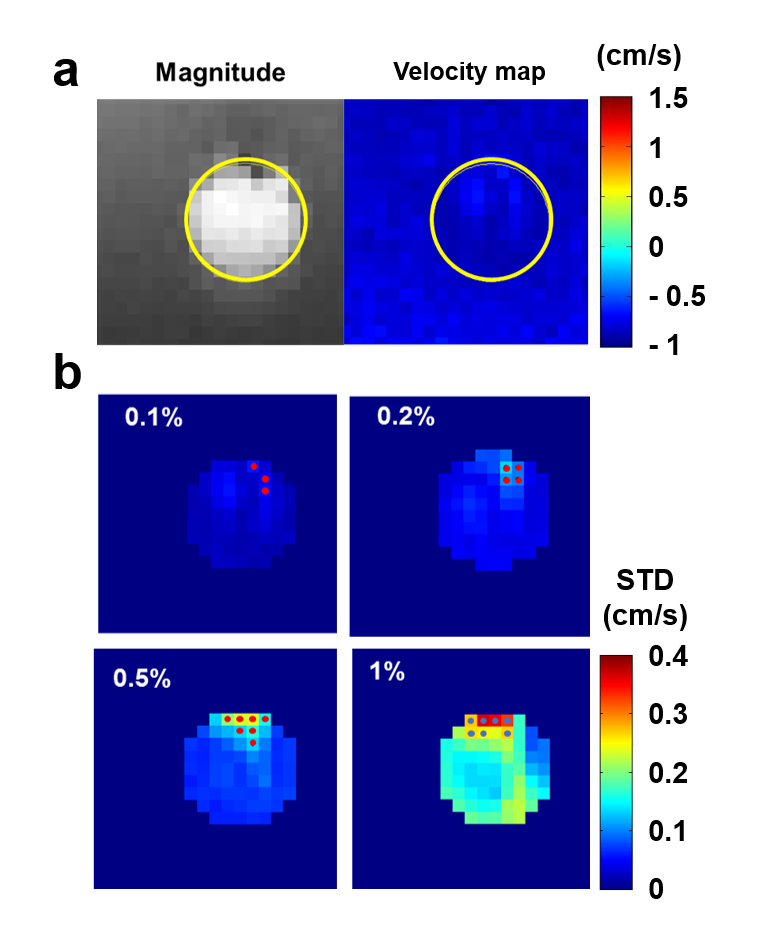
Figure 2. (a) The ROI in
magnitude and phase images. (b) The pixels with top 90% STD were defined as
regions with influence of the formation of aggregated bubbles in different MBs
concentrations.
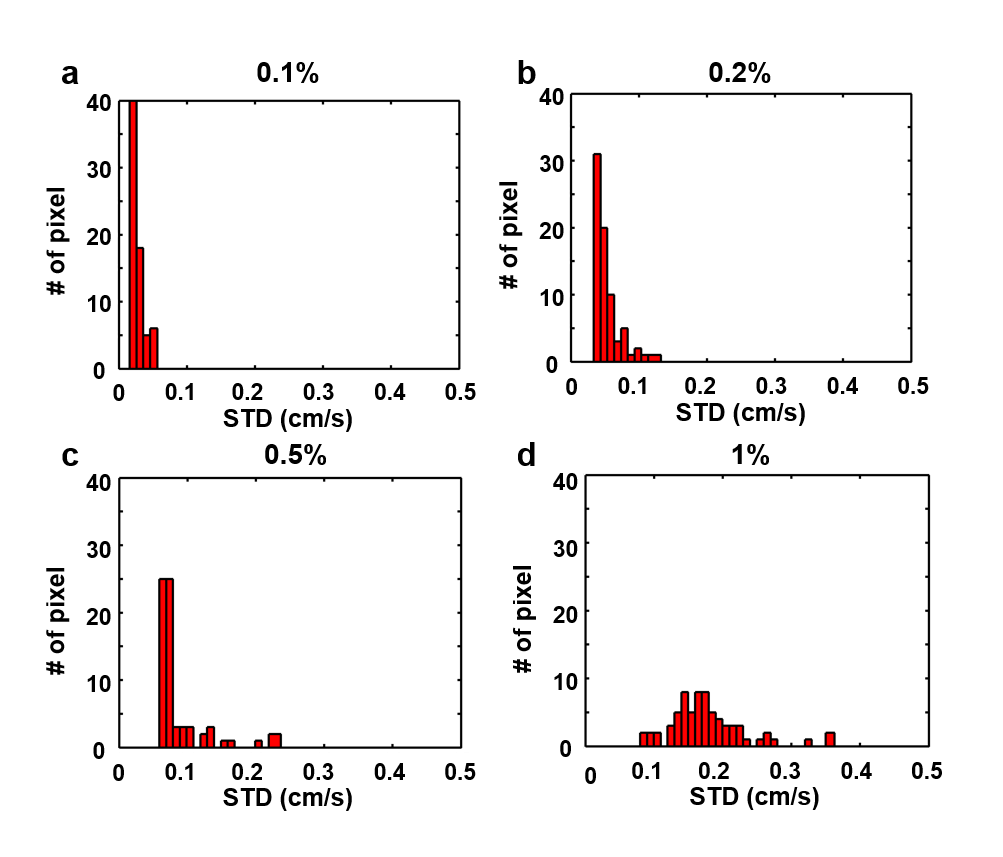
Figure 3. The histograms of temporal STD with MBs
concentration of (a) 0.1%, (b) 0.2%, (c) 0.5%, and (d) 1%).

Figure 4. The correlations
of MBs concentration with (a) temporal STD of velocity and (b) %velocity
change. (c) The %velocity change increased from pre-FUS to FUS_early was
resulted from the formation of aggregated bubbles which can narrow the chamber
diameter and accordingly lead to higher flow velocity.