2599
Estimation of Focused-Ultrasound Induced CNS Molecular Delivery via Dynamic Contrast-Enhanced Magnetic-Resonance Imaging1Department of Diagnostic Radiology and Intervention, Chang-Gung Memorial Hospital, Taoyuan, Taiwan, 2Department of Electrical Engineering, Chang-Gung University, Taoyuan, Taiwan, 3Department of Research and Development, NaviFUS corp., Taipei, Taiwan, 4Medical Imaging Research Center, Institute for Radiological Research, Chang-Gung University/Chang-Gung Memorial Hospital, Taoyuan, Taiwan, 5Medical Science and Technology, National Sun Yat-Sen University, Kaohsiung, Taiwan, 6Institute of Neuroscience and Technology, Zhejiang University, Zhejiang, People's Republic of China
Synopsis
Focused ultrasound (FUS) exposure with presence of microbubbles can transiently open the blood-brain-barrier (BBB) at targeted brain tissues. The purpose of this study is to investigate the feasibility to employ DCE-MRI to predict and estimate molecular CNS penetration under various exposure conditions and molecular sizes. Our result showed high accuracy and successful (prediction discrepancy was limited to be less than 10%) to estimate molecular penetration of FUS-induced BBB opening via imaging index (Ktrans) from DCE-MRI. This approach may bring technology advances and facilities the clinical application of FUS-induced BBB opening to deliver therapeutic molecules for CNS disease treatment.
Purpose
Focused ultrasound (FUS) exposure with presence of microbubbles can transiently open the blood-brain-barrier (BBB) at targeted brain tissues1-2. One requirement is whether the in-vivo estimation the molecular distribution and concentration been delivered at the target possible, and to fulfill the need in image-guided drug delivery (IGDD). Dynamic Contrast-Enhanced Magnetic-Resonance Imaging (DCE-MRI) has been validate its usage in monitoring the pharmacokinetics and pharmacodynamics of FUS-BBB opening3-4. Our purpose is to further investigate the feasibility to employ DCE-MRI to predict and estimate molecular CNS penetrate level under various exposure conditions and molecular sizes.Method
48 Sprague-Dawley rats and 4 molecular substances (Gd-DTPA, 1 kDa; dextran, 40 kDa; Evans Blue (EB), 70 kDa; bevacizumab, 149 kDa) were used in this study. Two FUS transducers were attempted to transcranially deliver FUS energy into animal hemisphere (0.4MHz, diameter/curvature radius = 60/80mm; 1MHz, diameter/curvature radius = 25/20 mm) under the presence of microbubbles (Sonovue, Bracco; 0.1 mL/kg). Burst-mode FUS exposure (burst length = 10 ms, PRF = 1 Hz, duration = 90s) was delivered to induce 3 mechanical indexes (MI= 1.25, 0.56, 0.5 before transcranial loss) with various exposure/molecular combinations in 4 four groups (1st: 0.4 MHz/GD-DTPA, EB; 2nd: 0.4 MHz/dextran; 3rd: 0.4 MHz/bevacizumab; 4th: 1 MHz/GD-DTPA, EB). After exposure, rats were immediately moved to MR bore and conducted MRI scan (7T, ClinScan, Bruker) for 10 mins. DCE T1-weighted imaging (3D FLASH T1 sequence, TE/TR = 0.76 ms/2.31 ms; ST = 0.8 mm; FA = 5°/10°/15°/20°/25°/30°; matrix: 192 x 132) was performed to evaluate the permeability of the opened BBB. Permeability was obtained based on data post analysis using the Extended-Kety model5-7 to generate Ktrans maps. All animals were sacrificed 2 hours after ultrasound exposure. Gd-DTPA concentration was quantitated via spin-spin relaxivity(R1) based calibration3. EB concentration was determined spectrophotometrically (wavelength = 620 nm) and dextran/bevacizumab concentration were analyzed through high-performance liquid chromatography (HPLC)8. Two stages were designed: first is to quantitate the molecular delivery (Gd-DTPA, EB, dextran) and establish its relation with DCE-MRI; second is to re-perform molecular delivery (Gd, EB, bevacizumab) and evaluate the discrepancy between the estimated molecular concentration likelyhood (estimated from the first stage) and the measured molecular concentration.Result
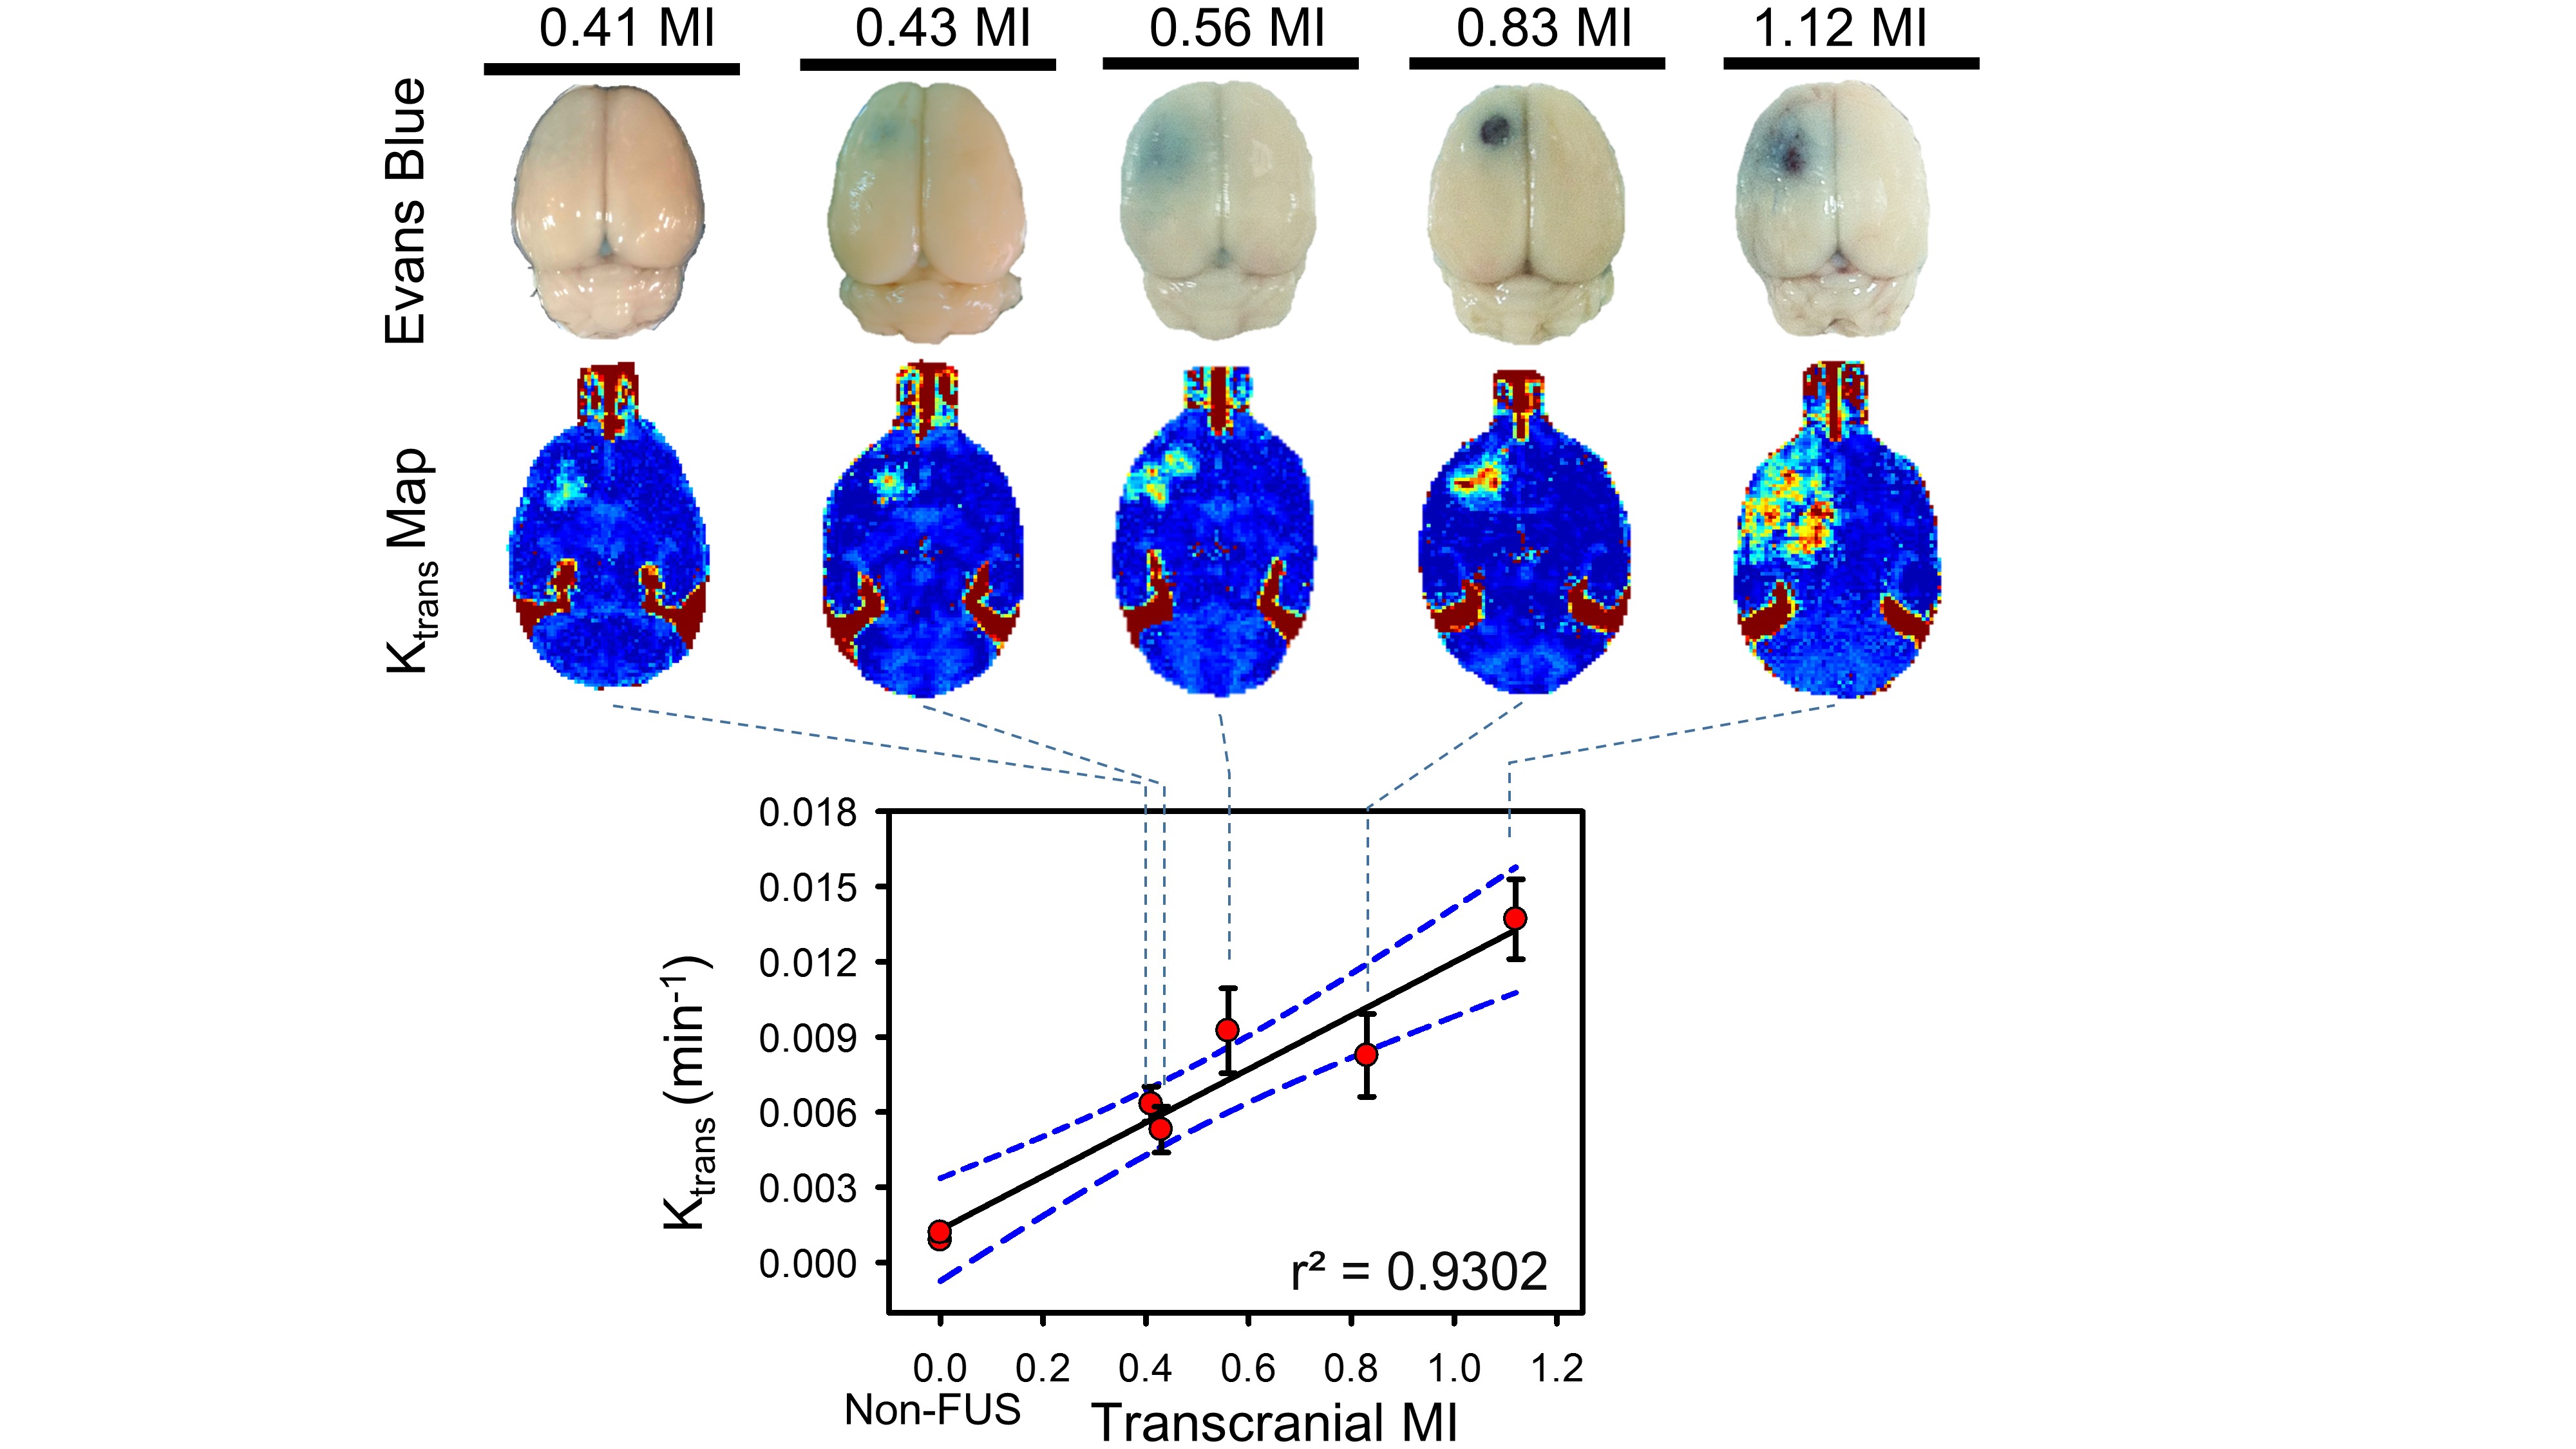
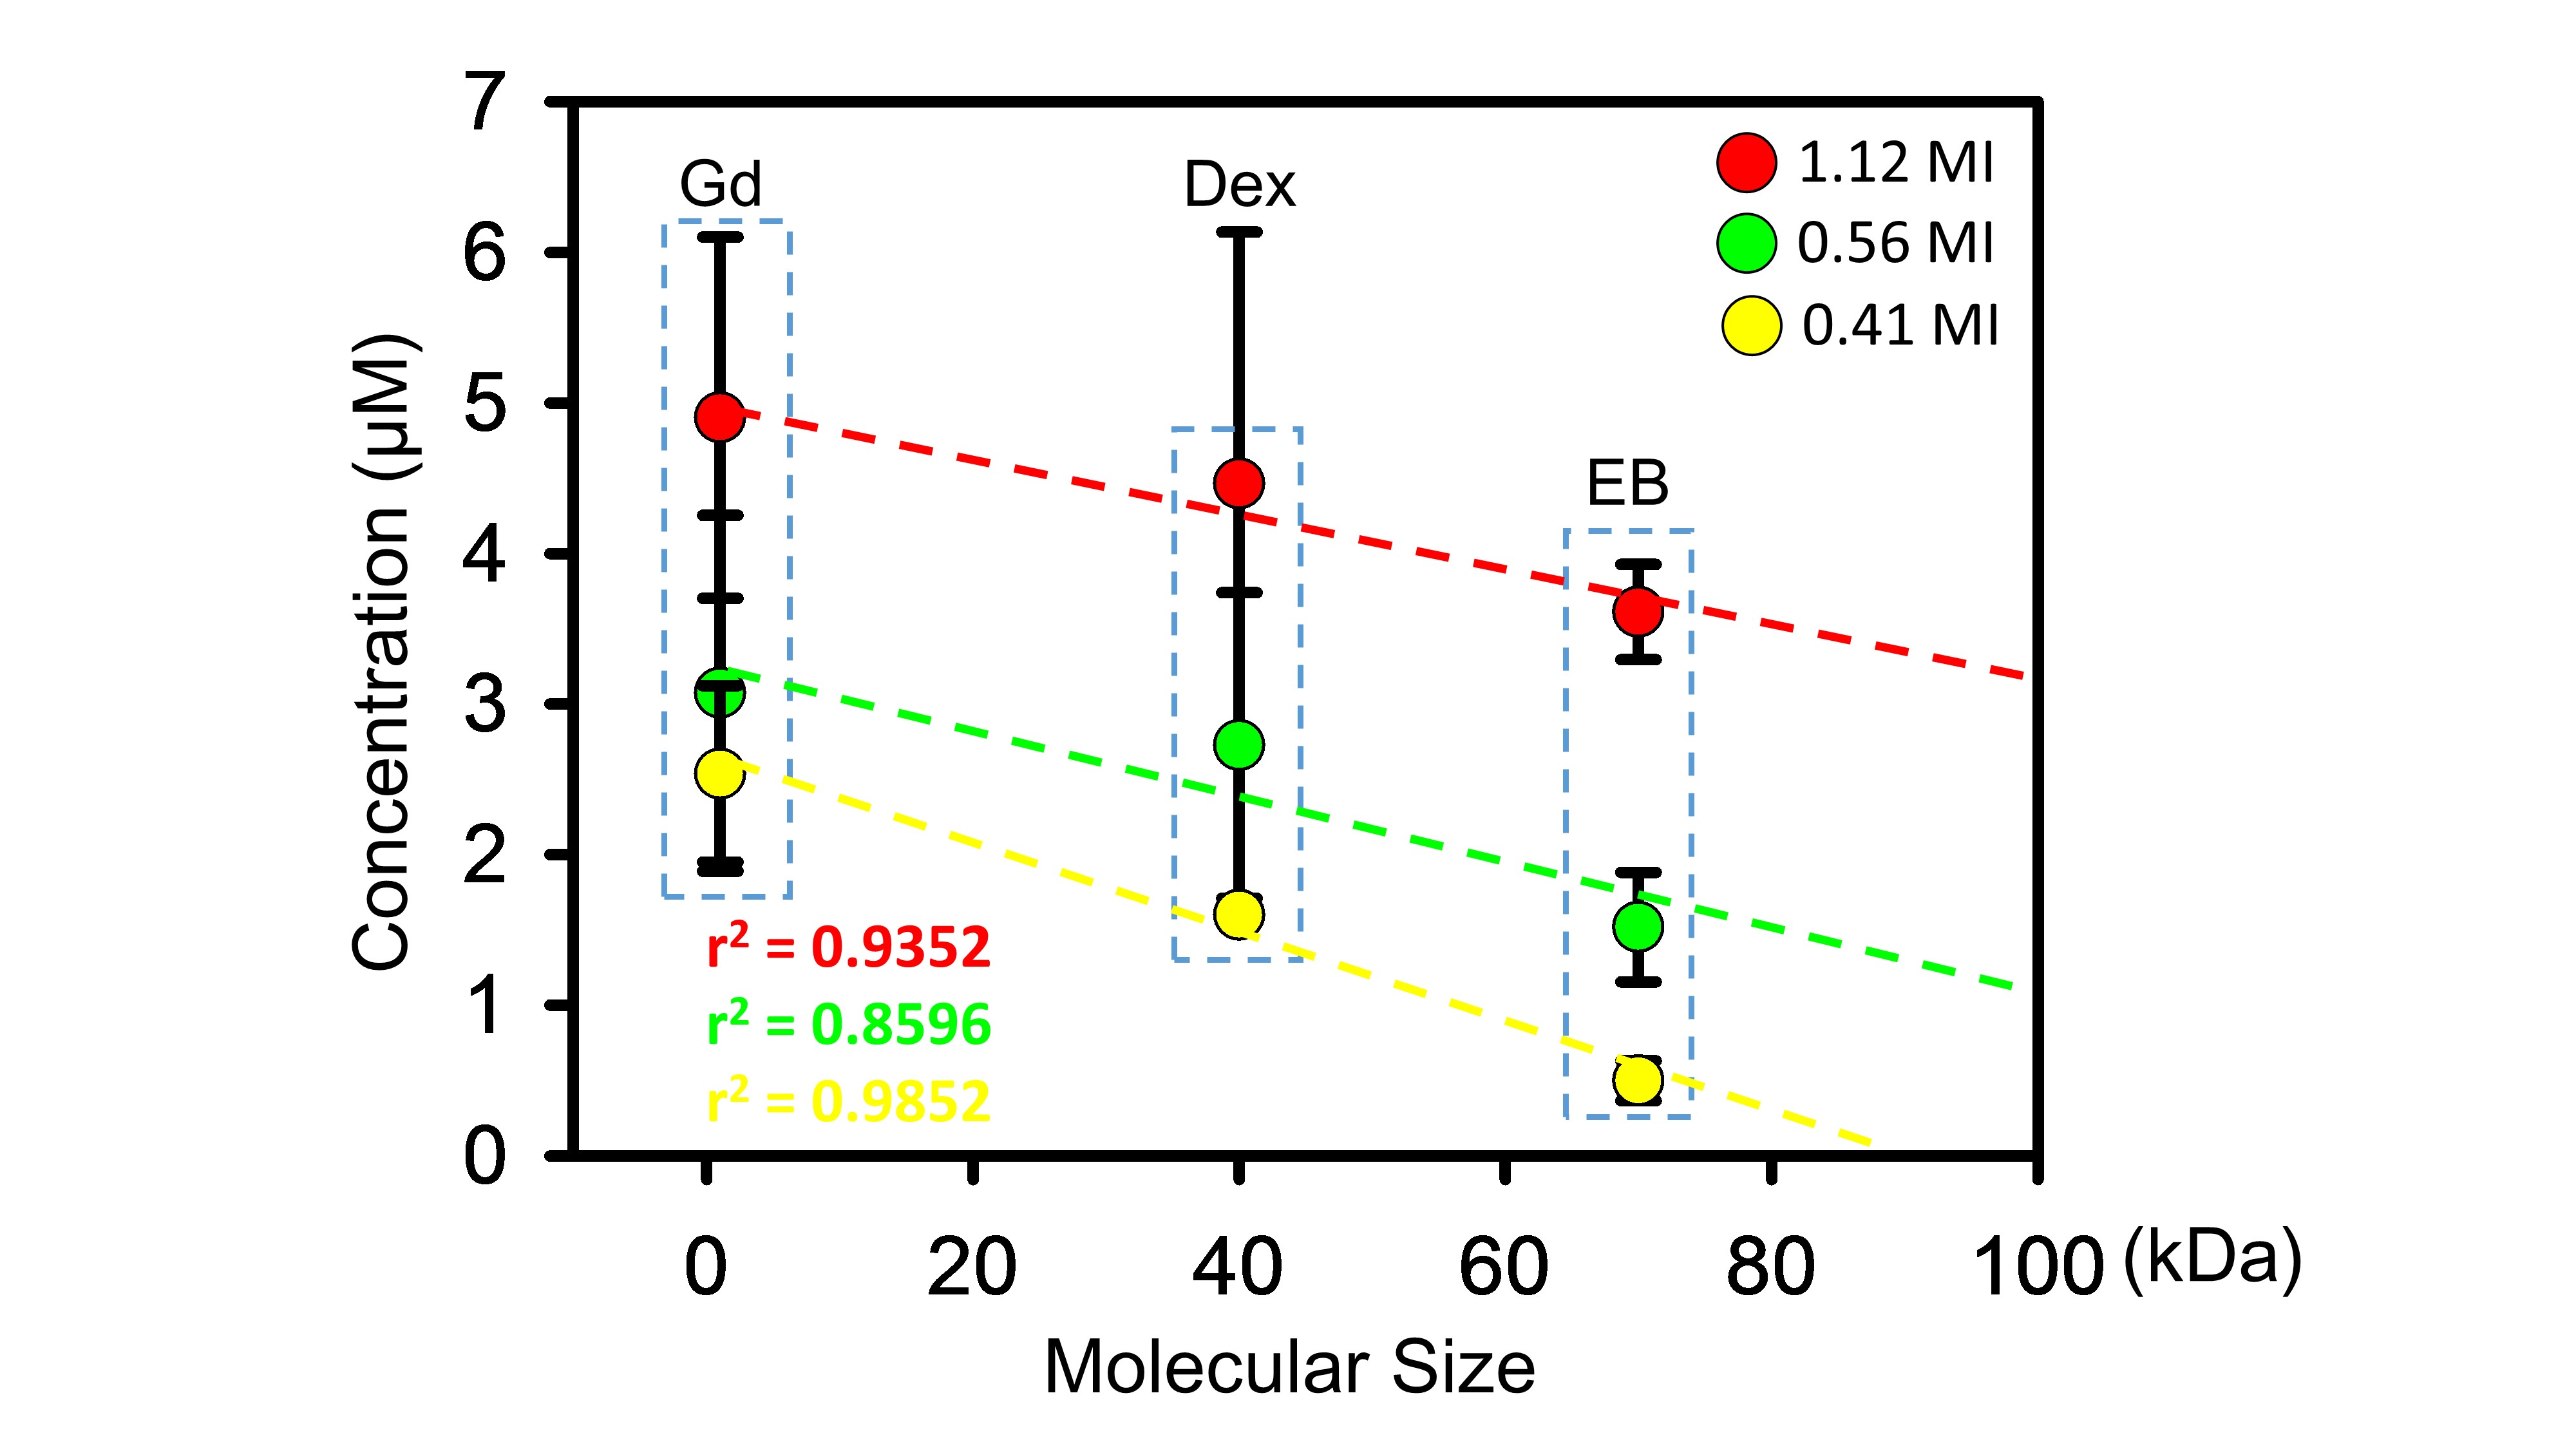
Figure1 showed a typical comparison of the EB-stained brains and Ktrans map via DCE-MRI under various exposure conditions. The EB-stained brains confirmed the opening of the targeted BBB, and the BBB-opened scale highly depends to the delivered FUS exposure level (r2=0.9302). Exposure level change ranging MI = 0-1.12 induced Ktrans change ranging 0.0061-0.0136 min−1. The relationship of 3 molecular concentration and sizes (GD-DTPA, Dextran, EB from group1-2) with 3 exposure levels were showed in figure2. The concentration of penetrated molecular concentration was increased when high FUS exposure was delivered (GD-DTPA, 2.45-4.9 µM; Dextran, 1.6-4.46 µM; EB, 0.49-3.61 µM). A linear relationship between delivered concentration and FUS exposure level can be observed, with high correlation can be obtained (1.12 MI/ r2=0.9352; 0.56 MI/r2=0.8596; 0.41MI/r2=0.9852). A simple linear relationship by transferring FUS exposure level to molecular delivered concentration was then estimated to be:
C = (0.0135 MI-0.0322) × MW+ (3.2901 E+1.3341)
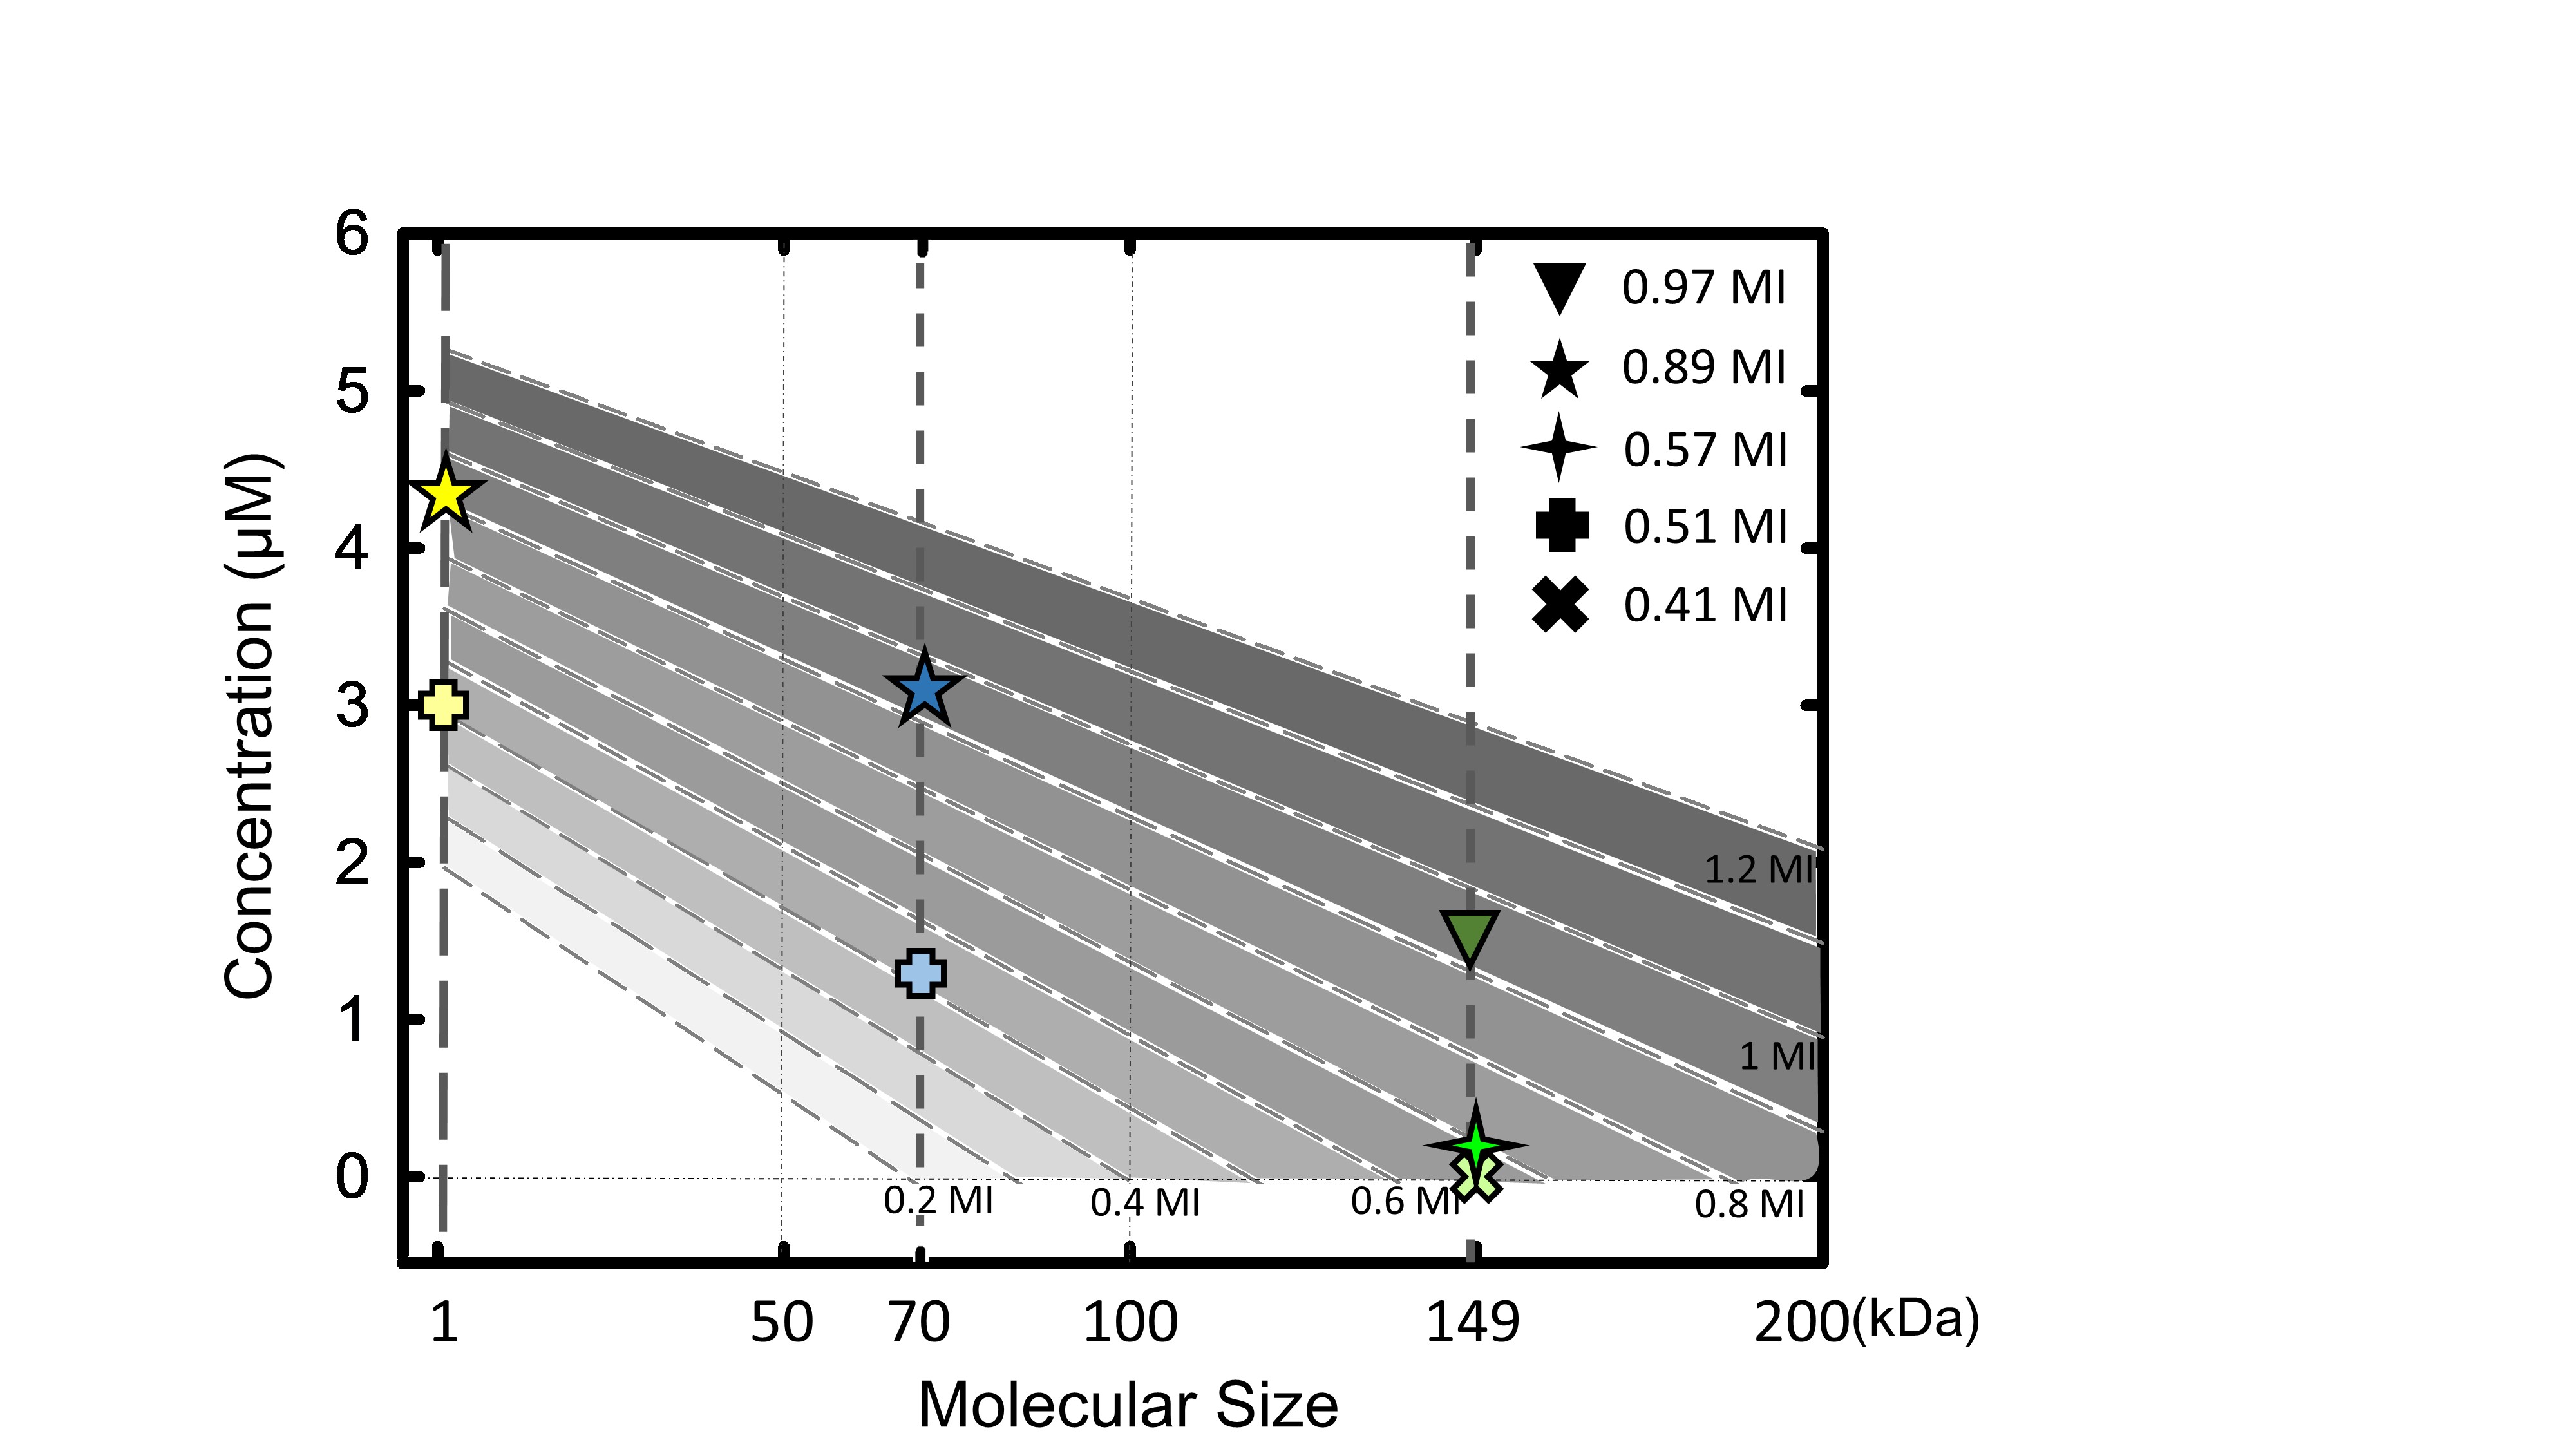
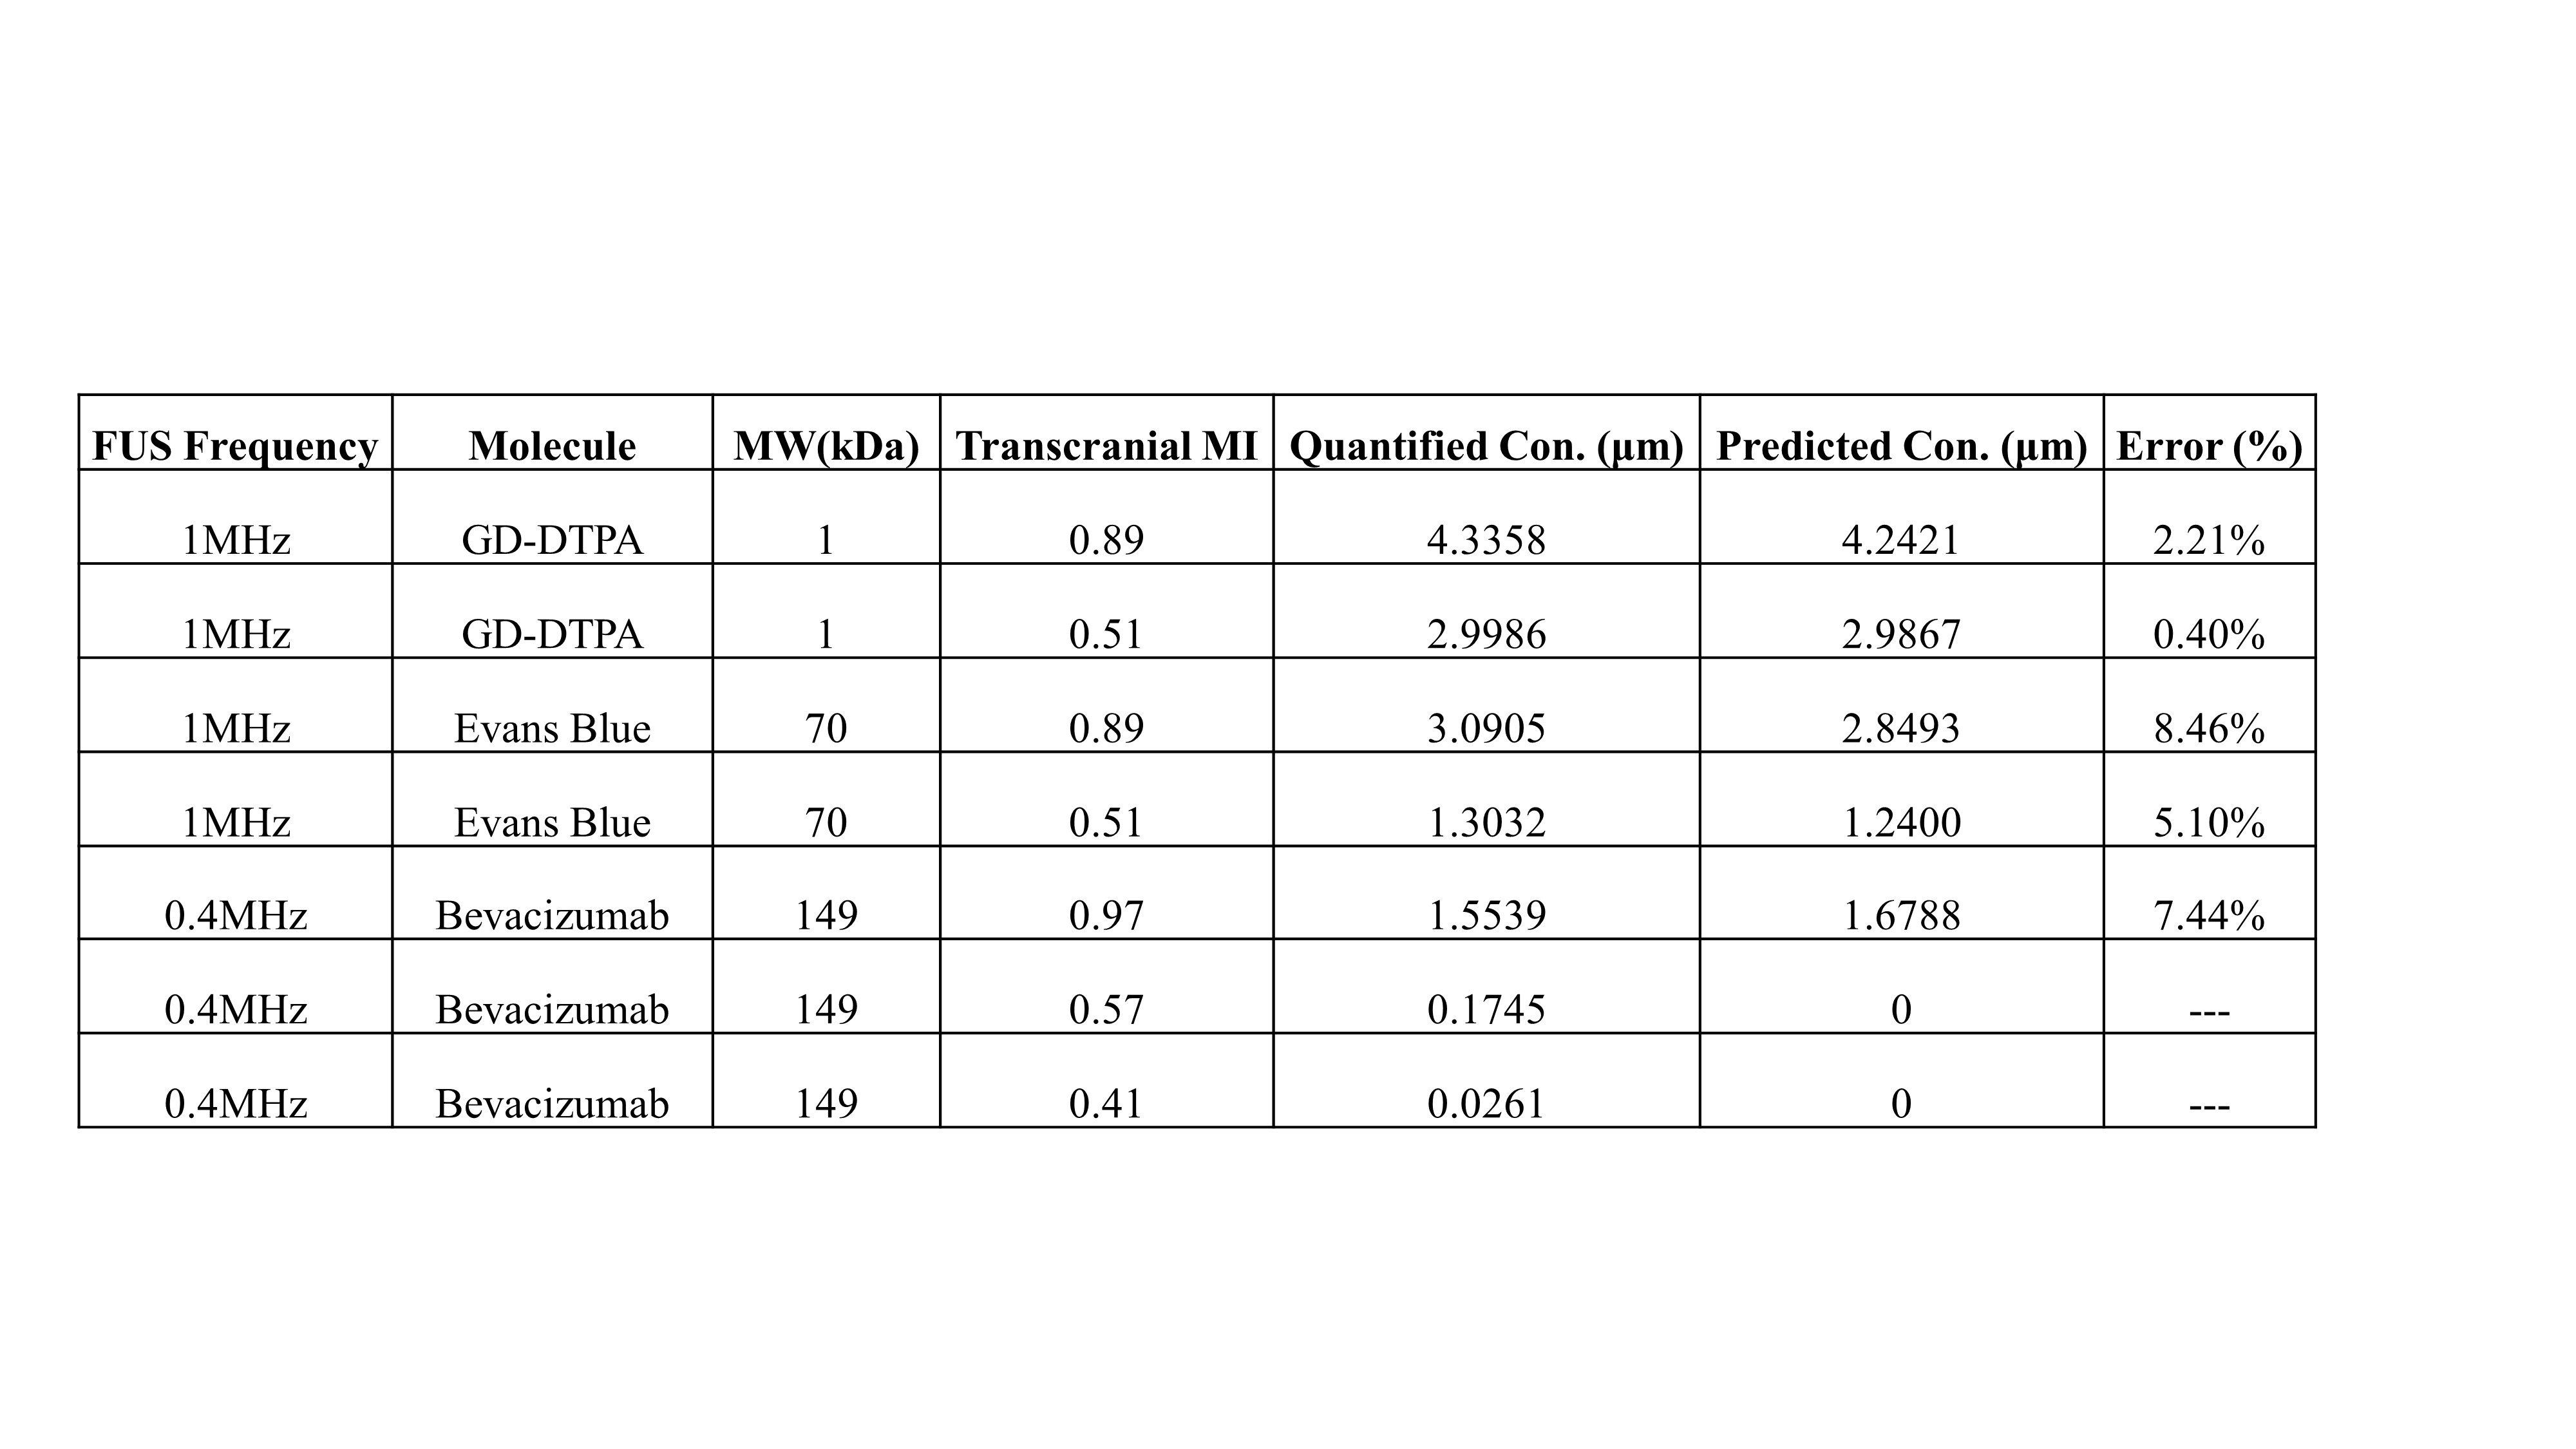
Where C = predicted molecule concentration (µM), MW = molecule size (kDa), E = exposure level (MI). The concentration (bevacizumab, GD-DTPA, EB) from group3-4 was used to verify the accuracy of predicted concentration in transcranial MI with size, and result was showed in figure3. The transcranial MI was estimated from Ktrans transferred equation in figure1 and all quantified molecular concentration were close to predicted results (figure4, the error range <10%).
Discussion
High correlation between MI (when considering transcranial loss) and Ktrans reported was observed, implying that Ktrans is capable of serving as an in-vivo imaging index to mirror FUS-BBB opened scale, and to avoid uncertainty and interference of transcranial loss. In addition, we have also characterized that the established linear transformation between MI and molecular penetration provide high accuracy and successful to predict wide size range of the delivered molecules.Conclusion
This study demonstrates the feasibility to estimate molecular penetration of FUS-induced BBB opening via imaging index from DCE-MRI. Ktrans can be employed to calibrate transcranial MI to eliminate uncertainty of transcranial loss. Moreover, penetrated molecular concentration can be accurately estimated by transferring the transcranial MI via a simple linear fashioned transformation. When linking these two together, molecular penetration induced by ultrasound sonication can be well estimated from MR image with various ultrasound exposure conditions and various molecular sizes in-vivo. This approach may bring technology advances and facilities the clinical application of FUS-induced BBB opening to deliver therapeutic molecules for CNS disease treatment.Acknowledgements
This work was supported by the Ministry of Science and Technology, TAIWAN, under grants nos 104-2221-E-182-034, 105-2221-E-182-022, and Chang Gung Memorial Hospital, TAIWAN, under grants nos CIRPD2E0051-53, CMRPD2D0111-13.References
1. Hynynen, K., McDannold, N., Vykhodtseva, N. & Jolesz, F. A. Noninvasive MR imaging-guided focal opening of the blood-brain barrier in rabbits. Radiology 220, 640–646 (2001).
2. Liu, H. L., Fan, C. H., Ting, C. Y. & Yeh, C. K. Combining microbubbles and ultrasound for drug delivery to brain tumors: current progress and overview. Theranostics 4, 432–444, doi: 10.7150/thno.8074 (2014).
3. Chu, P. C. et al. Pharmacodynamic analysis of magnetic resonance imaging-monitored focused ultrasound-induced blood-brain barrier opening for drug delivery to brain tumors. BioMed research international 2013, 627496, doi: 10.1155/2013/627496 (2013).
4. Chai, W. Y. et al. Magnetic-resonance imaging for kinetic analysis of permeability changes during focused ultrasound-induced blood-brain barrier opening and brain drug delivery. Journal of controlled release: official journal of the Controlled Release Society, doi: 10.1016/j.jconrel.2014.06.023 (2014).
5. Tofts, P. S. et al. Estimating kinetic parameters from dynamic contrast-enhanced T(1)-weighted MRI of a diffusable tracer: standardized quantities and symbols. Journal of magnetic resonance imaging: JMRI 10, 223–232 (1999).
6. Kety, S. S. The theory and applications of the exchange of inert gas at the lungs and tissues. Pharmacological reviews 3, 1–41 (1951)
7. Tofts, P. S. Modeling tracer kinetics in dynamic Gd-DTPA MR imaging. Journal of magnetic resonance imaging: JMRI 7, 91–101 (1997).
8. HL Liu et al. Focused Ultrasound Enhances CNS Delivery of Bevacizumab for Malignant Glioma Treatment. Radiology, 18:152444, (2016)
Figures