2598
The Role of Perfusion MRI in Predicting Magnetic Resonance-guided High Intensity Focused Ultrasound Treatment Outcome in Uterine Fibroids1MR Therapy, Philips Healthcare, Seoul, Korea, Republic of, 2Department of Radiology, Pham Ngoc Thach University of Medicine, HCMC, Vietnam, Ho Chi Mihn City, Vietnam
Synopsis
The aim of this present work is to classify uterine fibroids by comparing the MR T1 perfusion based time-signal intensity curves of fibroid tissue with myometrium prior to HIFU ablation. Our findings in this study suggest that the newly introduced classification method could be used as the primary MRI classification parameter prior to MR-HIFU ablation not only for classifying the uterine fibroids but also predicting the treatment outcome of HIFU ablation, with the immediate NPV ratio of at least 80%.
INTRODUCTION
Currently, the T2 signal intensity (SI) based classification1 of the fibroid by comparing to skeletal muscle and myometrium is used as the primary MRI classification parameter for determining patient suitability by dividing the patient population in three groups as type I (SI lower than the skeletal muscle), II (SI lower than the myometrium but higher than the skeletal muscle or III (SI higher than the myometrium) via visual inspection. However, in practice, T2 SI based classification alone does not always predict treatment results with high confidence2. Therefore, it may be too limited as a predictor of treatment outcome. Therefore, in this study, we investigated the role of Magnetic Resonance (MR) T1 perfusion based time-signal intensity (SI) curves of fibroid tissue compared to the myometrium predicting the treatment outcome of MR-guided high intensity focused ultrasound (MR-HIFU) ablation of uterine fibroids.
MATERIALS AND METHODS
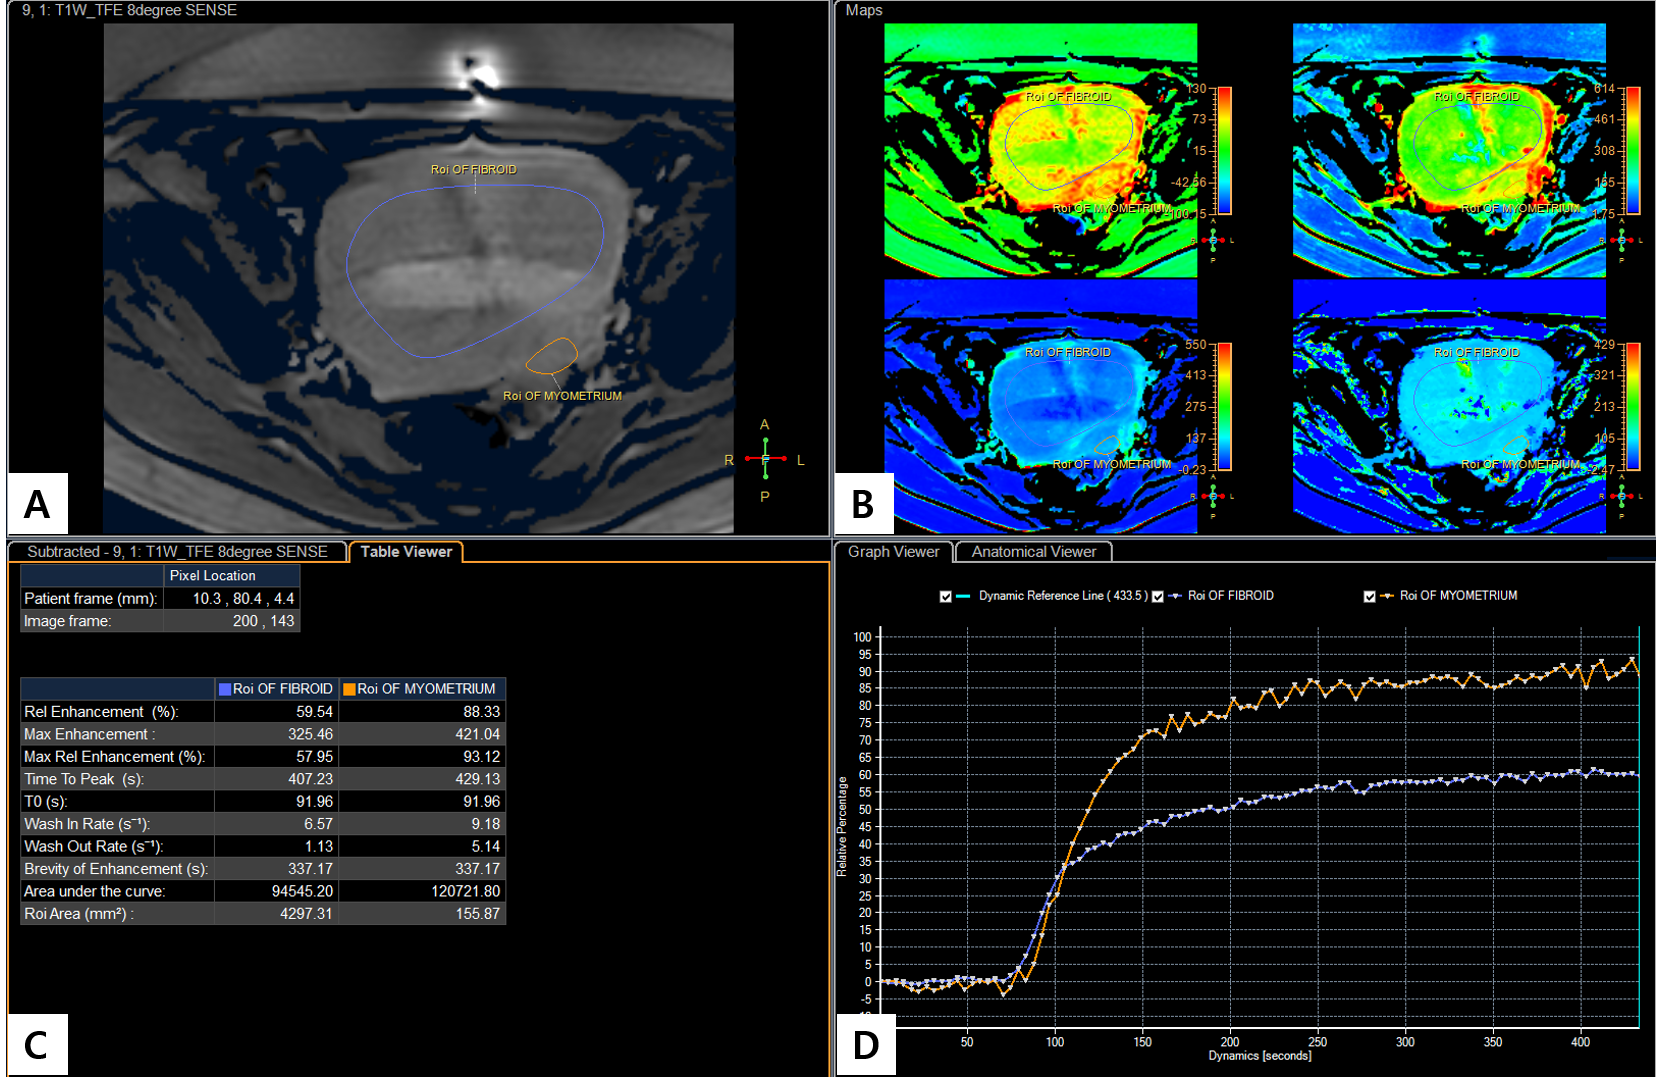
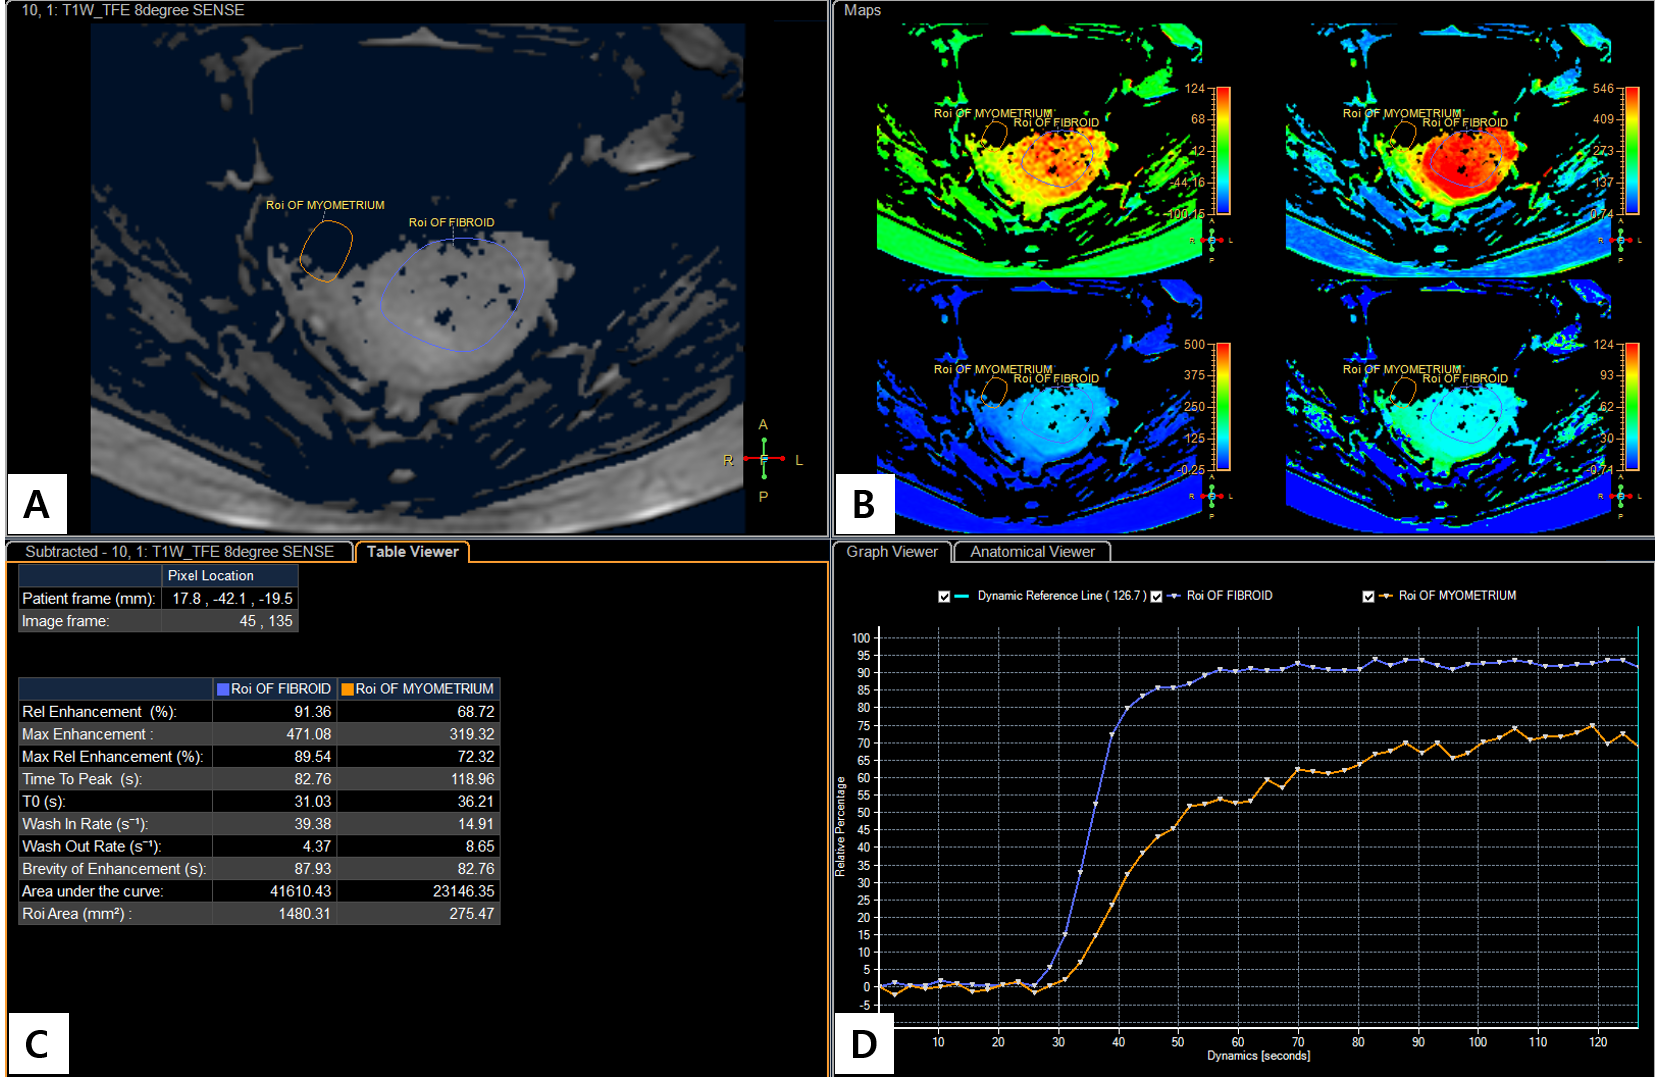
48 women (39.6 ± 5.3 years with a range of 27–50 years) who underwent MR-HIFU ablation were divided into 2 groups based on the enhancement on DCE-MRI at screening: group A if the time-intensity curves of fibroid is lower than that of myometrium (Fig. 1) and group B if the time-intensity curves of fibroid is equal or higher than that of myometrium (Fig. 2). Immediate post MR-HIFU non-perfused volume (NPV) ratio and fibroid volume reduction ratio at 6 months follow-up were assessed. The bivariate correlation analysis using the Pearson correlation coefficient was performed for the relationship among the T1-perfusion based classification and immediate NPV ratio. The Whisker boxplots were used to describe the relationship between groups A and B for immediate post HIFU NPV ratio and fibroid volume reduction at 6 months follow-up.
RESULTS
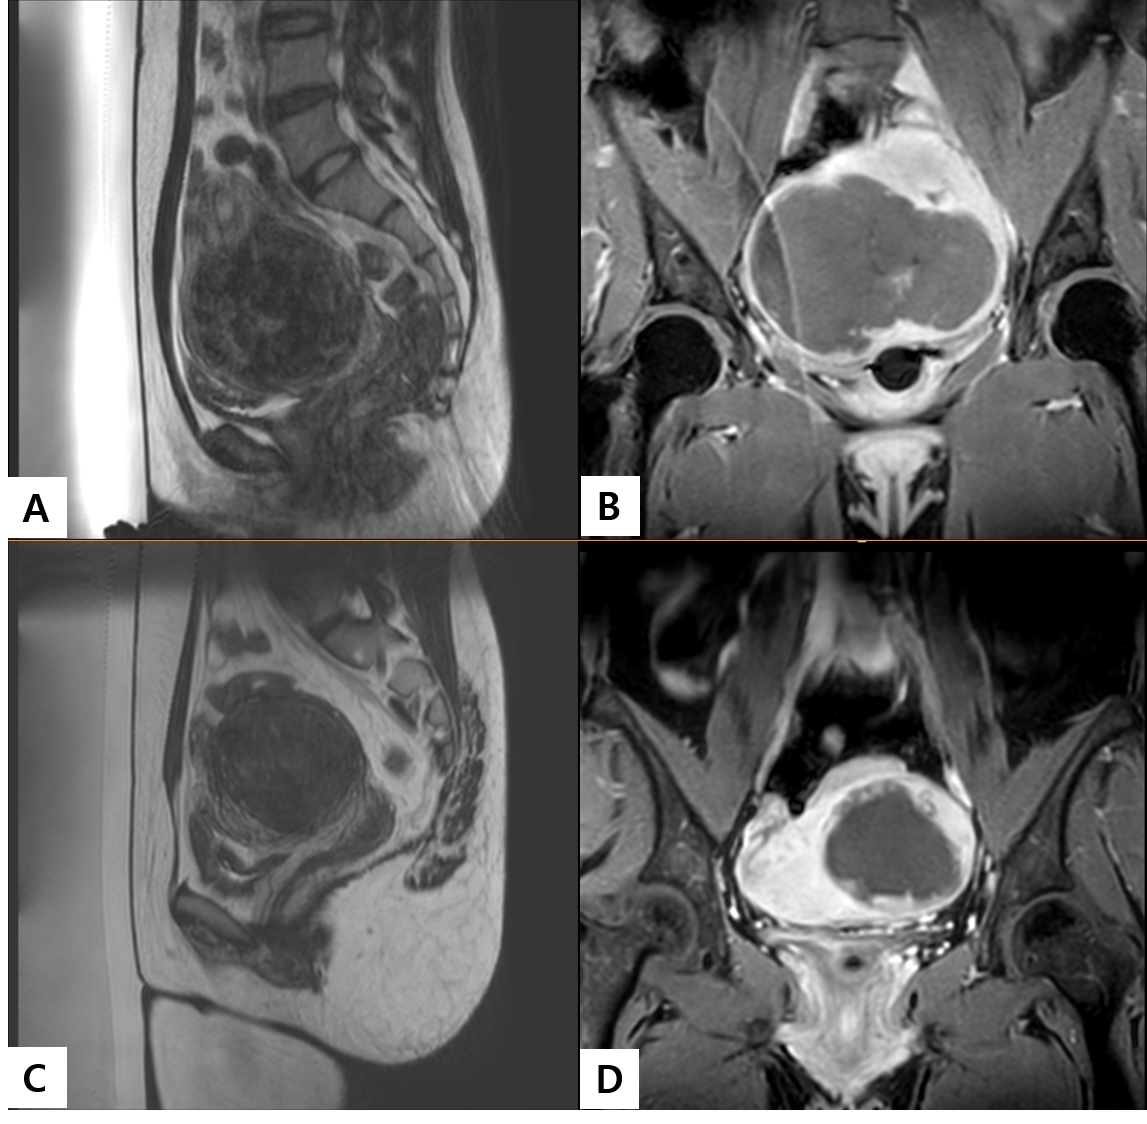
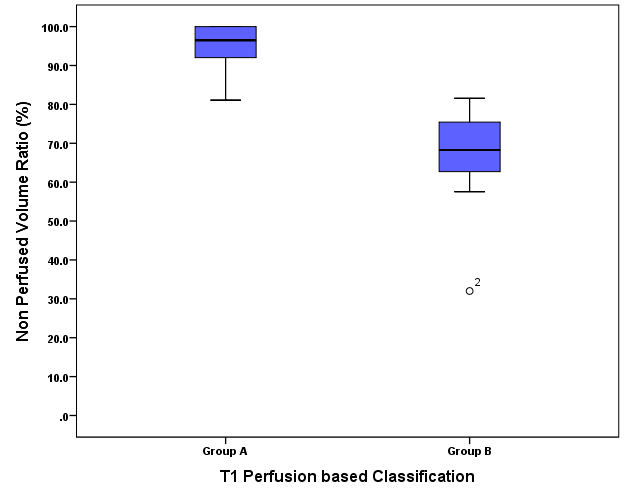
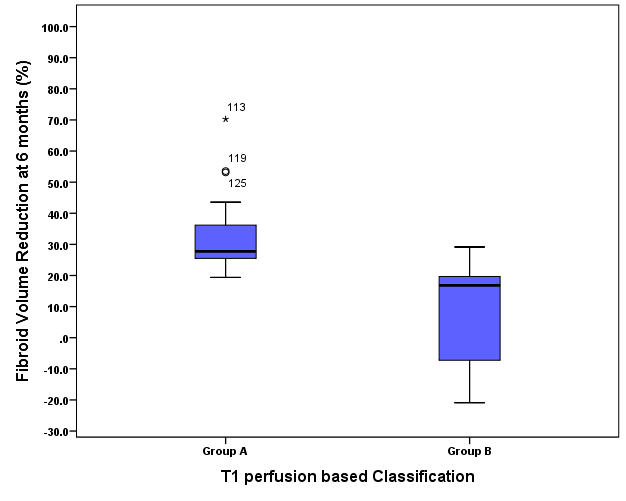
The mean diameter and volume of all fibroids were 71 mm ± 27.0 (21-151 mm) and 166.7 ml ± 159.0 (12-794 ml) for both groups (N=48), 72.5 mm ± 29.2 (29.0-151.0 mm) and 180.1 ml ± 176.3 (28.0-794.0 ml) for group A (N=32) and 67.6 mm ± 22.1 (39.0-118.0 mm) and 139.8 ml ± 117.3 (12-478 ml) for group B (N=16), respectively. On immediate post HIFU, NPV ratio was 86.1% ± 15.6 (32%-100%) for both groups (N=48), 95.5 % ± 5.3 (81.1-100 %) for group A (N=32) and 67.3 % ± 11.9 (32.0-81.6%) for group B (N=16). MR Temperature mapping and post HIFU contrast enhanced (CE)-T1W MR images for examples from groups A and B with an excellent and poor ablation results are shown in Figure 3A-E, respectively. Box-whisker plots in Figure 4 compare the immediate NPV ratio for groups A and B. Of the 48 patients, 6 months follow-up MR data were available for 32 patients (66.7%). The fibroid volume reduction ratio at 6 months was 26.5 % ± 17.1 (-20.9%-70.3%) for both groups (N=32), 32.5 % ± 12.1 (19.4%-70.3%) for group A (N= 24) and 8.3 % ± 17.7 (-20.9%-29.2%) for group B (N= 8). Box-whisker plots in Figure 5 fibroids volume reduction at 6 months for groups A and B.
DISCUSSION
The T1 perfusion based classification showed a very strong correlation with the immediate NPV ratio (r = -0.0860, p < 0.001; Pearson’s correlation test, Fig. 4). The 6 months volume reduction was significantly greater in group A (26.5%) than group B (8.3%, p<0.001). In conclusion, our findings in this study suggest that the newly introduced T1 perfusion based classification could be used as the primary MRI classification parameter prior to MR-HIFU ablation not only for classifying the uterine fibroids but also predicting the treatment outcome of HIFU ablation, with technical success defined as an immediate NPV ratio of at least 80%.
Acknowledgements
No acknowledgement found.References
1. Funaki K, Fukunishi H, Funaki T, et al. Magnetic resonance-guided focused ultrasound surgery for uterine fibroids: relationship between the therapeutic effects and SI of preexisting T2 weighted magnetic resonance images. Am J Obstet Gynecol. 2007;196:184.e181–184.e186.
2. Gizzo S, Saccardi C, Patrelli TS, et al. Magnetic resonance-guided focused ultrasound myomectomy: safety, efficacy, subsequent fertility and quality-of-life improvements, a systematic review. Reprod Sci 2014; 21:465-476.
Figures