2596
Automatic removal of water bath artifacts from MR temperature maps in focused ultrasound neurosurgery1Institute of Imaging Science, Vanderbilt University, Nashville, TN, United States, 2Biomedical Engineering, Vanderbilt University, Nashville, TN, United States, 3Center for MR-Research, University Children's Hospital, Zurich, Switzerland
Synopsis
During MR-guided focused ultrasound treatments in the brain, circulation of cool water around the head and ultrasound wave propagation create water motion during the signal readout, resulting in image artifacts. These artifacts vary across image dynamics, and are observable in magnitude and phase images and in temperature change maps measured during treatment. In this work, we apply a wavelet denoising algorithm to remove these artifacts from temperature maps during treatment. Results show that temperature errors can be corrected in patient data, in 0.2 s per map, suggesting that corrections could be performed during treatment.
Purpose
Images and temperature maps in the brain during MR-guided focused ultrasound neurosurgery are affected by intra-scan motion of the water bath that surrounds the patient’s head. The bath water moves because it is circulated around the head between sonications for cooling, and that flow continues for some time during subsequent scanning, and also because it is perturbed by propagating acoustic waves during sonication. The water’s motion results in artifacts with a ripple-like appearance that alias into the brain and have significant amplitudes in both magnitude images and temperature maps. To address this problem, we adapt an automated wavelet denoising algorithm to remove ripple-like artifacts from MR temperature maps in the brain, using a wavelet basis that is particularly effective in sparsely representing the ripple-like artifacts.Methods
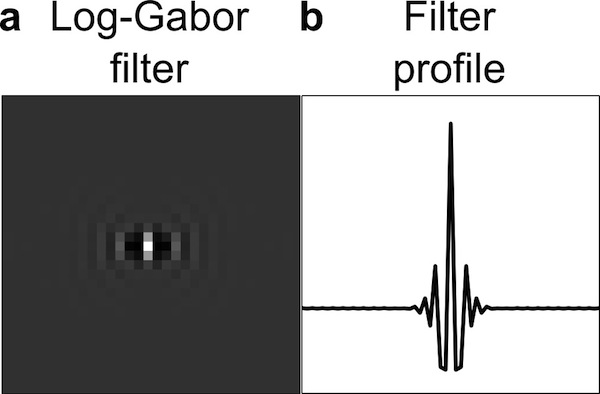
The artifact removal procedure is applied to phase difference maps, which contain signal from either heating or artifact sources, and not from underlying anatomy. To do this, we adapted a soft-thresholding algorithm using log-Gabor filters 1. These filters are part of the family of Gabor filters, often used to detect edges in images, and were chosen for this application to efficiently sparsify the ripple image artifacts 2,3. Figure 1 shows a log-Gabor filter and its profile.
Artifact removal. Log-Gabor filters were applied in 5 wavelet scales and 6 filter orientations. A set of voxels most likely to contain artifacts was defined as those voxels greater than or equal to 0.05 in the normalized magnitude image difference between baseline and treatment dynamics. A soft threshold was then computed for the temperature maps as
$$$T=\frac{μ+k\sqrt{\frac{(4-π)μ^2}{π}}}{m^{s-1}}$$$,
where μ is the mean of the filtered temperature map within the artifact voxel set at the smallest wavelet scale in each orientation, k is the number of standard deviations of noise to reject (set to 2), m is the multiplication factor between scales (set to 5.25), and s is the wavelet scale, as described in Ref [1]. No manual tuning is required in the algorithm.
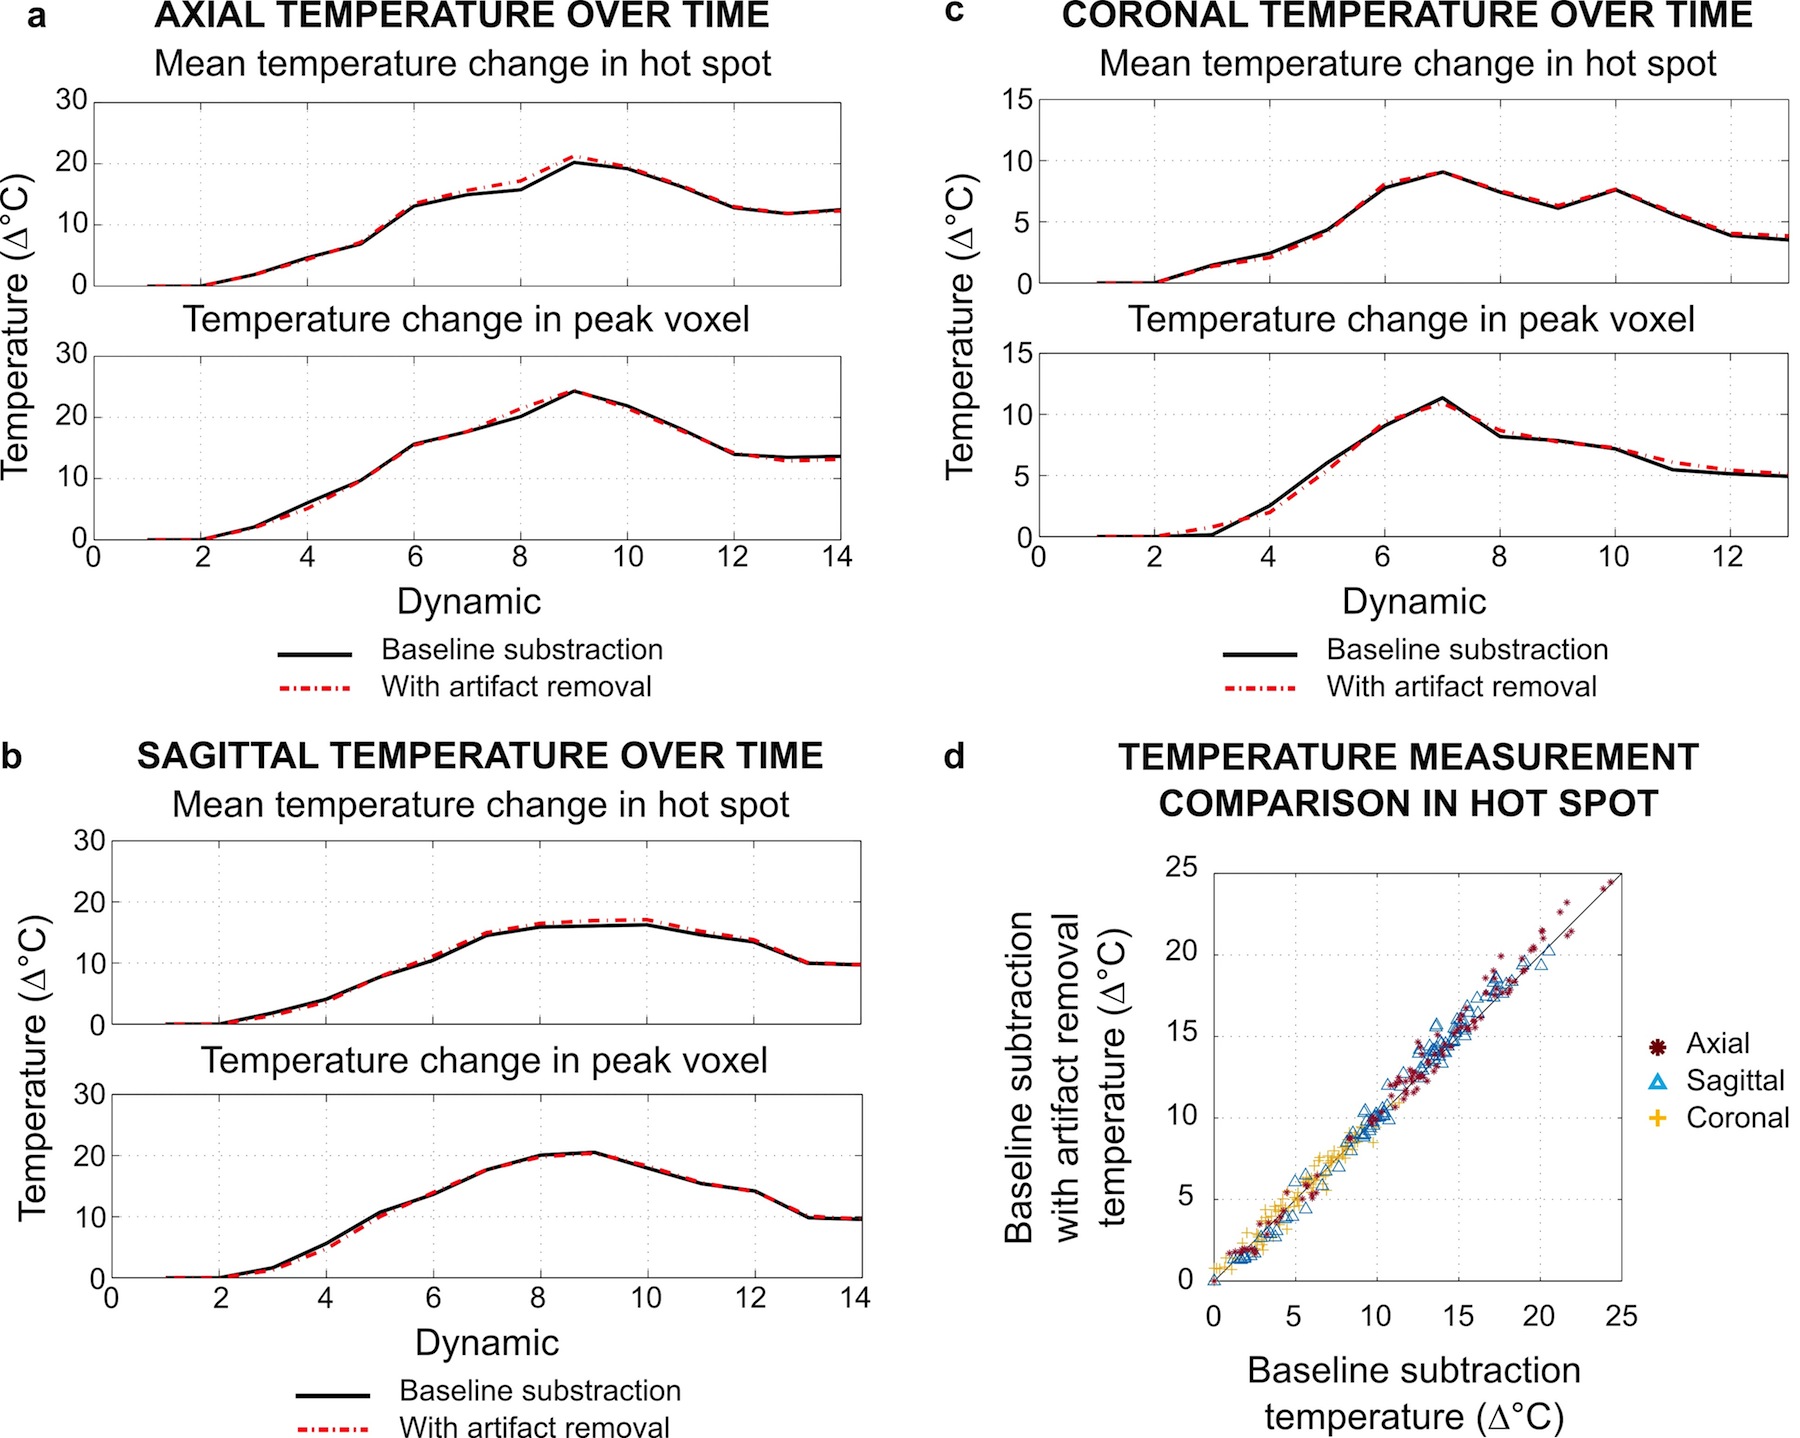
Patient treatment data. 2DFT GRE data were acquired during a clinical thermal ablation treatment in the brain at 3T (GE Signa, GE Healthcare, Milwaukee, WI, USA; Insightec ExAblate, Insightec Ltd., Haifa, Israel) with 8 receive coils, 28 ms TR, 12 ms TE, 280 x 280 mm2 FOV, 256 x 256 matrix, 3 mm slice thickness, 44 Hz readout BW per pixel, and either axial, sagittal, or coronal image slice orientation. The water bath was masked out of the images using a user defined region of interest (ROI) of the brain. Temperature maps were then reconstructed using baseline subtraction, using the second image dynamic for the baseline image. Mean temperature change was measured over a 3 x 3 square ROI centered on the temperature hot spot.
Results
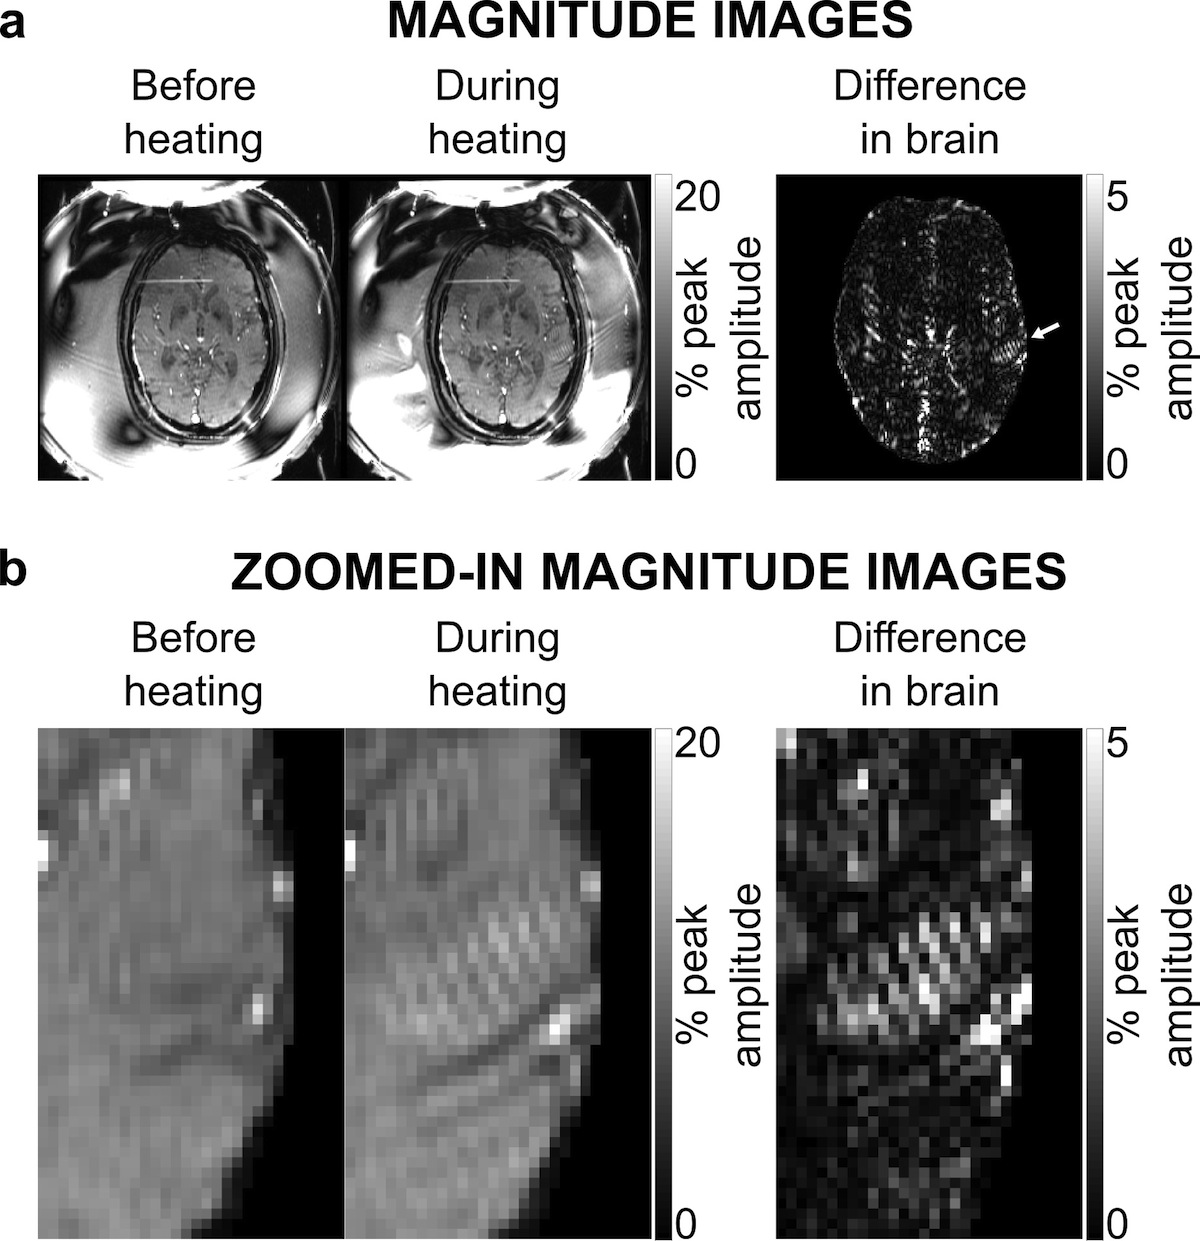
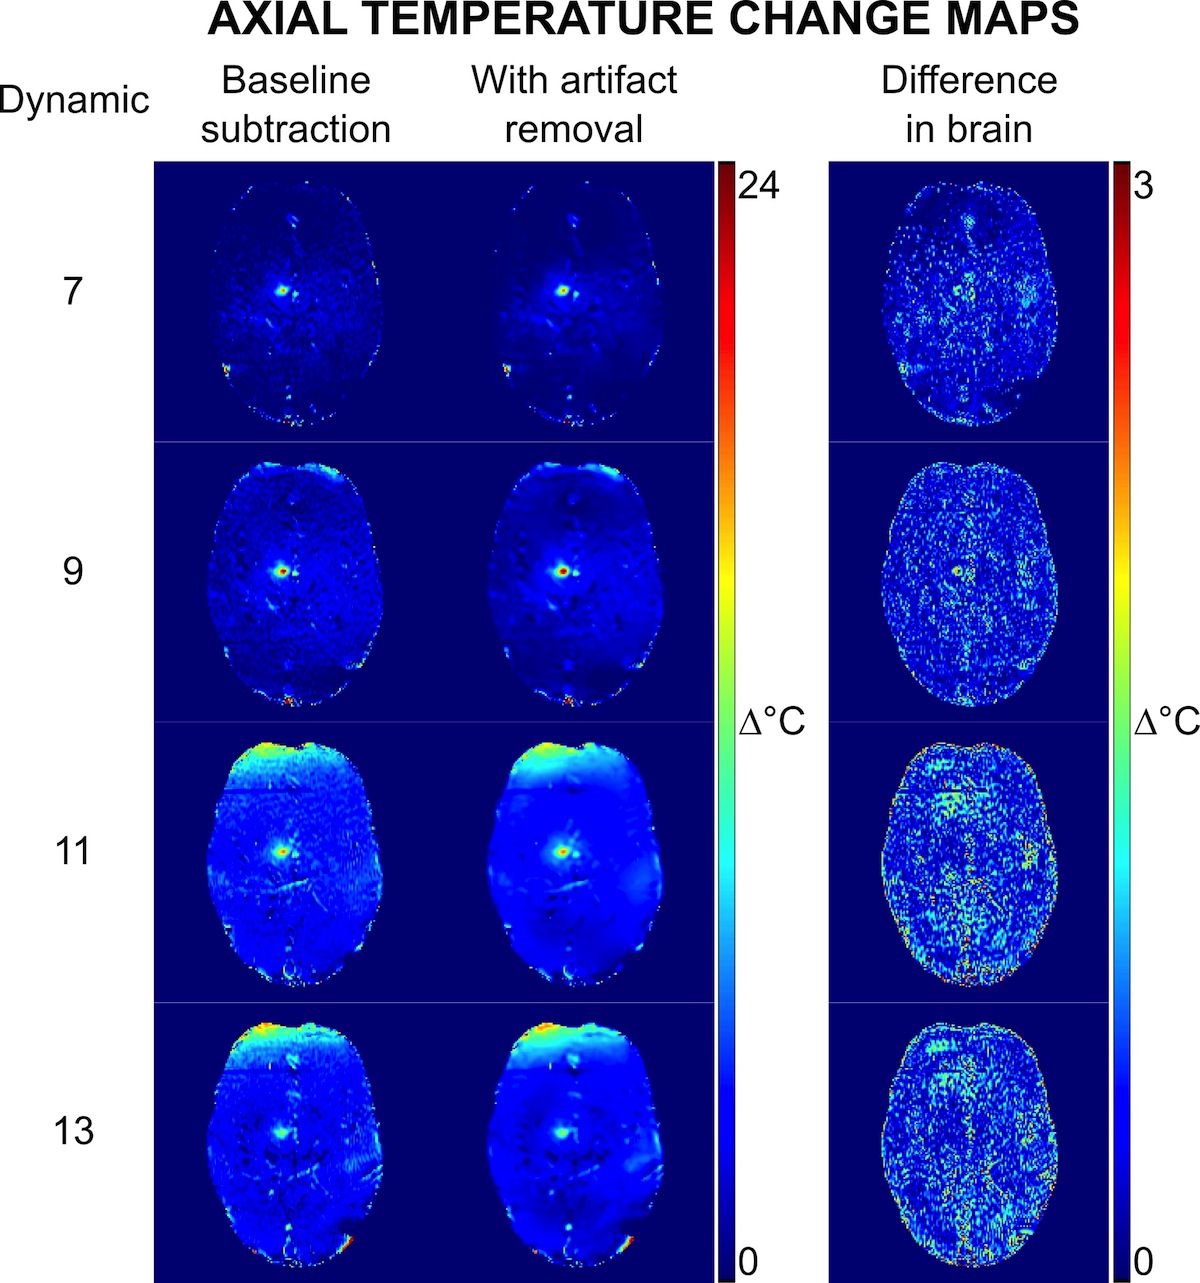
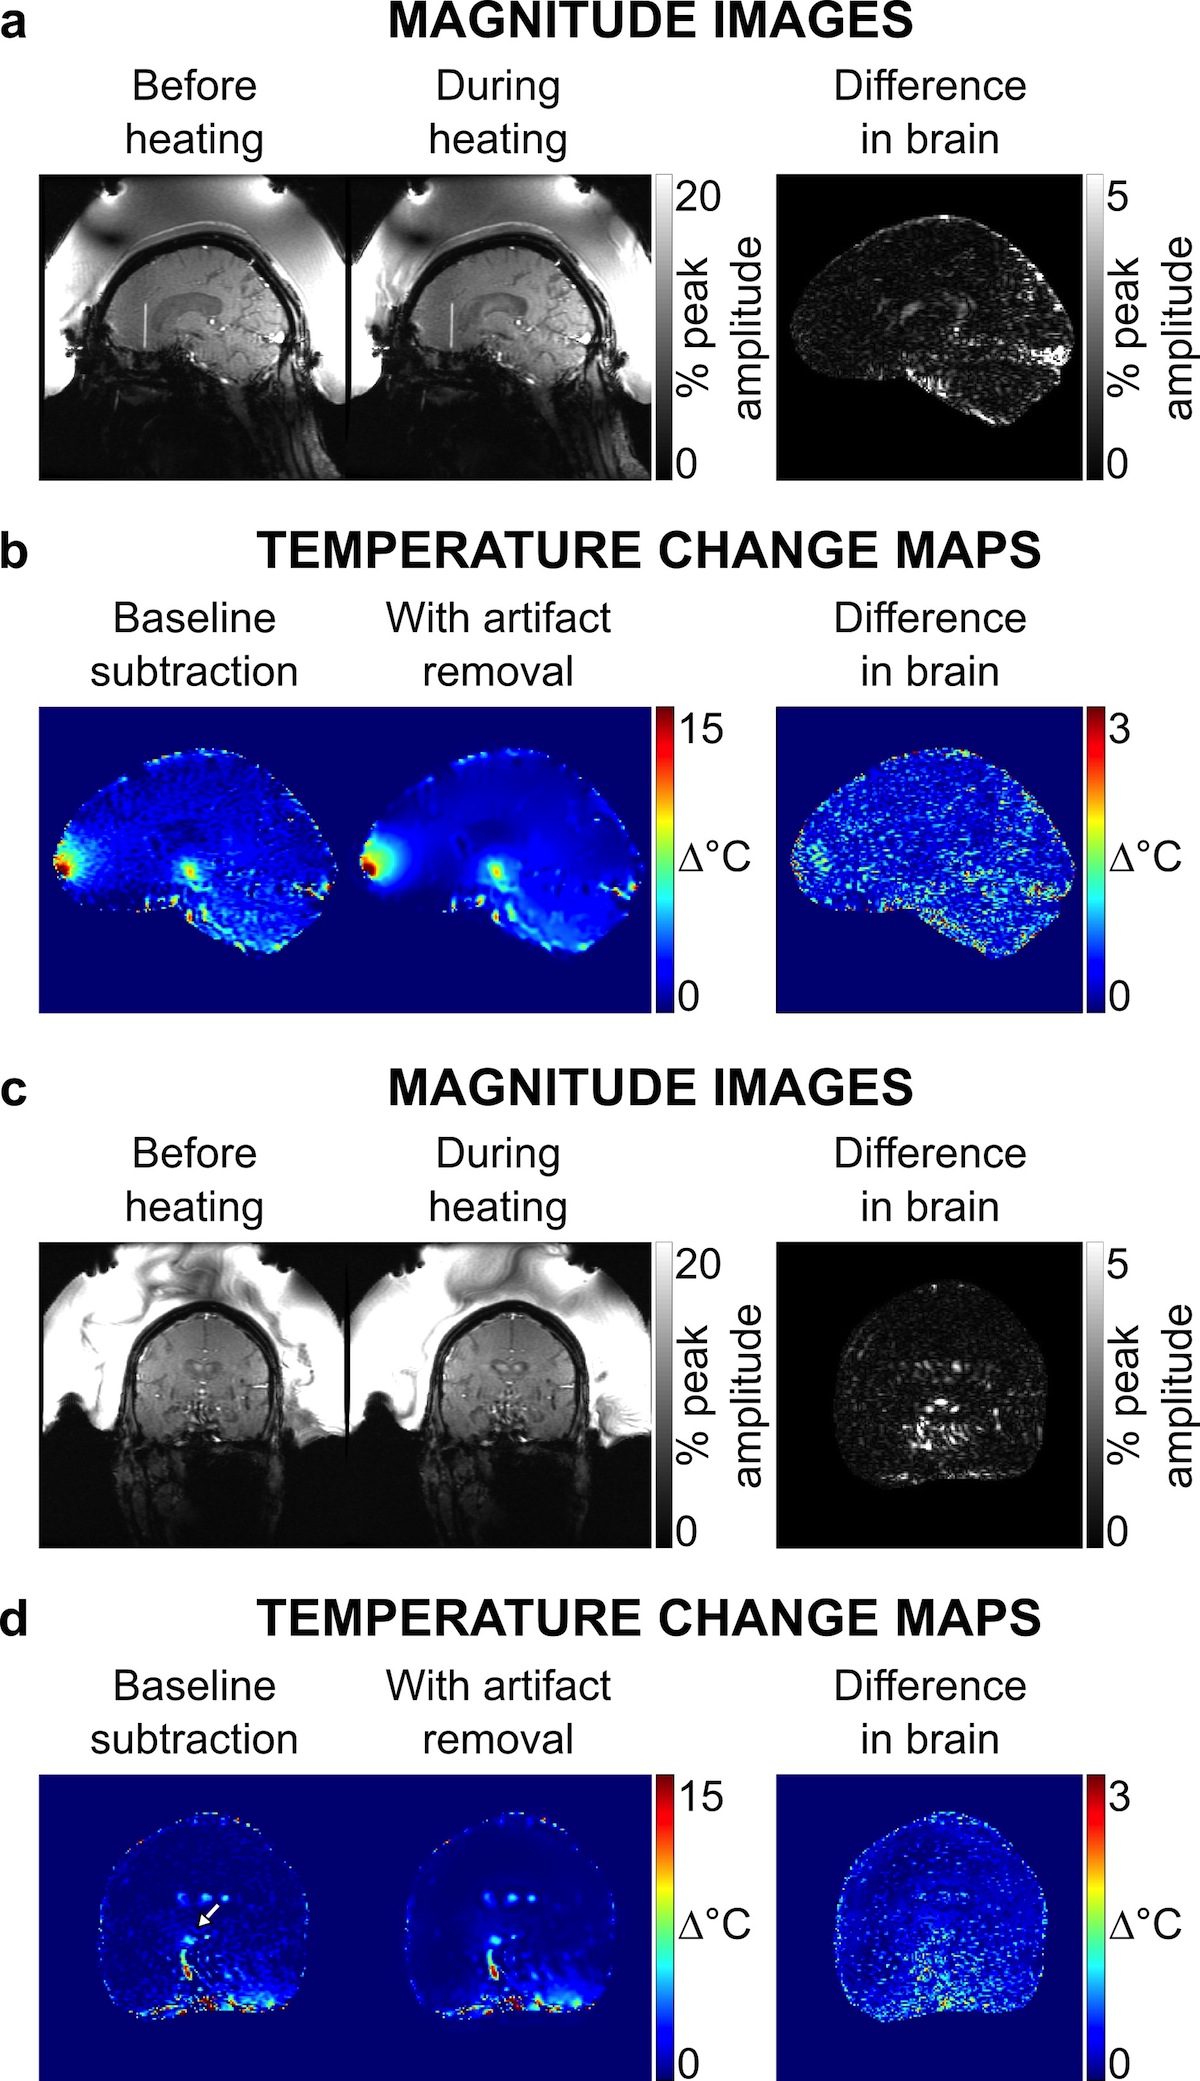
Figure 2 shows axial magnitude images acquired before and during heating, and a difference image within the brain ROI. Maps of temperature change before and after artifact removal and their difference are shown within the brain ROI in Fig 3 for four axial image dynamics. Hot spot appearance, mean temperature change, and temperature change in the peak voxel of the hot spot were similar for original baseline subtraction and artifact-removed temperature maps for all image orientations (Figs 3-5). However, results from the adapted denoising algorithm show reduced in-brain temperature artifacts. The temperature map difference image shows the removal of sharply varying features consistent with artifacts appearing in magnitude and phase images (Figs 3-4). Figure 5d shows temperature measurements for each voxel in the hot spot ROI. Average computation time for wavelet denoising was 0.2 s per map in MATLAB R2015a, without optimization for speed.Discussion and Conclusion
We have demonstrated the removal of temperature map artifacts resulting from water bath motion in MR-guided focused ultrasound treatment of the brain using a wavelet denoising algorithm. Temperature maps after artifact removal show similar measures of temperature change compared to the original baseline subtraction map. The reduction of temperature map artifacts in the brain is desirable during treatment monitoring and may aid in localizing the hot spot where the low temperature rise is masked by noise, and may also aid in the identification of unintended heating. This adaptation may also be useful as a sparsifying transform to remove artifacts from temperature maps calculated from undersampled data.Acknowledgements
This work was supported by the Focused Ultrasound Foundation and NIH R24 MH 109105.References
[1] Kovesi P. Phase preserving denoising of images. The Australian Pattern Recognition Society Conference: DICTA'99. 1999;4(3):212-217.
[2] Gabor D. Theory of communication. Part 1: The analysis of information. Journal of the Institution of Electrical Engineers - Part III: Radio and Communication Engineering. 1946:93(26):429-441.
[3] Field DJ. Relations between the statistics of natural images and the response properties of cortical cells. JOSA A. 1987;4(12):2379-94.
Figures