2593
Accumulated Thermal Dose in MR-Guided Focused Ultrasound for the Treatment of Essential TremorYuexi Huang1, Nir Lipsman2, Michael L. Schwartz2, Vibhor Krishna3, Francesco Sammartino3, Andres Lozano3, and Kullervo Hynynen1,4
1Sunnybrook Research Institute, Toronto, ON, Canada, 2Division of Neurosurgery, Sunnybrook Health Sciences Centre, Toronto, ON, Canada, 3Division of Neurosurgery, Toronto Western Hospital, Toronto, ON, Canada, 4Department of Medical Biophysics, University of Toronto, Toronto, ON, Canada
Synopsis
In focused ultrasound treatment of essential tremor, MR temperature and thermal dose measurements were crucial in guiding acoustic parameters. In this study, accumulated thermal doses from repeated sonications were integrated after chemical-shift artifacts were corrected retrospectively. Accumulated thermal dose measurements showed good correlation to lesion size in followup MR imaging.
Introduction
Magnetic resonance guided focused ultrasound (MRgFUS) has recently been approved by FDA in the treatment of essential tremor after its efficacy and safety profile were established by a randomized multi-centre trial1. The study showed that the required acoustic energy to produce a lesion varied significantly among patients. Therefore, MR thermometry played a crucial role in guiding acoustic parameters. Thermal dose of 17 and 240 cumulative equivalent minutes (CEM) at 43oC were used as the bracket on estimating the lesion size based on previous animal studies on brain tissues2. However, chemical shift artifacts in MR thermometry could cause misalignment of heating volumes over repeated sonications. Therefore, the accumulated thermal dose (ATD) over the entire treatment could be distorted. In this study, corrections on chemical-shift artifacts were performed retrospectively to improve accuracy on the calculation of ATD. Corrected ATD was correlated to the lesion size at the follow-up imaging on the first post-treatment day to find the best estimate for the thermal dose threshold.Methods
Thirty-six patients with medication-refractory essential tremor have been treated with a MRgFUS brain system (ExAblate 4000, 650kHz central frequency, InSightec, Tirat Carmel, Israel) and a 3 T MR scanner (MR750, GE Healthcare, Milwaukee, WI, USA). MR thermometry (TR 27.6 ms, TE 12.8 ms, slice thickness 3 mm, FOV 28cm, 256x128, temporal resolution 3.5s, bandwidth 44 Hz/pixel) was applied in three orthogonal dimensions separately to measure the focal temperature and the thermal dose. Corrections on chemical-shift artifacts were performed retrospectively in matlab if the misalignment was more than 1mm by manually shifting the centre of the heating volume on the frequency encoding direction back to the target. Only sonications with peak temperature greater than 50 oC were considered. ATDs were calculated in the axial plane. For sonications that MR thermometry were performed in the coronal or sagittal plane, focal heating was assumed ellipsoid and transformed to axial for the integration of ATD. Dimensions of ATDs at 17, 40, 100, 200 and 240 CEM were measured and correlated to lesion sizes measured in T1 (3D FSPGR, TR 8.3 ms, TE 3.3 ms, slice thickness 1.2 mm) and T2 images (FRFSE, TR 5200 ms, TE 100ms, slice thickness 3 mm) acquired on the first day follow-up.Results
Of a total of 232 included sonications, 83 needed correction on chemical shift artifacts. Lesion size on axial (AP and LR) measured by T2 images (6.2±1.3 mm) were 15% larger than that by T1 (5.3±1.2mm), possibly by the different image contrast on the margin of edema. As a result, the best correlation of ATD to lesion size by T2 was at 100 CEM (Fig.1a, linear regression slope=0.98, R2 =0.58), while the best correlation of ATD to lesion size by T1 was at 200 CEM (Fig.1b, linear regression slope=1.00, R2 =0.60). Logarithmic regression of ATD on T2 and T1 were shown in Fig.2.Discussion
The sources of chemical-shift artifacts were largely tissue off-resonance on the centre frequency, which was fixed throughout a treatment, and to a smaller degree, heating of the focal volume3. The magnitude of chemical shifts was only 1 to 2 mm in most cases. However, they cannot be ignored for lesions on the order of 5 mm. With retrospective manual correction on chemical-shift artifacts, ATD over repeated sonications were aligned and integrated more accurately. The current MR thermometry used a narrow bandwidth of 44 Hz/pixel due to limited SNR with the body coil. With better imaging coils in the future, chemical-shift artifacts can be minimized with a wider bandwidth. An earlier study suggested that 240 CEM underestimated the size of brain lesions, while 17 CEM overestimated4. However, in that study only one sonication with the highest peak temperature was considered. By integrating thermal doses from repeated sonications after correcting chemical-shift artifacts, it appeared the thermal threshold was close to 200 CEM if lesions are defined by T1 images. In fact, the difference between 200 and 240 CEM was only 0.2mm on average. Limitations of this study include potential errors in MR thermometry, partial volume effects in chemical-shift correction, patient variability, and the only time point available for measuring the lesion size (on day one). Therefore, this study is not intended for establishing thermal threshold of brain tissues. Rather, it can be considered as a practical guidance using ATD for predicting lesion size on day one followup in MRgFUS for essential tremor.Acknowledgements
No acknowledgement found.References
1. Elias WJ et al. N Engl J Med 2016;375(8):730-9.
2. McDannold et al. MRM 2004; 51:913–23.
3. Gaur P et al. MRM 2016;76:172-82.
4. Huang et al. ISMRM 2015, abstract 1638.
Figures
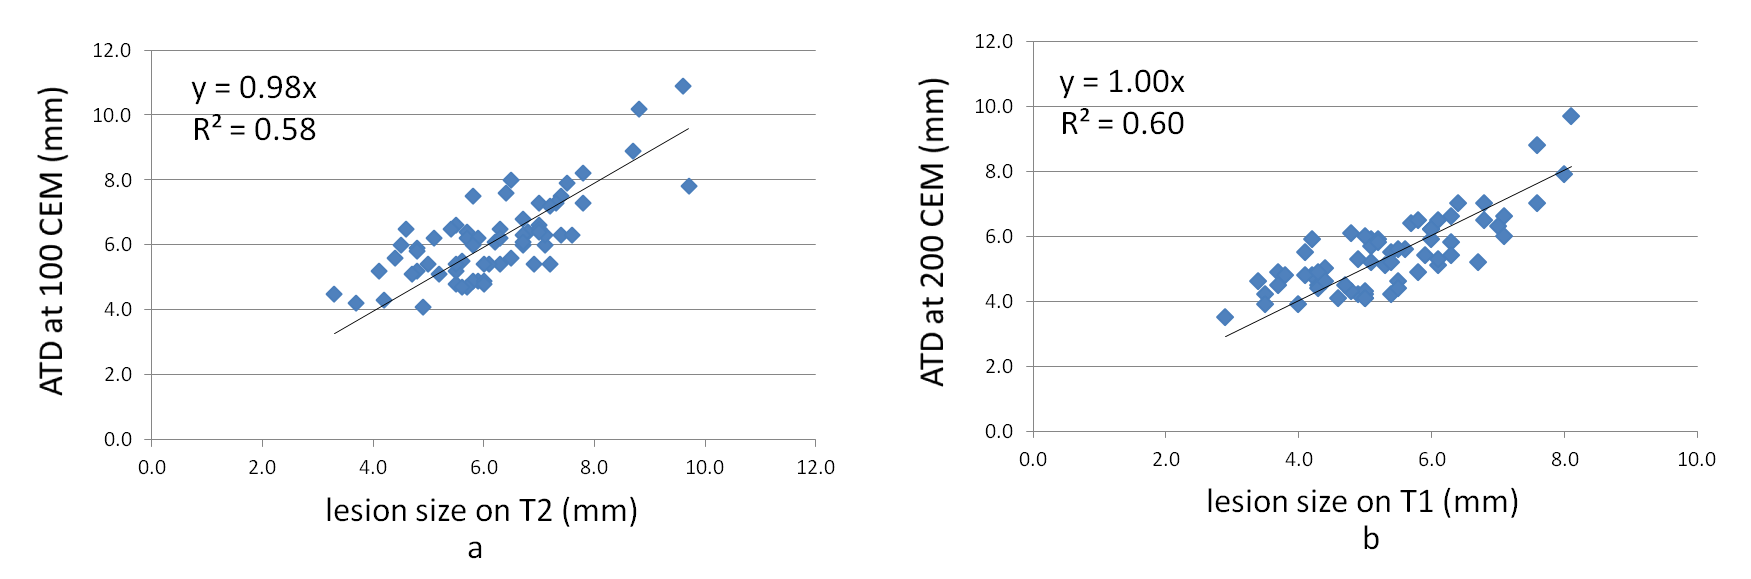
Fig.1 a) Regression of
ATD at 100 CEM on lesion size measured by T2; b) ATD at 200 CEM on lesion size
on T1.
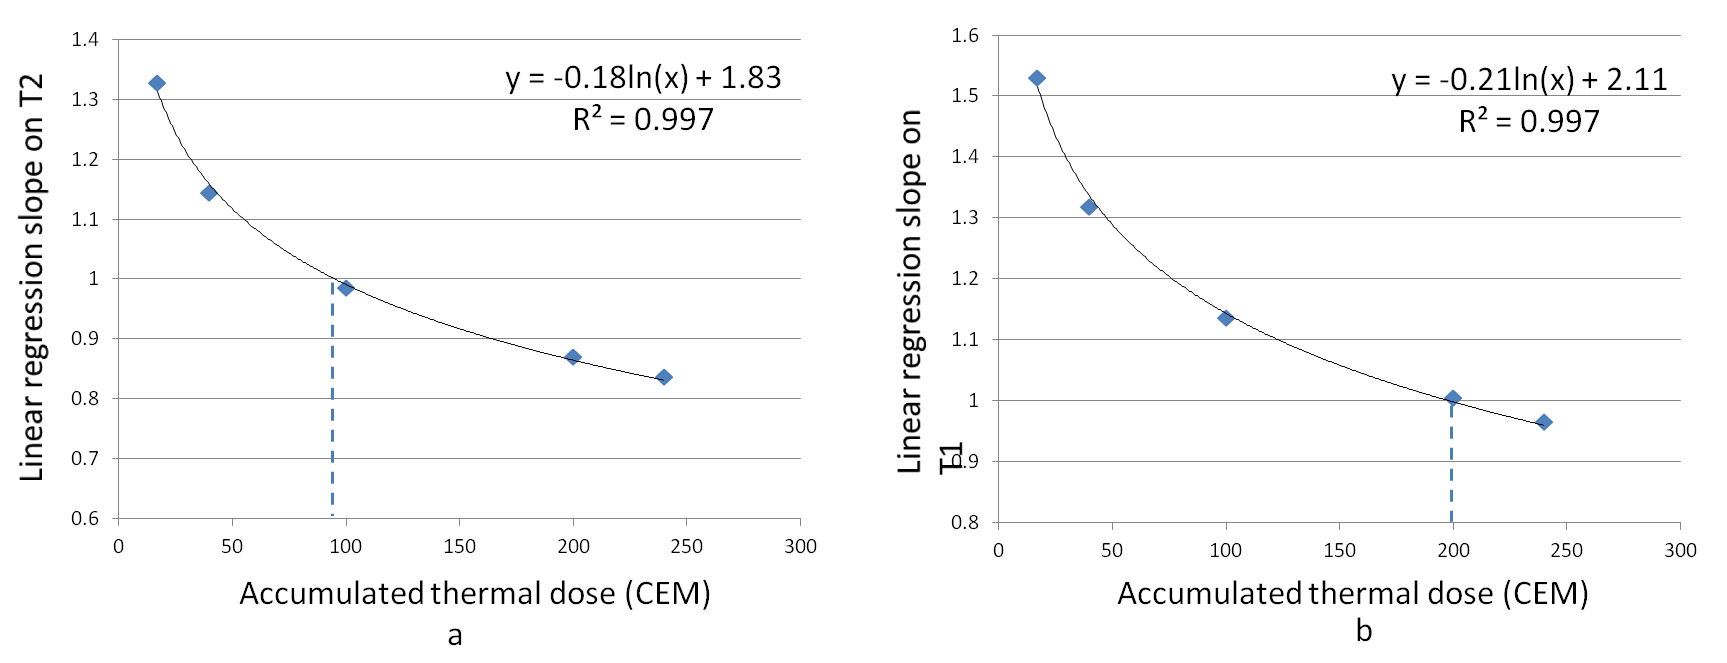
Fig.2 Linear regression
slopes on T2 (a) and T1 (b) at 17, 40, 100, 200 and 240 CEM. Logarithmic
regressions show that the best estimation of lesion size on T2 was around 100
CEM; best estimate on T1 was 200 CEM.