2589
Dynamic anti-aliasing image reconstruction for localized thermal therapiesHenrik Odéen1 and Dennis L Parker1
1Department of Radiology and Imaging Sciences, University of Utah, Salt Lake City, UT, United States
Synopsis
A novel image reconstruction algorithm for dynamic anti-aliasing image reconstruction (DAIR) of proton resonance frequency shift (PRFS) MR temperature maps from subsampled k-space data for localized heatings is presented. DAIR makes use of a pre-heating, fully sampled image to find and remove the aliasing artifact in a dynamic series of images. The algorithm is demonstrated using CAIPI-like sampling patterns in a 3D segmented EPI pulse sequence and focused ultrasound heatings in a tissue mimicking gelatin phantom. DAIR reconstructed PRFS temperature maps showed good agreement with fully sampled “truth” for k-space reduction factors of 2 – 4.
Purpose
MRI has become the imaging modality of choice to monitor thermal therapies such as focused ultrasound (FUS), microwave, and laser induced thermal therapies (LITT) because it combines good contrast anatomical imaging with the ability to monitor temperature change using the proton resonance frequency shift (PRFS) method. Acquiring high spatio-temporal resolution PRFS-maps with real-time image reconstruction remain challenging. Non-Cartesian acquisitions such as radial and spiral imaging are fast and efficient, but reconstruction including gridding and off-resonance correction can be time consuming(1). Iterative and thermal model-based methods have also been described, but iterative methods are computationally heavy by nature, and model based methods require knowledge of tissue and thermal properties(2–5). Parallel imaging can also be employed(6), but for some treatment systems only a single receive coil is available. In this work we present a dynamic anti-aliasing image reconstruction (DAIR) method that is appropriate for subsampled k-space data for localized thermal therapies. A fully sampled reference image acquired before the start of the heating is used to remove the aliasing artifact from dynamic subsampled images acquired during the heating. DAIR does not make use of multiple coils, and image reconstruction is very fast.Methods
The DAIR algorithm is described in Figure 1. The method is very fast since the aliasing artifact can be computed once a fully sampled reference image is acquired, and the dynamic image reconstruction is then a simple subtraction in image space. All imaging was performed on a 3T scanner (PrismaFit, Siemens, Germany) with a 3D gradient recalled echo segmented echo planar imaging pulse sequence. The signal was detected with an in-house built single-channel RF loop coil. Three different CAIPI-type sampling patterns (7) with subsampling factor of R = 2, 3, and 4 were used. For R = 2 and 3 Ry = 1 and Δ = 1, and for R = 4 Ry = 2 and Δ = 1, as defined in (7). All data was zero-filled interpolated to 1-mm isotropic voxel spacing. FUS sonications were performed with a 1-MHz 256-element phased-array transducer (Imasonic/IGT, France) in a tissue mimicking gelatin phantom. All MR and FUS parameters are listed in Table 1. Three sonications were imaged with each subsampling pattern. For comparison identical sonications were monitored with fully sampled “truth” data acquisitions (at lower temporal resolution).Results
Figure 2 show a comparison of phase maps for the three subsampling schemes, comparing the aliased phase map (i.e. from the 3D Fourier transform of the subsampled data), to phase map resulting from a complex subtraction between two subsampled frames, phase map of the DAIR reconstructions, and lastly the DAIR phase map after complex baseline subtraction. Figures 3 and 4 show temperature rise versus time and spatial temperature maps at maximum heating, compared to fully sampled “truth”.Discussion
Phase maps in Figure 2 show that DAIR reconstructions experience less artifacts and a more coherent focal spot than is the result of complex subtraction of two aliased images. Temperature curves and maps in Figures 3 and 4 further show good agreement with fully sampled “truth”. For in-vivo imaging multiple baseline images can be acquired and used to decrease sensitivity to motion. In this work only single RF-coil data was used, but DAIR extends naturally to multi-coil data. The fact that the dynamic reconstruction is a simple subtraction means it lends it self well for real-time applications. The limiting factor in DAIR is the spacing of the delta functions in the point-spread function (which depends on R), Figure 1d, with respect to the size of the heating pattern. If the heating pattern is larger than FOV/R the aliasing subtraction might not be clean. Because of this limitation DAIR might be most useful for LITT and microwave heating, and less useful for FUS where the fully insonified FOV is ideally monitored for off-focal heating.Conclusions
A novel image reconstruction algorithm for undersampled MRI monitoring of localized heating has been presented. Accurate PRFS temperature maps monitoring FUS heatings in a phantom was achieved. Future work will investigate SNR behavior and constraints, combining DAIR with parallel imaging methods, and investigate reconstruction of non-Cartesian data.Acknowledgements
This work was supported by a University of Utah seed grant, and NIH grants R01s EB013433, and CA172787.References
1. Marx M, Butts Pauly K. Improved MRI thermometry with multiple-echo spirals. Magn. Reson. Med. 2016;76:747–756. 2. Todd N, Adluru G, Payne A, DiBella EVR, Parker D. Temporally constrained reconstruction applied to MRI temperature data. Magn. Reson. Med. 2009;62:406–19. 3. Gaur P, Grissom WA. Accelerated MRI thermometry by direct estimation of temperature from undersampled k-space data. Magn. Reson. Med. 2015;73:1914–25. 4. Todd N, Payne A, Parker DL. Model predictive filtering for improved temporal resolution in MRI temperature imaging. Magn. Reson. Med. 2010;63:1269–1279. 5. Denis de Senneville B, Roujol S, Hey S, Moonen C, Ries M, Roujol E, Hey S, Moonen C, Ries M. Extended Kalman filtering for continuous volumetric MR-temperature imaging. IEEE Trans. Med. Imaging 2013;32:711–8. 6. Mei CS, Panych LP, Yuan J, McDannold NJ, Treat LH, Jing Y, Madore B. Combining two-dimensional spatially selective RF excitation, parallel imaging, and UNFOLD for accelerated MR thermometry imaging. Magn. Reson. Med. 2011;66:112–22. 7. Breuer FA, Blaimer M, Mueller MF, Seiberlich N, Heidemann RM, Griswold MA, Jakob PM. Controlled aliasing in volumetric parallel imaging (2D CAIPIRINHA). Magn. Reson. Med. 2006;55:549–556.Figures
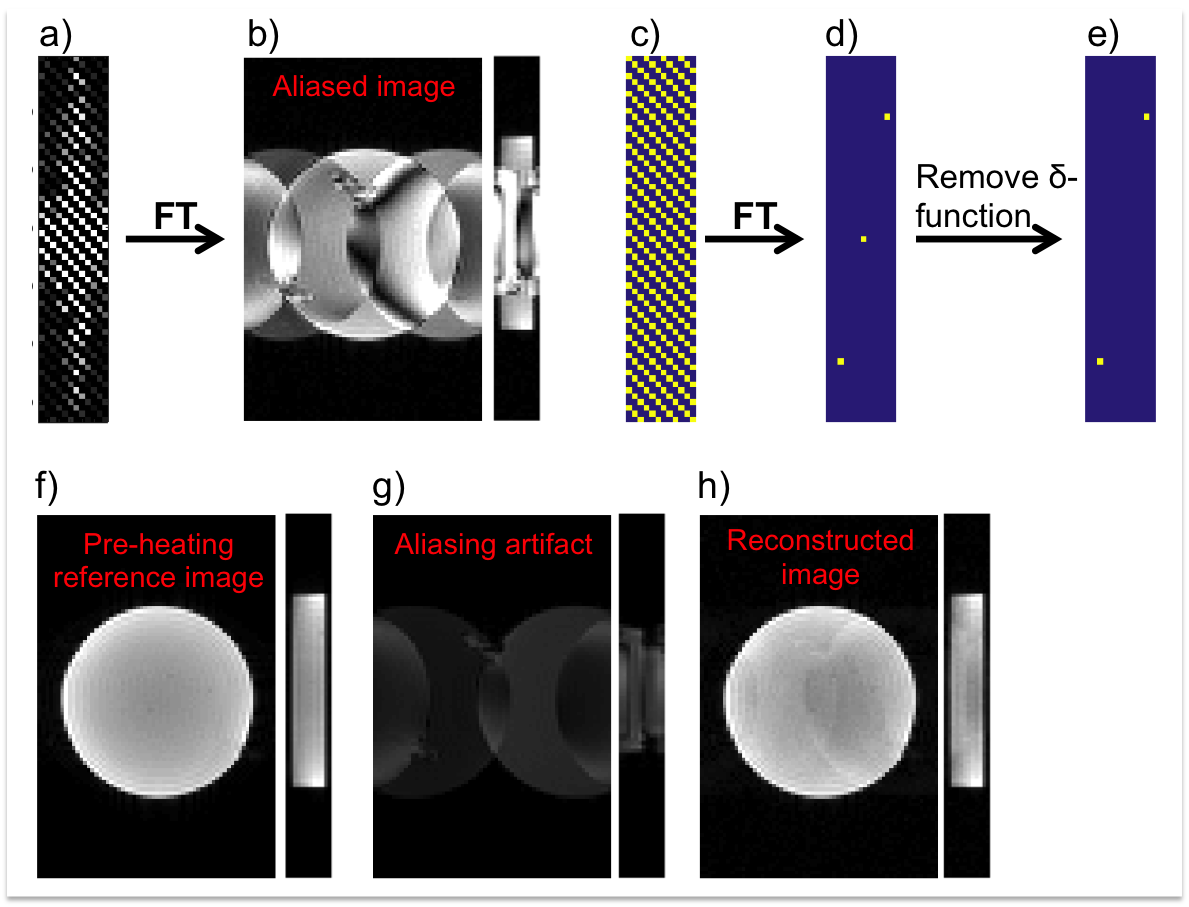
Figure 1. DAIR reconstruction. a)ky-kz-plane
of k-space subsampled with CAIPI-pattern(R=3), and b) 2 orthogonal views (x-y- and
x-z-planes)
of corresponding aliased image. The Fourier-transform of a
binary mask representing the CAIPI sampling-pattern,(c),
results in the corresponding point-spread function,(d), with
number of δ-functions=R.
Removing the central δ-function,(e),
and convolving the remaining pattern with a fully sampled reference image
acquired before the
heating,(f),
results in an image containing just the un-wanted aliasing artifact,(g).
Subtracting (g) from (b) results in a cleanly reconstructed image,(h).
In the absence of motion, the remaining change is in magnitude and phase due to
the local heating.
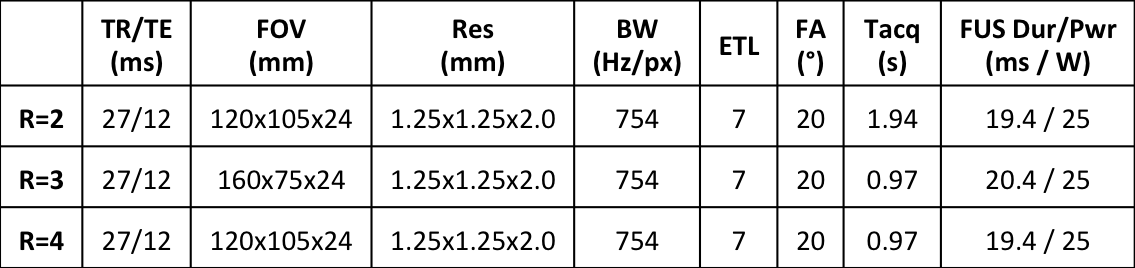
Table 1. MR and FUS parameters. R –
Subsampling factor, TR – Repetition time, TE – Echo time, FOV – Field of View,
Res – Imaging resolution (zero-filled interpolated to 1-mm isotropic voxel
spacing), BW – Readout bandwidth, ETL – Echo train length, FA - Flip angle,
Tacq – Acquisition time, FUS Dur – Focused Ultrasound Duration, FUS Pwr –
Focused Ultrasound Power.
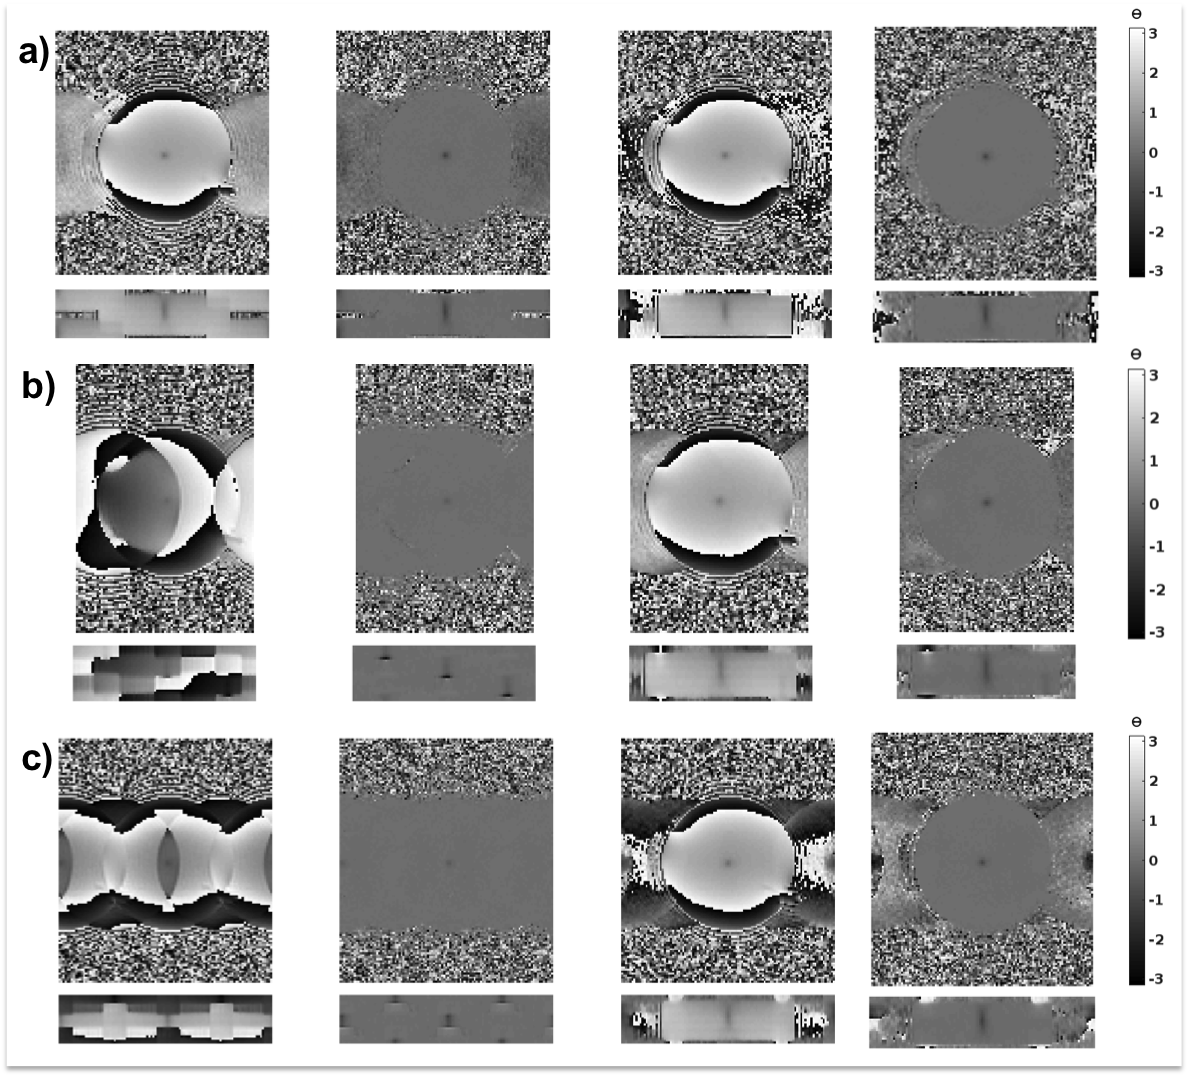
Figure 2. Phase maps. Phase
maps for a) R=2, b) R=3, and c) R=4. The four columns show 1) the phase of the
subsampled image (i.e. containing the full aliasing artifact), 2) the phase
after complex subtraction of a subsampled baseline image from before the start
of FUS, 3) the phase of the DAIR image, and 4) the DAIR image after complex subtraction of
baseline image.
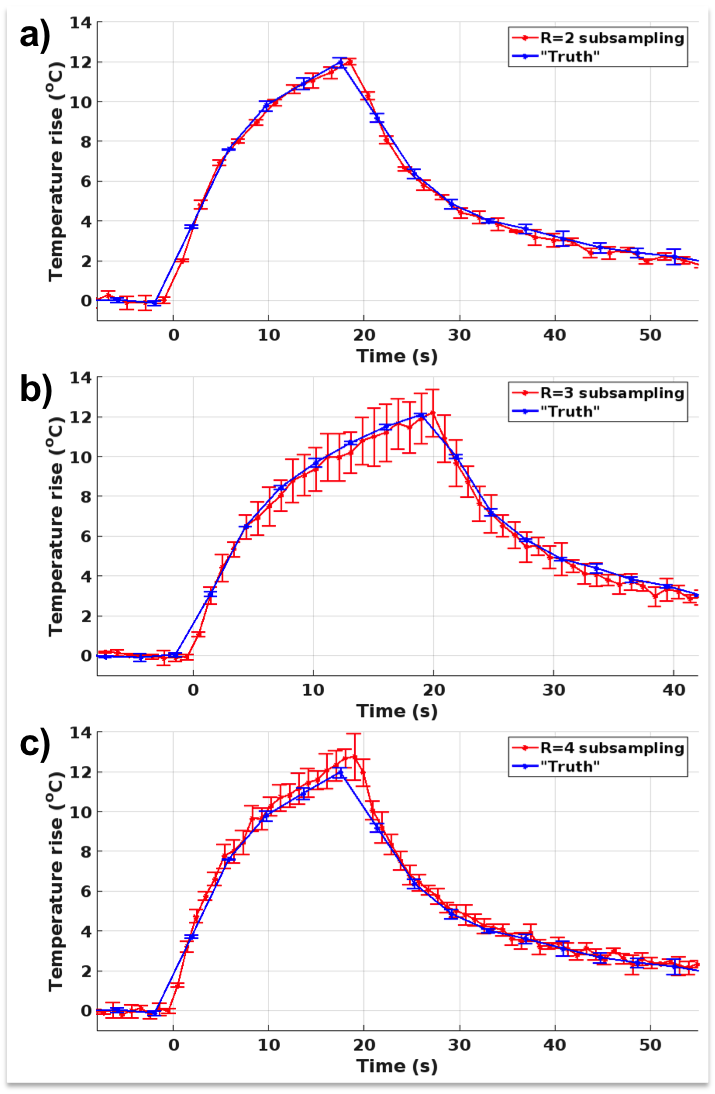
Figure 3. Temperature rise as a function
of time. Mean
and standard deviation of the hottest voxel in the focal spot as a function of
time for a) R=2, b) R=3, c) R=4. Each of the subsampling schemes (red lines)
are the mean of 3 repeated sonications, and each of the “truths” are mean of 2
repeated sonications.
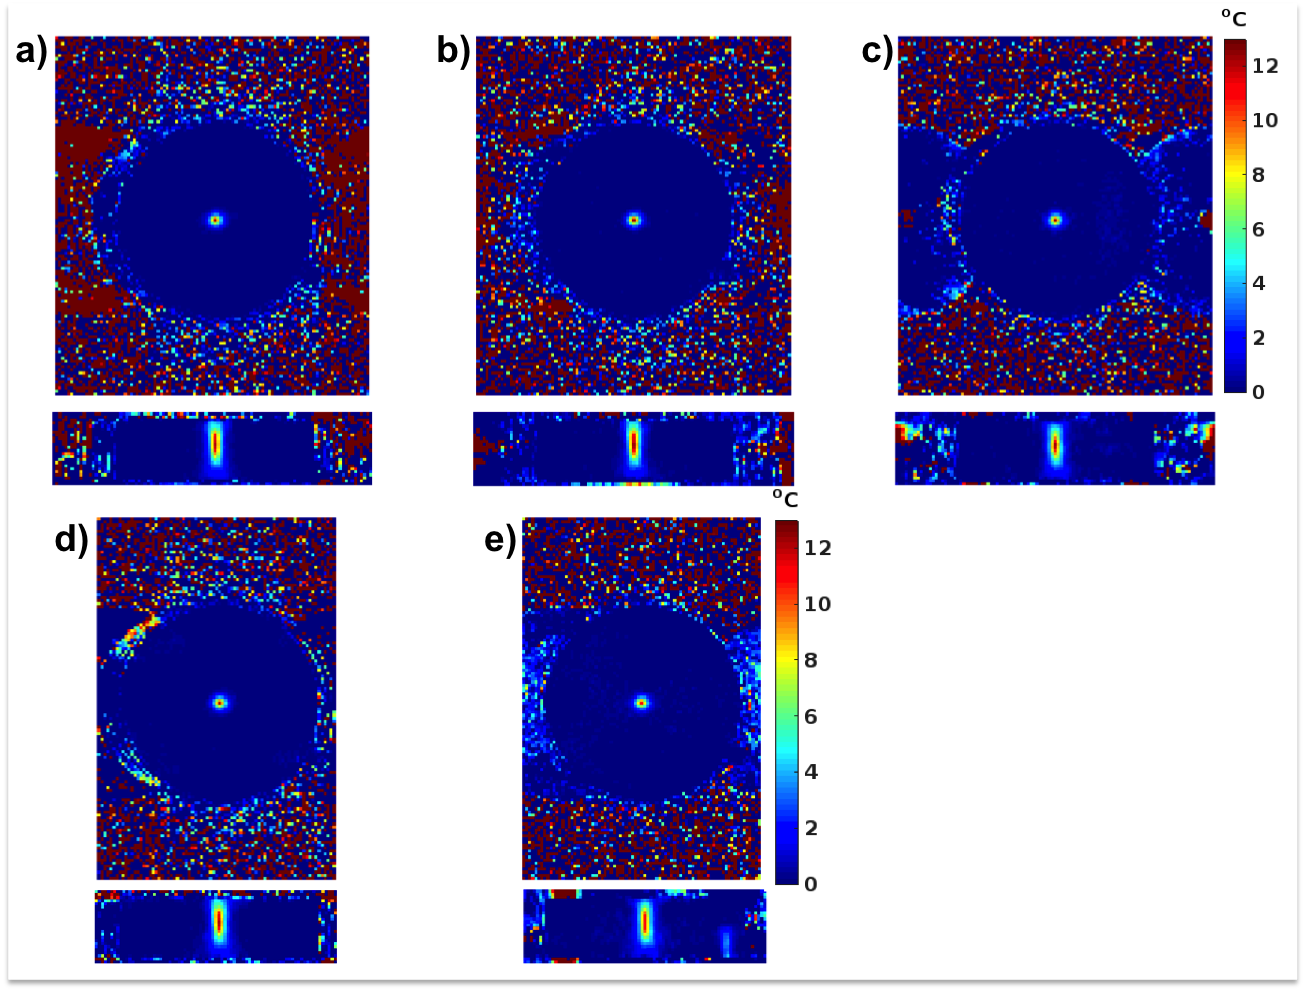
Figure 4. Temperature maps at maximum
heating. Two
orthogonal views (x-y and z-y planes) of temperature maps for: a) Lower
temporal resolution fully sampled map used as “truth” for R=2 and R=4, b) map
for R=2, c) map for R=4, d) fully sampled “truth” for R=3, and e) map for R=3.