2588
Comparison of Temperature Mapping Methods Using Proton Resonance Frequency Shift and T1 in 3-T and 7-T MRI1Department of Electronics and Information Engineering, Korea University, Seoul, Korea, Republic of, 2ICT convergence technology for Health & Safety, Korea University, Sejong, Korea, Republic of, 3Bioimaging Research Team, Korea Basic Science Institute, 4Research Institute for Advanced Industrial Technology, Korea University, Sejong, Korea, Republic of
Synopsis
Although temperature imaging in 7.0 T MRI has the advantage of increased SNR compared to lower field, it is more sensitive to susceptibility causing more artifacts. Since the 7.0 T MRI is also affected more by the electrical conductivity, temperature-dependency of the electrical conductivity is also affecting the resultant images. This work compares the temperature mapping methods for RF hyperthermia in 7.0 T and 3.0 T MRI and proposes the new temperature mapping method appropriate to 7.0 T MRI under the environment of changing conductivity.
Introduction
Temperature imaging in 7.0 T MRI has the advantage of increased SNR compared to MRI of lower B0. However, 7.0 T MRI is more sensitive to susceptibility and prone to more motion artifacts compared to lower field strength. In addition, 7.0 T MR images are affected by electrical conductivity (σ) more than those from the lower field [1] due to the temperature dependency of the conductivity. This may cause resultant errors in T1 map using Variable Flip Angle (VFA) method due to the B1 nonuniformity [2]. However, this effect can be effectively utilized for correct temperature mapping. In this paper, we will compare the temperature mapping methods using the PRFs-based, B1-affected T1 (B1aT1)-based, and B1-effect corrected T1 (B1ecT1)-based [3] at both 7.0 T and 3.0 T MRI’s and propose proper choices of B1-based temperature mapping methods for 7.0 T MRI.Materials and Methods
Experiments were performed on a 7 T and 3 T MRI (Philips Achieva, The Netherlands). Our MR-compatible RF hyperthermia system works at 13.56 MHz without affecting the MR image acquisition[4]. The human-tissue-mimic phantom (agarose/NaCl/CuSO4, 15/2/1 g/L; σ, 1.1725 S/m; ϵr, 77.69) and swine tissue are heated for 1 hour. MR temperature images at 7.0 T and 3.0 T were obtained every 10 minutes with a volume TR coil and a 16-ch NV coil, respectively. The image set has two T1-FFE scans (for the PRFs-based, the B1aT1-based, and the B1ecT1-based method) and Actual Flip Angle (AFI) scan[5] (for the B1 correction and the B1-based method). The first T1-FFE and second T1-FFE parameters were TR/TE = 50/2 ms and FA = 10o and TR/TE = 50/2 ms and FA = 35o, respectively. The B1 map was acquired using AFI method which uses dual TR sequence and the scan parameters were TR/TE/FA = 25&125/2 ms and FA = 60o . All scans were performed using voxel size = 1X1X5 mm3, FOV = 192X192, and number of slice = 1. These parameters were same for both 7.0 T and 3.0 T MRI. The temperature change using the PRFs/B1aT1/B1ecT1-based method was calculated using the phase and T1 changes from the baseline, respectively. Additionally, for PRFs-based method, a correction for phase drift was performed by using oil phantom and for B1aT1-based method, B1 correction was performed by acquiring B1 map using AFI.
In the proposed B1-based method,
∆TB1=mB1(∆B1),
where ∆TB1 the temperature change monitored by B1-based method, ∆B1 the B1 change during temperature change, and mB1 the temperature dependency of B1 change.
Results
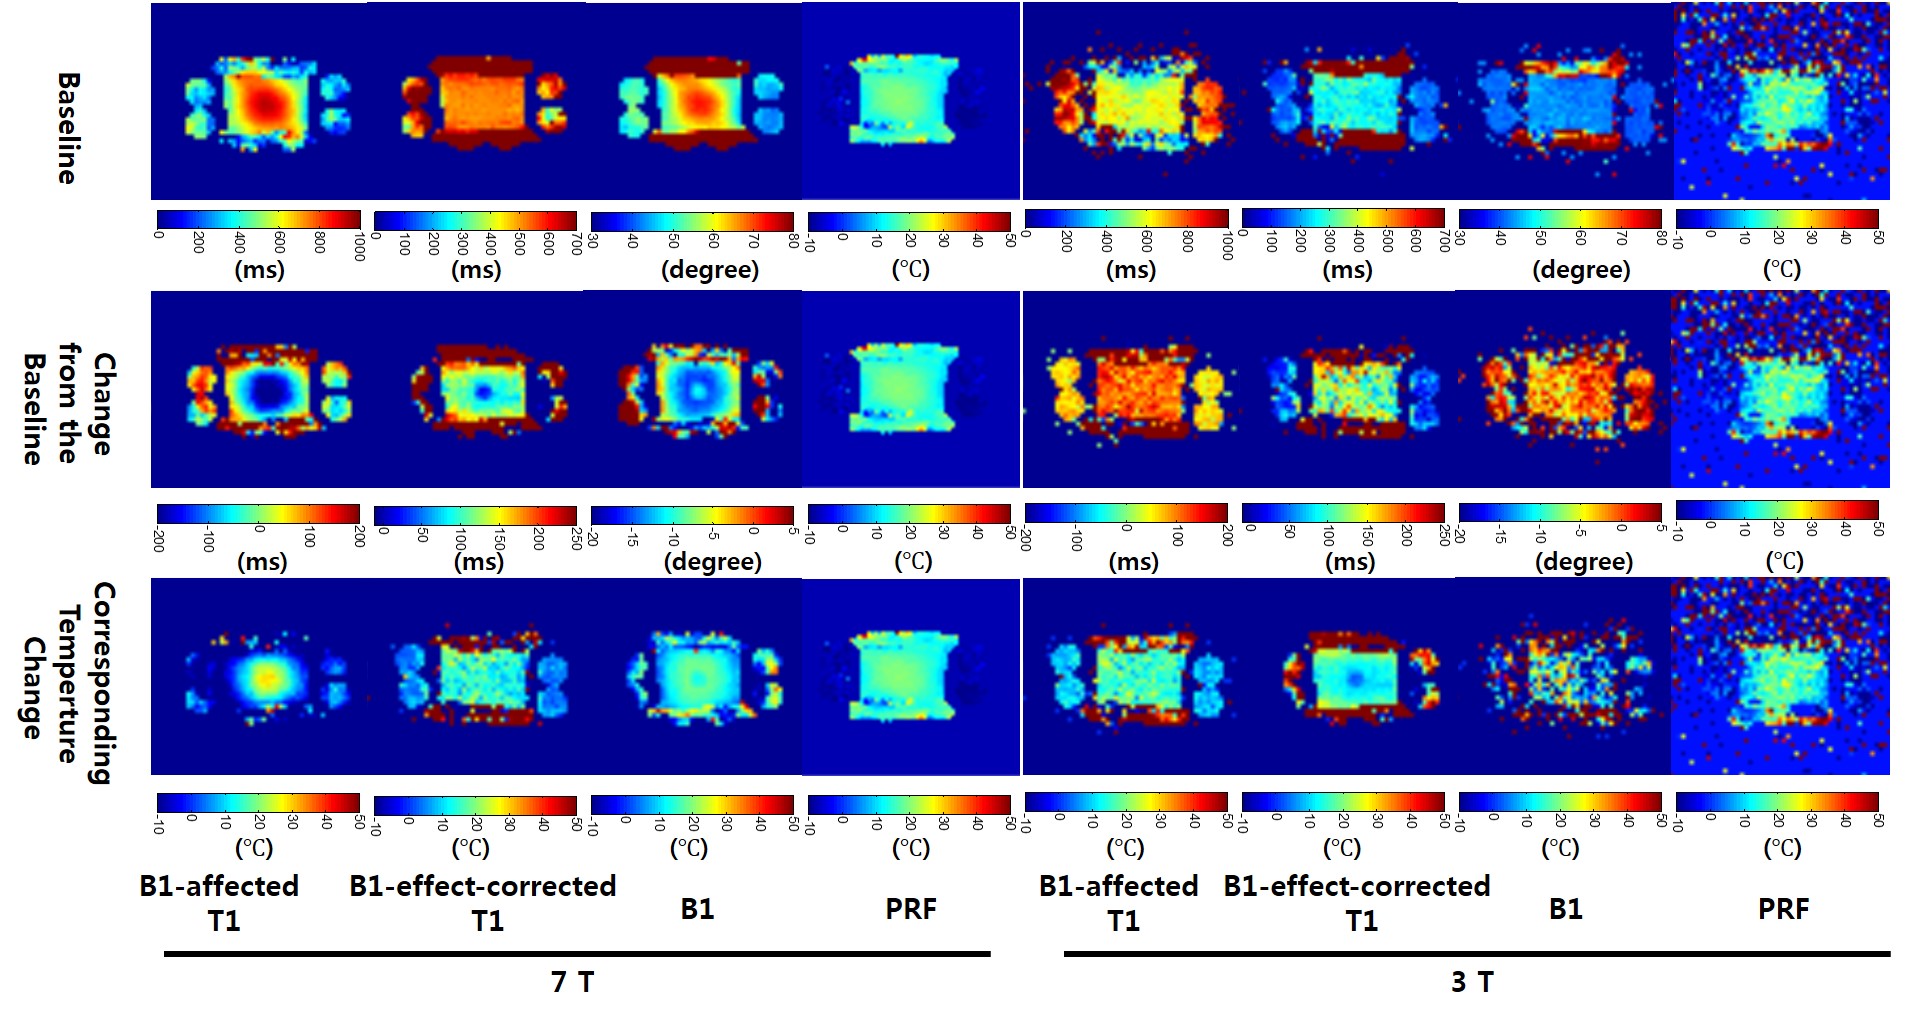
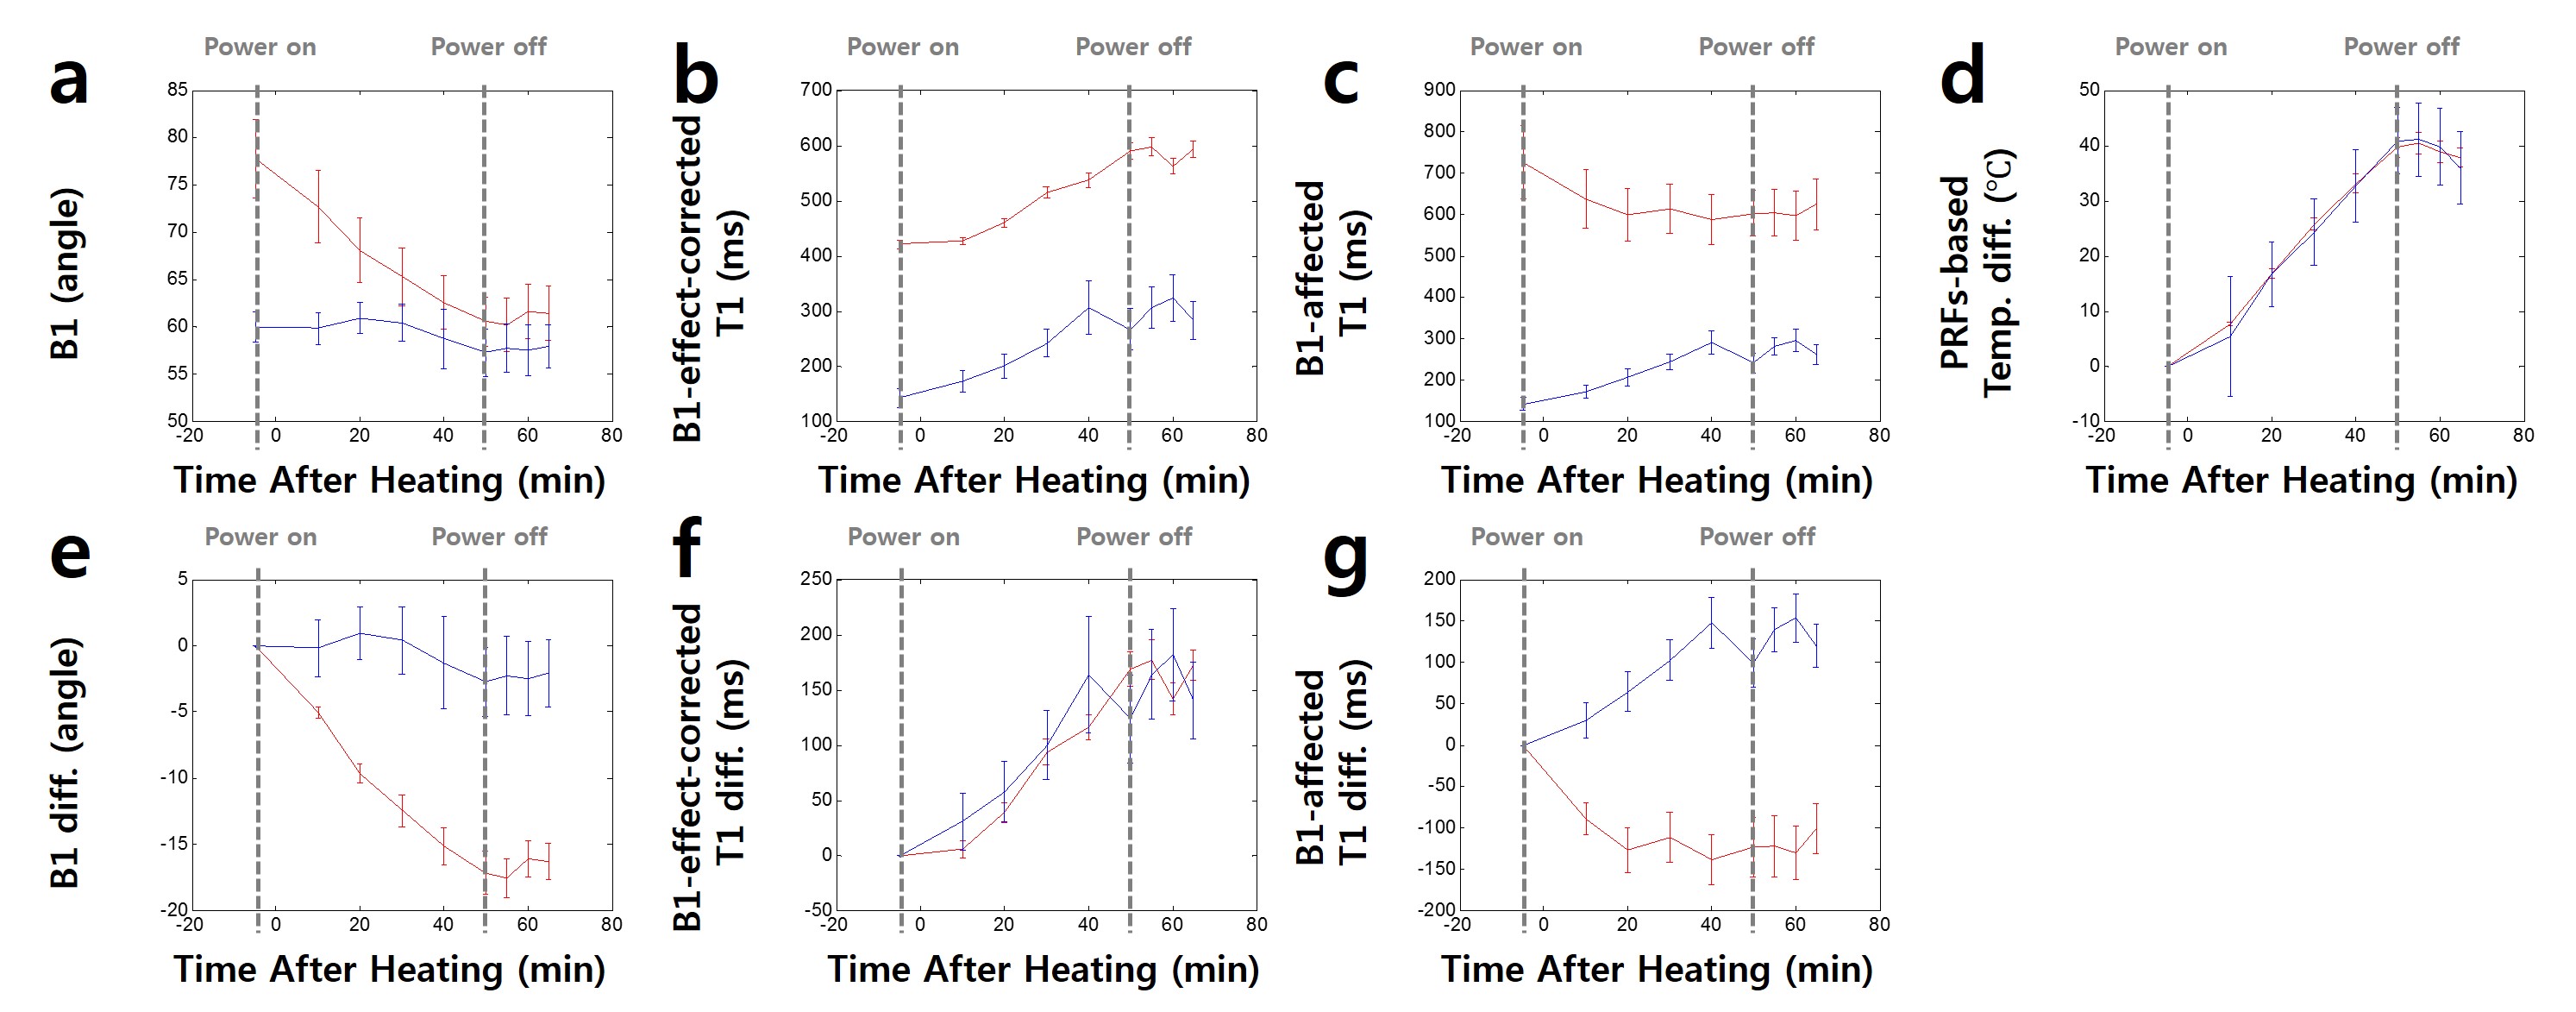
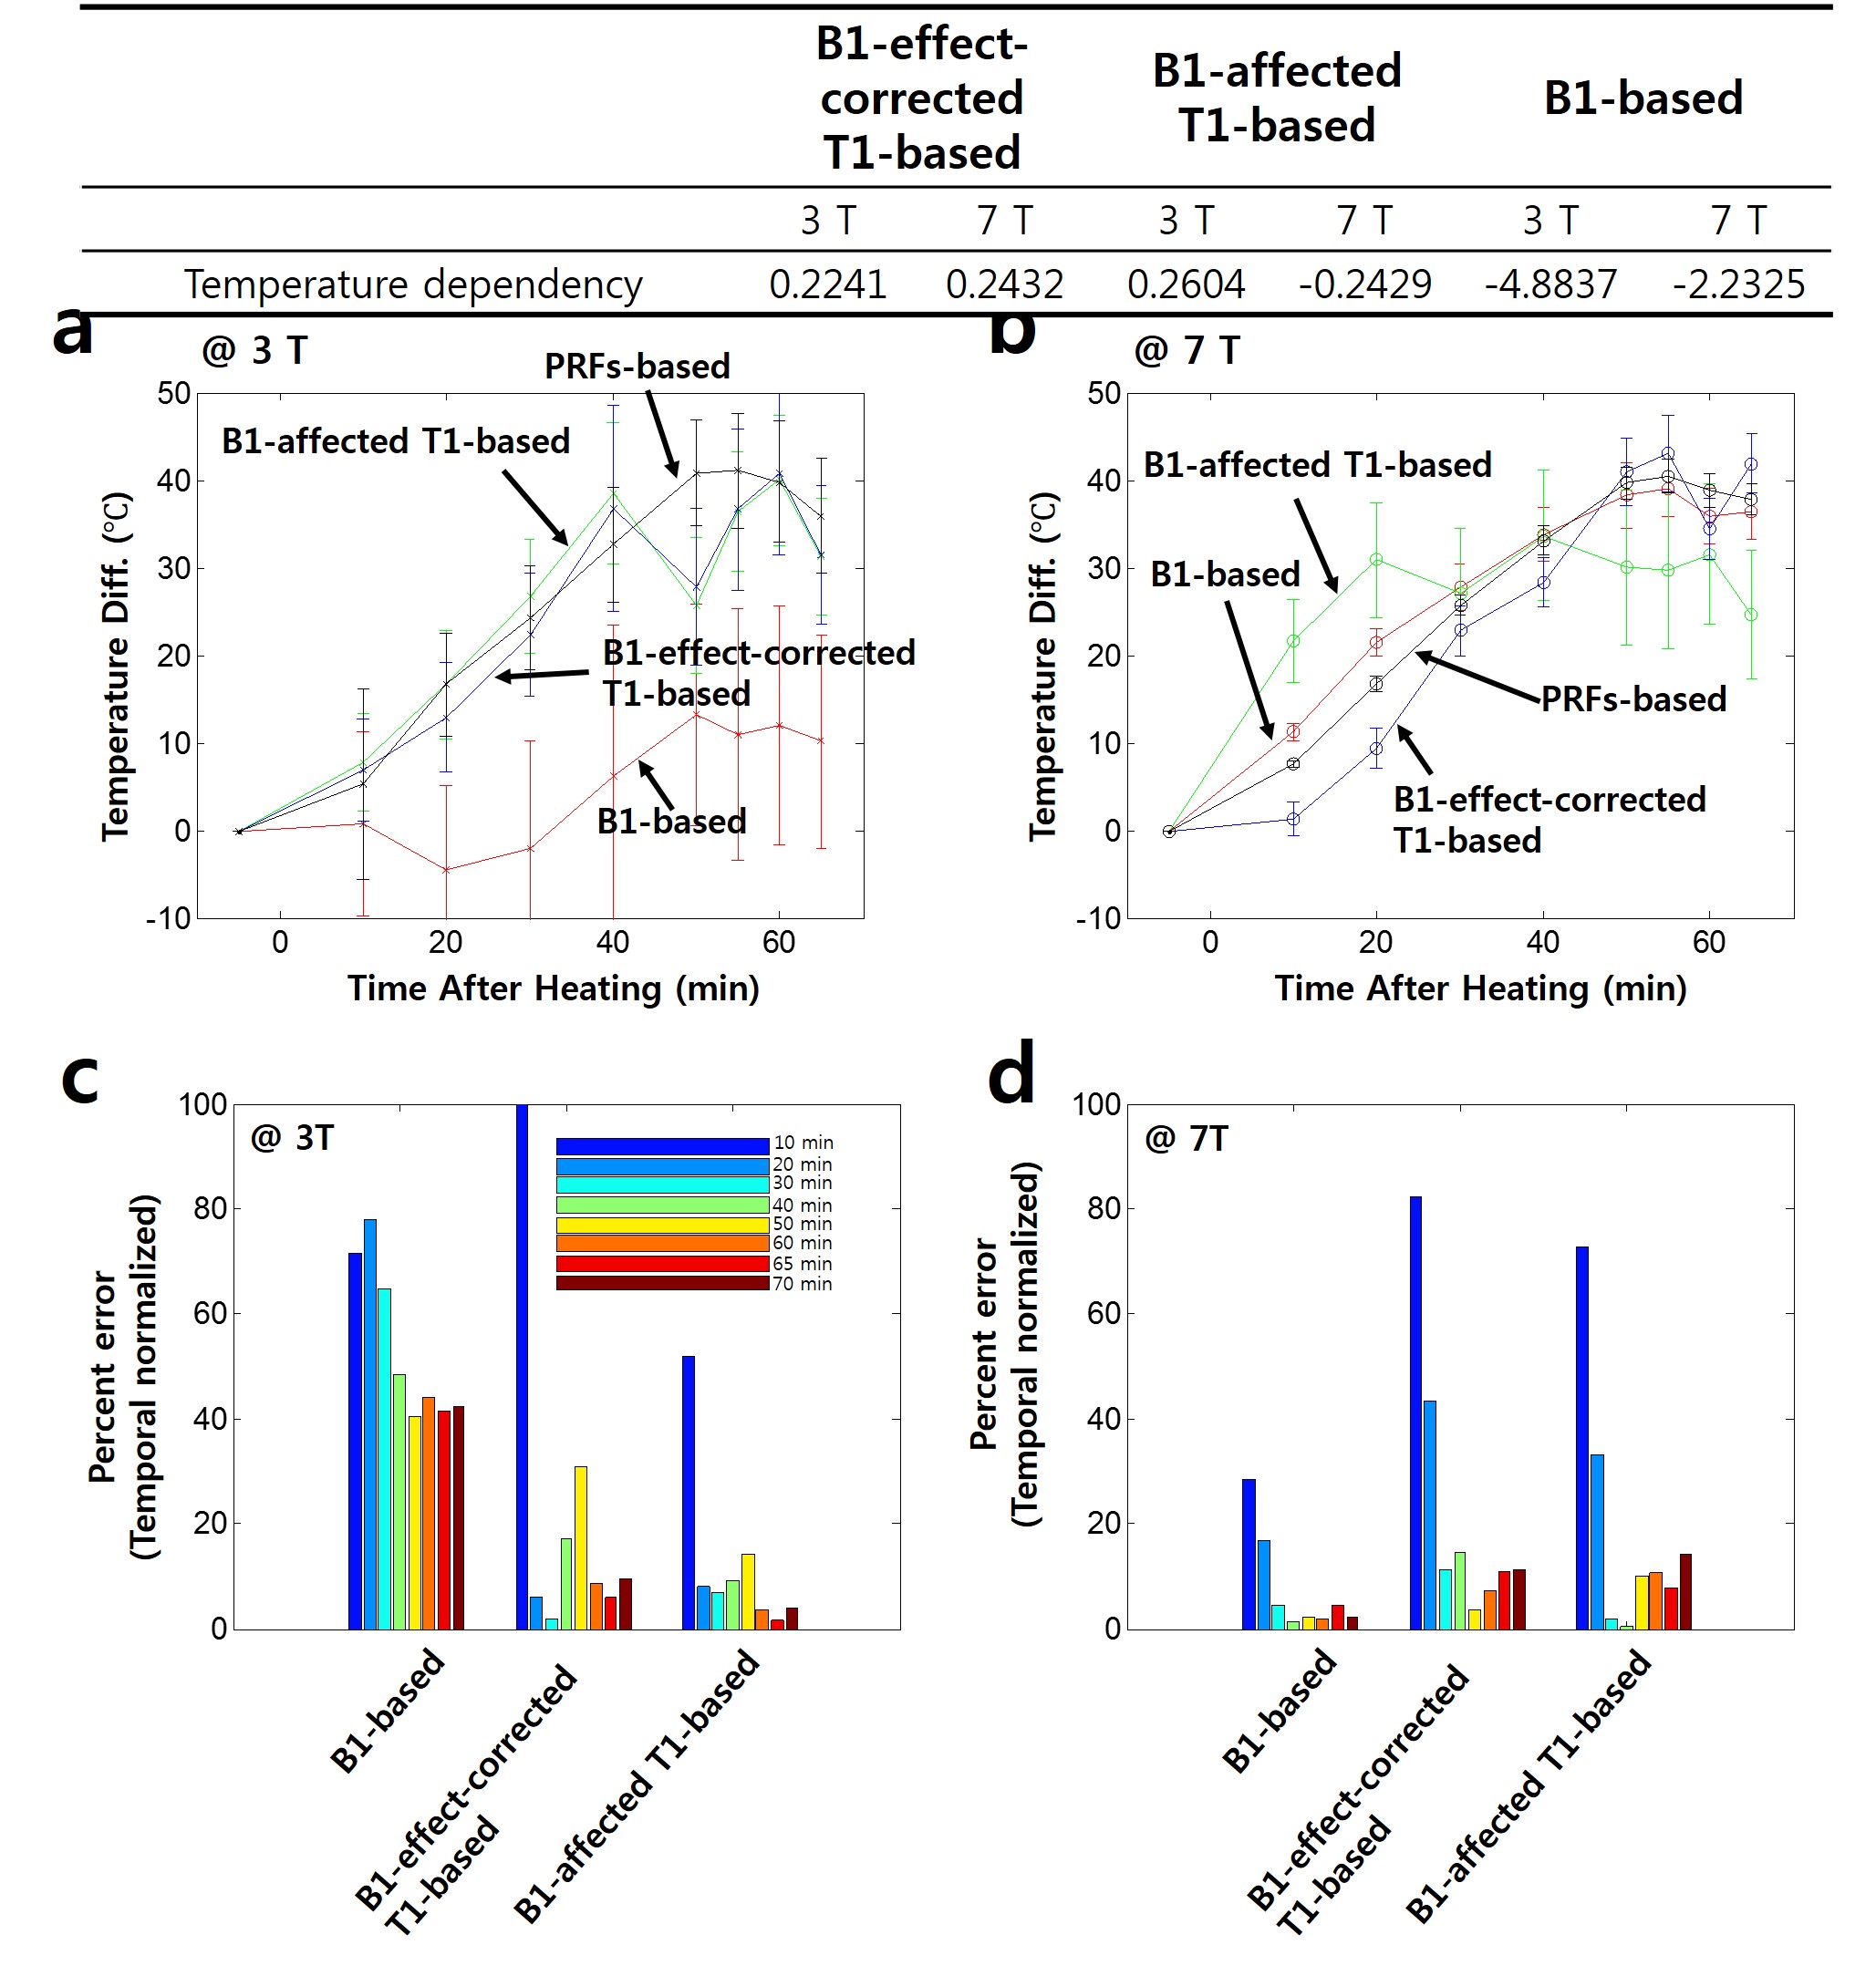
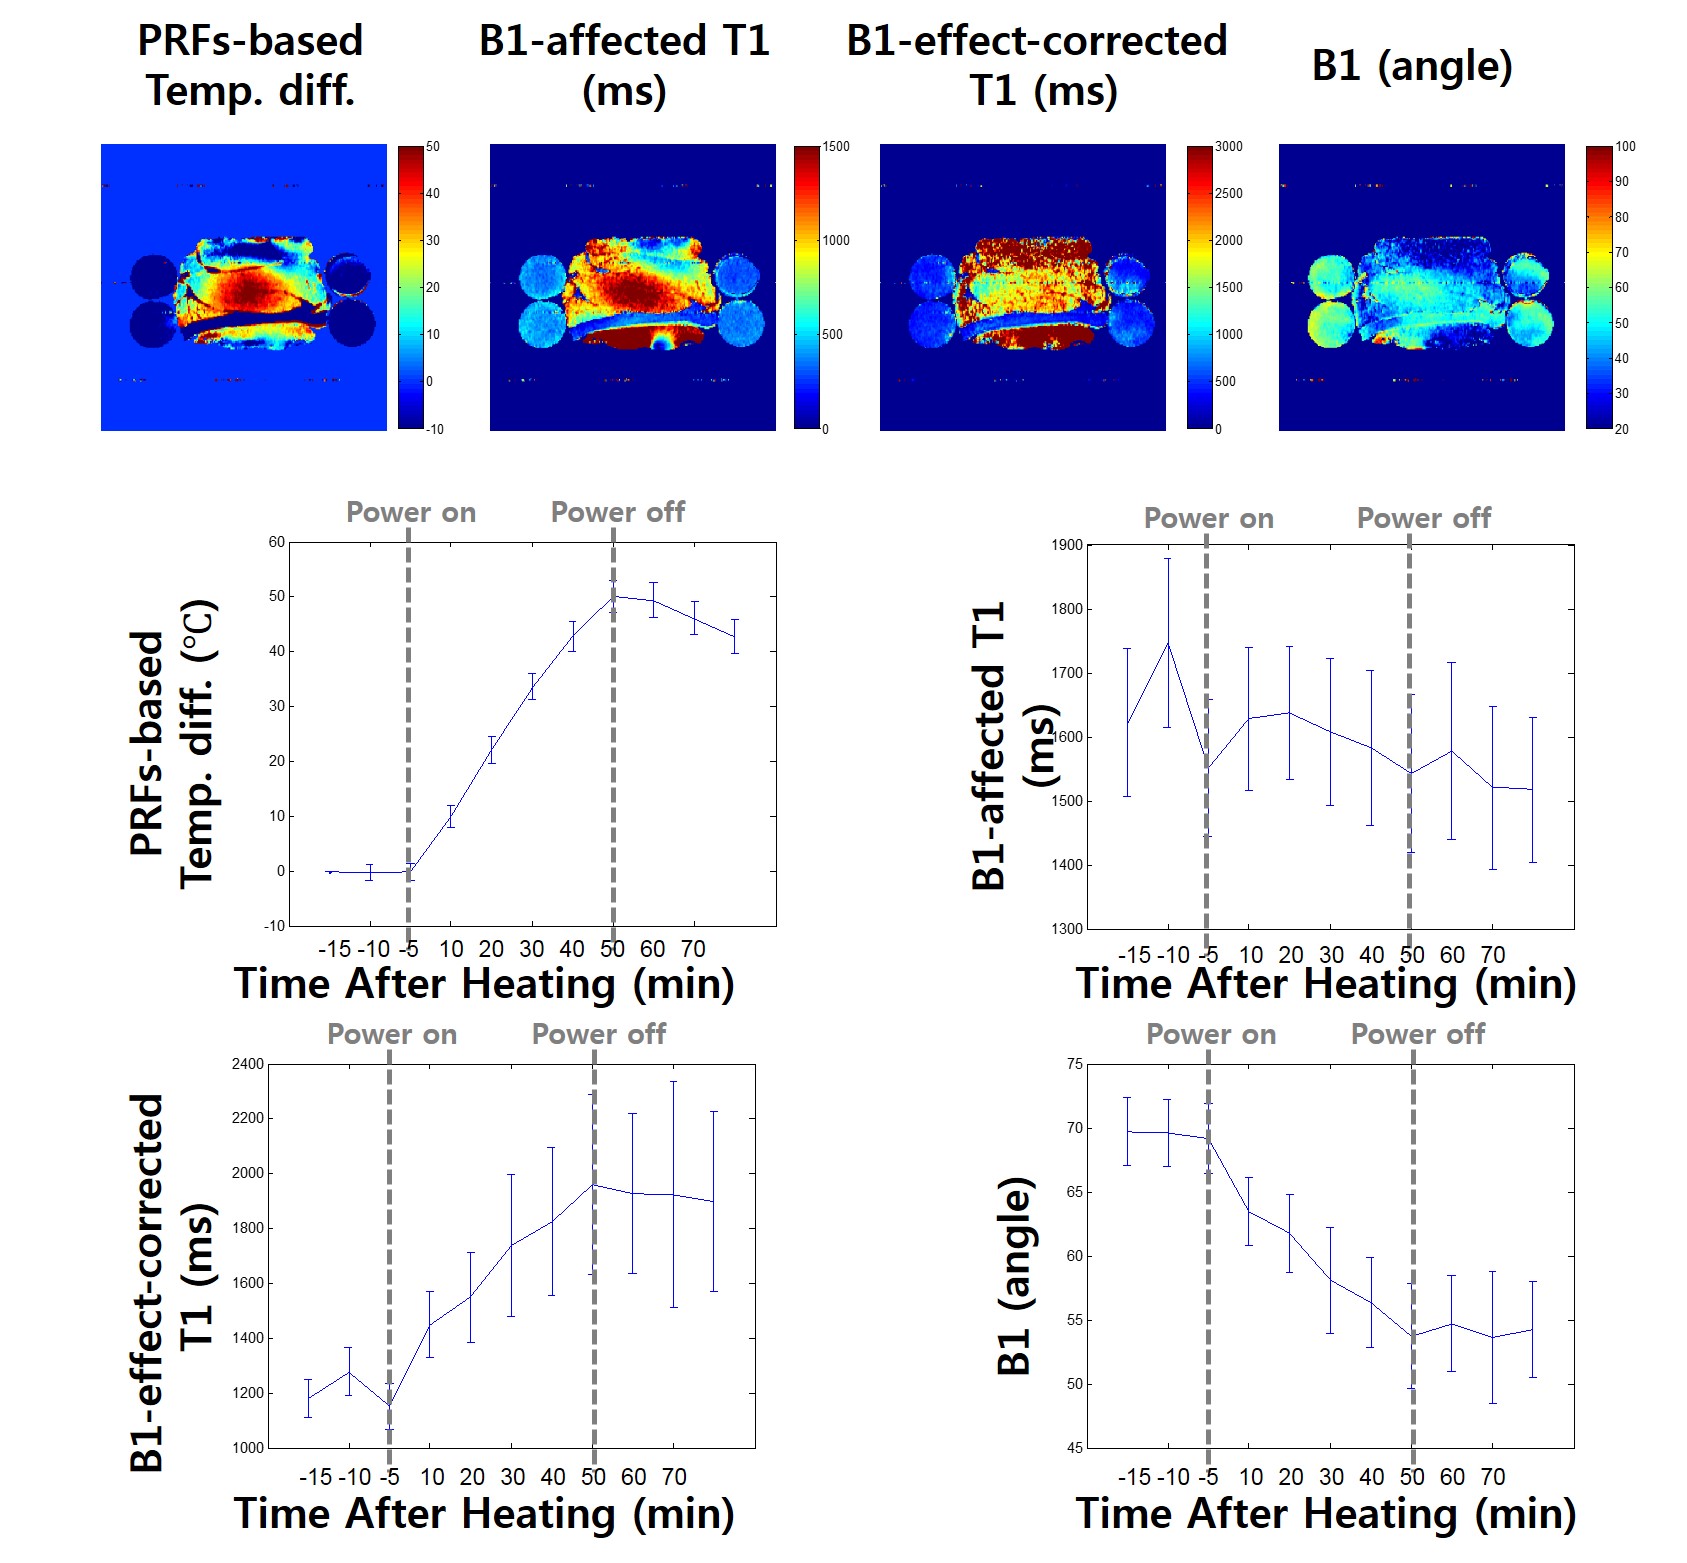
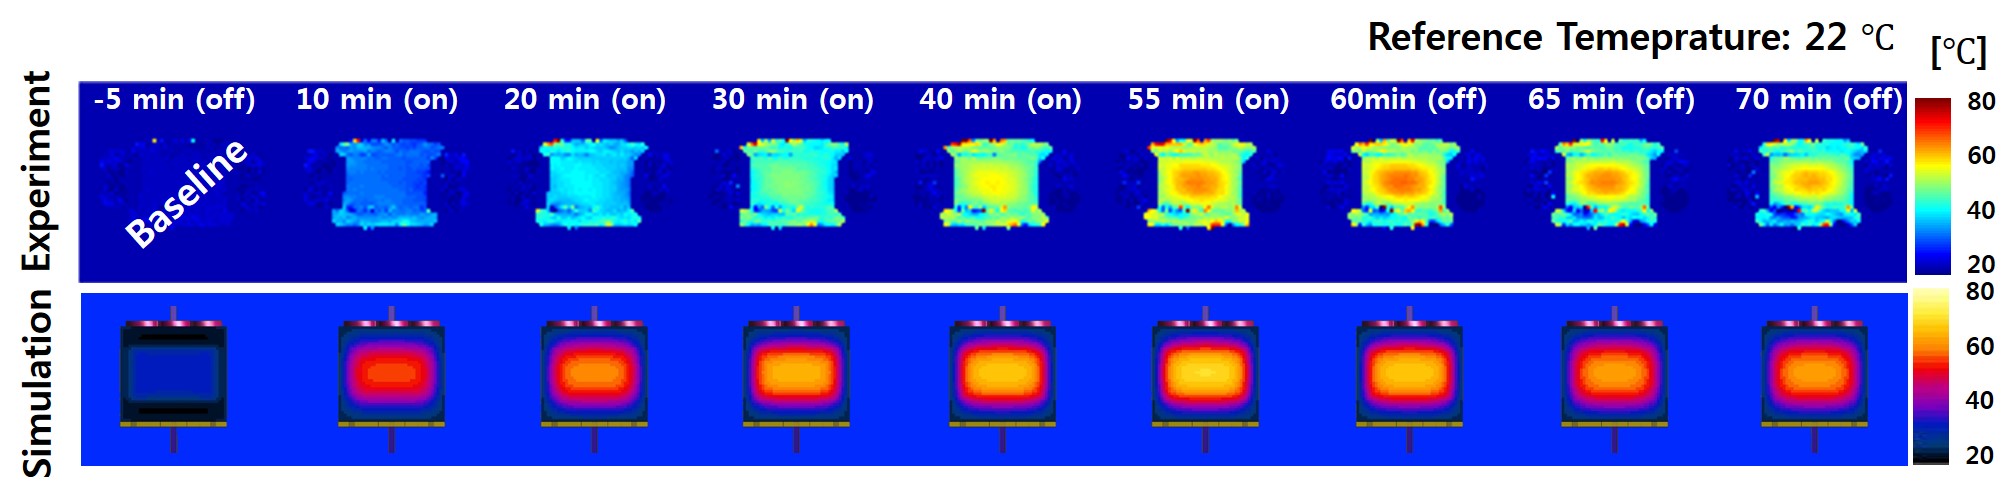
Figure 1 shows the examples of the B1aT1, B1ecT1, B1 images, and PRF (temperature) map for 7 T and 3 T at 30 minutes after heating. Temperature values within a 10X10 pixel ROI versus the time after the start of the heating are plotted in Fig. 2. Using PRFs-based method, the mean values of temperature change look similar at both 3.0 T and 7.0 T field strengths and SNR obtained by 7.0 T MRI is 5-times higher than that the 3.0 T MRI. But the trend changes for B1aT1 case. The B1aT1 difference values at 3.0 T MRI increase with heating, but those at 7.0 T MRI seem to decrease with heating due to B1 change caused by the conductivity change. The B1 difference values at 3.0 T MRI maintain consistency with heating, but those at 7.0 T MRI seem to decrease with heating. However, the B1ecT1 difference values at both 3.0 T and 7.0 T MRI increase with heating. Temporal normalized errors of temperature map using B1aT1, B1, and B1ecT1 with respect to temperature map using PRFs-based method are reported in Fig 3. Temporal normalized error of B1-based method is lower than that of B1aT1-based and B1ecT1-based method. Figure 4 shows the experimental results using the swine tissue. In this result, B1aT1 change according to the temperature change is unclear. But B1ecT1 and B1 values have significant changes during temperature change. To verify the experimental result, thermal and EM simulation was performed (Fig. 5)[6]. Root-mean-square-error between simulation and experimental result was 2.589 oC .Discussion and Conclusions
This work compares the temperature mapping using the PRFs-based, B1aT1-based, and B1ecT1-based method at both 7.0 T and 3.0 T MRI and proposes the temperature mapping using B1-based method or B1ecT1-based method at 7.0 T MRI. While the temperature accuracy is better with the 7.0 T MRI, the temperature maps using B1aT1-based method were more sensitive to the σ change in 7.0 T MRI. Therefore, B1 correction is needed for B1aT1-based temperature mapping. By exploiting the conductivity sensitivity of B1, conductivity mapping may also be achieved in 7.0 T MRI.Acknowledgements
This research were supported by the Korea Basic Science Institute under the R&D program (Project No. D36700) supervised by the Ministry of Science, ICT, and Future Planning and the MEST-BMBF University Cooperation Programme: NRF-2012K1A3A1A24025536.References
[1] Schwan, H. P. and Kay, C. F. The conductivity of living tissues. Annals of the New York Academy of Sciences. 1957; 65(6):1007-1013.
[2] Cheng, H. L. M. and Wright, G. A. Rapid high resolution T1 mapping by variable flip angles: accurate and precise measurements in the presence of radiofrequency field inhomogeneity. Magnetic Resonance in Medicine. 2006; 55(3):566-574.
[3] Rieke, V. and Butts, P. K. MR thermometry. Journal of Magnetic Resonance Imaging. 2008; 27(2):376-390.
[4] Kim, H. J. et al. MR compatible electrode for RF hyperthermia with capacitive coupling: feasibility demonstration. ISMRM. 2015; 1644.
[5] Yarnykh, V. L. Actual flip angle imaging in the pulsed steady state: a method for rapid three-dimensional mapping of the transmitted radiofrequency field. Magnetic Resonance in Medicine. 2007; 57(1):192-200. [6] Kim, H. J. et al. Experimental study of MR compatible RF hyperthermia system. ISMRM. 2016; 3590.
Figures