2580
Reproducibility and Age dependence of GluCEST contrast in healthy adults1CMROI, Radiology, Perelman School of Medicine at The University of Pennsylvania, Philadelphia, PA, United States, 2Psychiatry, Perelman School of Medicine at The University of Pennsylvania, Philadelphia, PA, United States, 3Obstetrics and Gynecology, Perelman School of Medicine at The University of Pennsylvania, Philadelphia, PA
Synopsis
In this study we employed the single-slice 2D glutamateCEST (GluCEST) MRI to measure the reproducibility as well as changes in GluCEST with age in healthy human brains. GluCEST MRI appears to be a promising technique that can characterize neuronal changes in normal aging.
INTRODUCTION
Glutamate, an excitatory neurotransmitter, plays an important role in regulating the various cognitive and motor functions, many of which are affected during normal aging1-3. In addition, glutamate excitotoxicity is also implicated in various age-related neurological conditions such as Parkinson’s, and Alzheimer’s disease4,5. Thus, there is growing interest in monitoring changes in glutamate that may allow for earlier therapeutic intervention. To date, the vast majority of studies measuring age-related changes in glutamate have employed single-voxel 1H MRS at field strengths 4.0T or less6-8, and have limitation due to severe overlap of glutamine resonances with glutamate along with the macromolecules. Recent studies have demonstrated that glutamate can be measured with higher sensitivity and at higher-resolution with GluCEST at 7.0T9-12. Here, we employed GluCEST imaging to measure the reproducibility as well as changes in glutamate with different age groups of healthy human subjects.METHODS
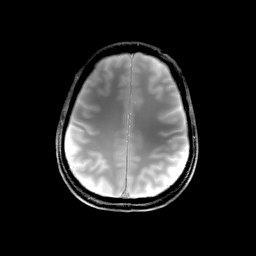
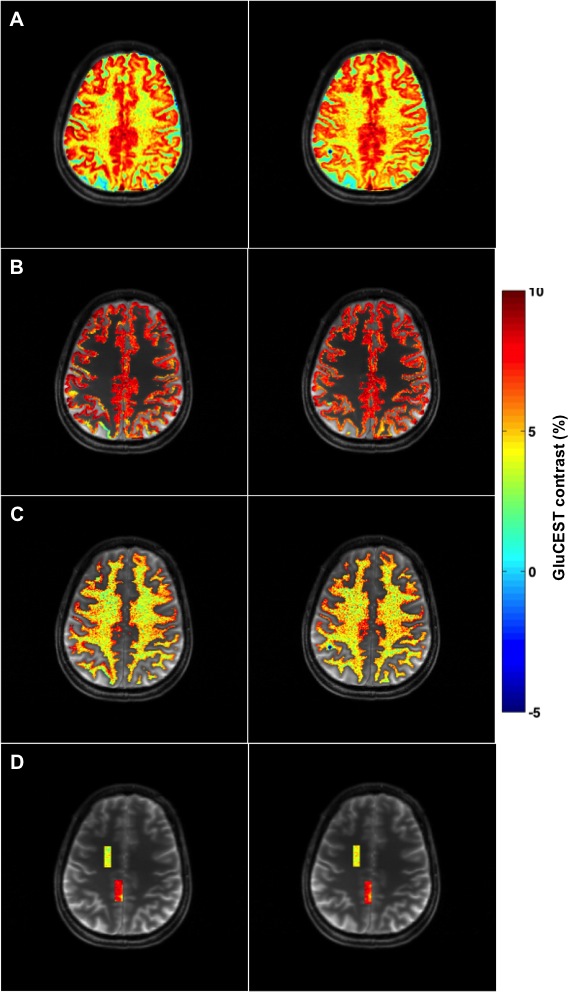
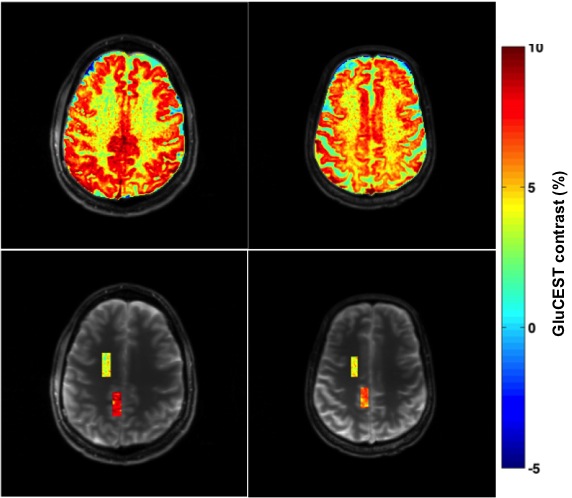
Seven healthy volunteers (aged 26,32,37,45,62,66Y males and 52Y female), participated in the approved IRB study. GluCEST MRI was acquired twice on each volunteer using a 7.0T Siemens scanner with a 32-Channel phased-array head coil. The duration between first and second scan varied from the same day to about a month. For the reproducibility study, we have used imscribe software (accessible at: cmroi.med.upenn.edu/imscribe) to maintain the identical slice location for both GluCEST acquisitions. The study protocol consisted of the following steps: a localizer, T1-weighted MPRAGE images of whole brain followed by single slice 2D GluCEST. For 2D GluCEST, an axial slice was selected as shown in Figure 1 and imaging parameters were: slice thickness = 5mm, in-plane resolution = 1x1mm2, matrix size = 256x256, GRE read out TR = 7.4ms, TE = 3.5ms, number of averages = 2, shotTR = 8000ms, shots per slice = 1, with a saturation pulse at a B1rms of 3.06μT with 800ms duration. Raw CEST images were acquired at varying saturation offset frequencies from ±1.8 to ±4.2ppm (relative to water resonance set as 0ppm) with a step-size of ±0.2ppm. WASSR images (from ±0 to ±1.2ppm with a step-size of ±0.1ppm) with a saturation-pulse at B1rms of 0.29μT with 200ms duration were collected to compute B0 map. Relative B1 map was generated from the two images obtained using square preparation pulses with flip-angles 30° and 60°. Overall, acquisition time of CEST images, B0 and B1 field maps is ~12min. The B0B1-corrected GluCEST contrast was then averaged for entire gray matter (GM) and white matter (WM) for reproducibility studies as shown in Figure 2B-C. To measure changes of glutamate with age, the regions-of-interest (ROIs) in Corona radiata (mostly WM) and Precuneus (predominantly GM), as shown in Figure 2D were selected due to minimal B0 and B1 artifacts. For ROI in Precuneus, pixels having WM and CSF were removed before calculating the GluCEST contrast.RESULTS
GluCEST maps were highly reproducible (CoV <5%) from the two scans of each volunteer for the entire GM and WM brain regions of the acquired slice as shown in Figure 2A-2C. For the ROIs in Precuneus and Corona radiata, as shown in Figure 2D mean GluCEST of all the volunteers from both the scans were 7.12±1.48 and 3.87±0.79%, respectively. The highest GluCEST contrast from ROI in Precuneus was observed in youngest volunteer (8.3±1.3%; 26M) while the lower GluCEST contrast was observed in the oldest volunteer (6.25±1.25%; 66M) as shown in Figure 3, whereas, the volunteers aged from 32-52Y exhibited intermediate GluCEST contrast (6.9±1.53%). For ROI in Corona radiata the changes observed in GluCEST contrast were much smaller and did not follow any specific trend (4.3±0.7% for oldest volunteer; 3.6±0.87% for volunteers aged 32-52Y and 4.05±0.9% for youngest volunteer).DISCUSSION
Our study shows high degree of reproducibility (CoV <5%) of GluCEST maps in each individual. Also, our preliminary analysis of GluCEST maps shows a negative correlation of glutamate with age for ROI in Precuneus where as for the ROI in Corona radiata, only small differences were observed. In addition the length of the time lag between the two scans is not significantly affecting the GluCEST contrast. In future studies we will extend this technique to larger, more diverse samples (including both female & male) and measure GluCEST contrast from additional subcortical brain regions known to be affected in aging and age-related disorders.CONCLUSIONS
This preliminary study demonstrates that GluCEST MRI is
highly reproducible (CoV <5%) and shows a promise for measuring the age-dependent
changes in brain glutamate. This method may be helpful to differentiate normal
changes in brain glutamate associated with normal aging from those declines
relevant for neurodegenerative disorders.Acknowledgements
This project was supported by the National Institute of Biomedical Imaging and Bioengineering of the National Institutes of Health through Grant Number P41-EB015893 and the National Institute of Neurological Disorders and Stroke through Award Number R01NS087516 and 1R01DA037289-02.References
1. Jolles J. Cognitive, emotional and behavioral dysfunctions in aging and dementia. In: Progress of brain research. Aging of the brain and Alzheimer’s disease. Elsevier Science Publishers, Amsterdam 1986;70:15-39.
2. Cotman CW, Monaghan DT, Ottersen OP, et al. Anatomical organization of excitatory amino acid receptors and their pathways. Trends Neurosci 1987;10(7):273-280.
3. Schmidt WJ, Bubser M, Hauber W. Behavioural pharmacology of glutamate in the basal ganglia. J Neural Transm 1992;38:65-89.
4. Blandini F, Greenamyre JT. Protective and symptomatic strategies for therapy of Parkinson’s disease. Drugs Today (Barc) 1999;35(6):473-483.
5. Michaelis ML. Drugs targeting Alzheimer’s disease:some things old and some things new. J Pharmacol Exp Ther 2003;304(3):897-904.
6. Kaiser LG, Schuff N, Cashdollar N, et al. Age-related glutamate and glutamine concentration changes in normal human brain:1H MR spectroscopy study at 4T. Neurobiology of Aging 2005;26(5):665-672.
7. Gruber S, Pinker K, Riederer F, et al. Metabolic changes in the normal ageing brain: consistent findings from short and long echo time proton spectroscopy. Eur J Radiol 2008;68(2):320-327.
8. Sailasuta N, Ernst T, Chang L. Regional variations and the effects of age and gender on glutamate concentrations in the human brain. Magn Reson Imaging 2008;26(5):667-675.
9. Cai K, Haris M, Singh A, et al. Magnetic resonance imaging of glutamate. Nat Med 2012;18(2):302-306.
10. Cai K, Singh A, Roalf DR, et al. Mapping glutamate in subcortical brain structures using high-resolution GluCEST MRI. NMR Biomed 2013;26(10):1278-1284.
11. Kogan F, Singh A, Debrosse C, et al. Imaging of glutamate in the spinal cord using GluCEST. Neuroimage 2013;77:262-267.
12. Davis KA, Nanga RP, Das S, et al. Glutamate imaging (GluCEST) lateralizes epileptic foci in nonlesional temporal lobe epilepsy. Sci Transl Med 2015;7(309):309ra161.
Figures