2578
Myelin Density Measurement by ZTE in the D2O-Exchanged Spinal Cord is Unaffected by Tissue Fixation1Translational and Molecular Imaging Institute, Icahn School of Medicine at Mount Sinai, New York, NY, United States, 2Department of Radiology, Icahn School of Medicine at Mount Sinai, New York, NY, United States, 3Graduate School of Biomedical Sciences, Icahn School of Medicine at Mount Sinai, New York, NY, United States, 4Department of Pathology, Icahn School of Medicine at Mount Sinai, New York, NY, United States, 5Department of Neuroscience, Icahn School of Medicine at Mount Sinai, New York, NY, United States
Synopsis
Zero echo time imaging (ZTE) of deuterium oxide (D2O)-exchanged unfixed white matter is a proven method for measurement of myelin density. In this work, we perform D2O-exchanged ZTE measurements on human spinal cord tissue before and after formalin fixation to assess whether fixation, which cross-links proteins, impacts the measured myelin density. A segment of human spinal cord was obtained at autopsy, subjected to D2O-exchanged ZTE myelin density measurement, chemically fixed using formalin, and re-measured. Signal intensity was 31.36%, normalized to a reference, before fixation, and 31.44% after fixation. These similar measurements support this method’s accuracy in fixed tissue.
Introduction
Zero echo time imaging (ZTE) of deuterium oxide (D2O)-exchanged central nervous system (CNS) white matter tissue is a proven method for measurement of myelin density1,2. Tissue water is replaced by deuterium oxide, which is chemically similar but NMR-invisible at the 1H Larmor frequency. The remaining 1H signal belongs to non-exchangeable 1H in proteins and lipids, the latter of which predominates and originates primarily from myelin3. Due to myelin’s liquid crystalline structure, these molecules are highly immobile. The resulting short T2 renders myelin 1H visible only using solid-state imaging pulse sequences2. The correspondence of signal intensity to myelin density, however, has so far been confirmed only in unfixed tissue. Commonly used fixatives, such as formalin, form cross-links between proteins4,5 and, as a consequence, decrease the T1 and T2 of tissue water6,7 and enhance the magnetization transfer effect7. Although these observations primarily concern water 1H signal, which is removed by D2O-exchange, it is nevertheless reasonable to question whether the correspondence of D2O-exchanged ZTE signal intensity to myelin is preserved in fixed tissue. To answer this question, we performed D2O-exchanged ZTE imaging measurements on human spinal cord tissue before and after formalin fixation.Methods
Specimen: One 9-mm segment of unfixed, unfrozen human spinal cord was obtained at autopsy. The segment, having a volume of approximately 0.7 mL, was placed in a sealed tube containing 15 mL (>20-fold volume excess) of D2O-saline for 41 hours, and changed to a second sealed tube containing another 15 mL of D2O-saline for an additional 28 hours. This procedure results in >99.7% of H2O being exchanged for D2O (calculated as 1 – (20 + 1)-2, under the conservative assumption of 100% water density in the tissue).
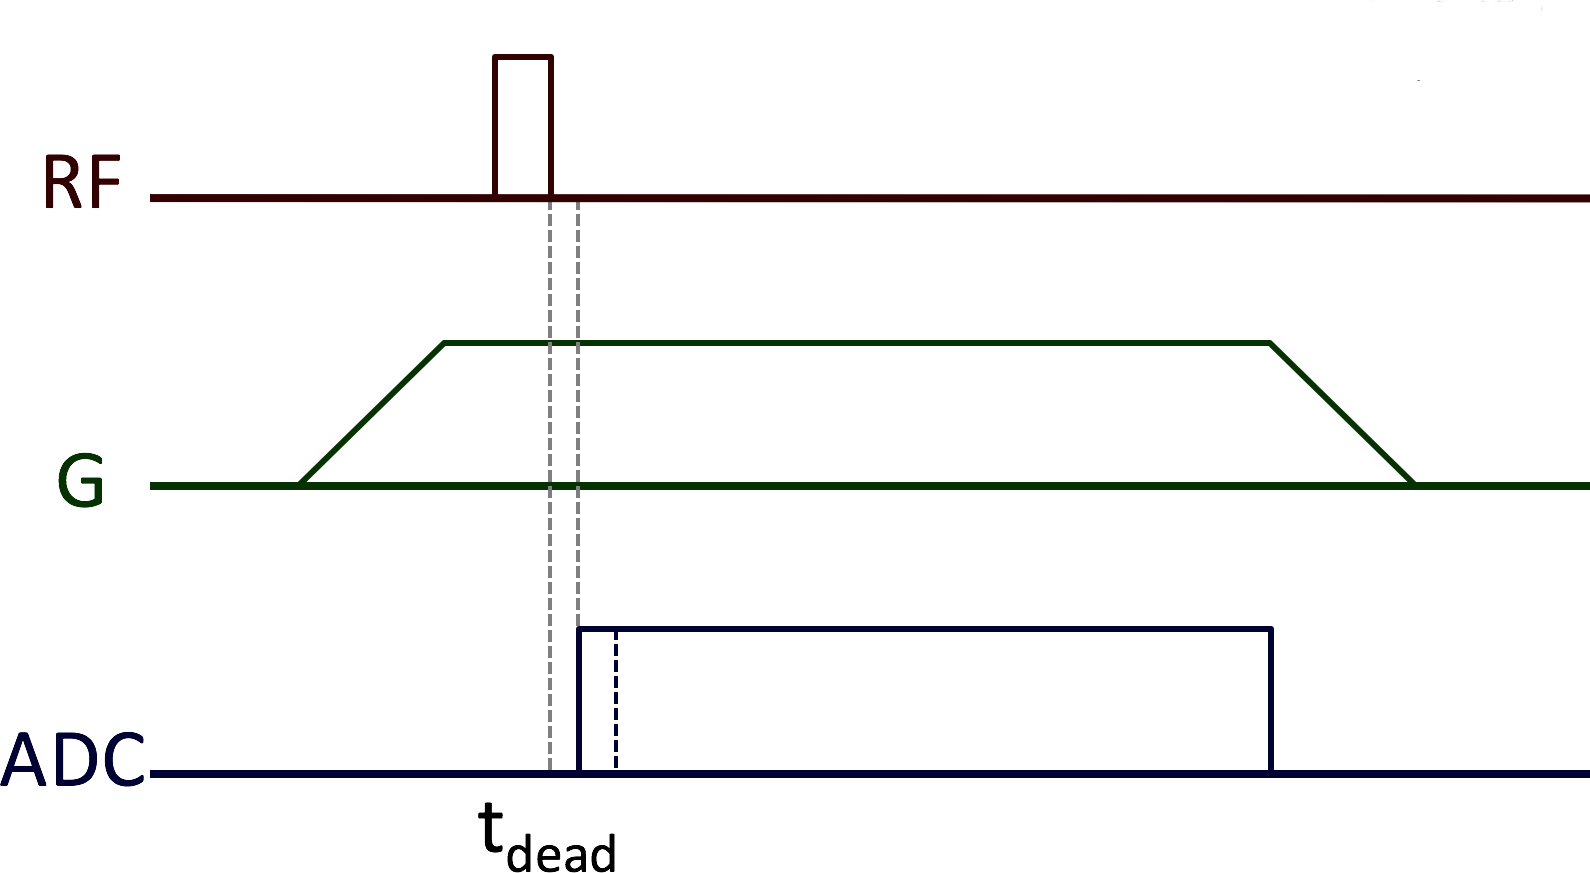
MRI: Following D2O exchange, the specimen was placed next to a block of rubber (intensity reference) in a glass vial and scanned in a 9.4 T Bruker Avance III HD micro-imaging system equipped with 1000 mT/m gradients and a 40-mm birdcage RF probe (Rapid Biomedical, Rimpar, Germany). The product ZTE imaging protocol (Figure 1) was used, with the following parameters: TR = 1 ms, flip angle = 2.1°, pulse duration = 1 µs, excitation BW = 1.28 MHz, transmit/receive dead time = 5.7 µs, dwell time = 1.6 µs, readout BW = 625 kHz, N = 128, readout duration = 204.8 µs, 206,742 projections (fully sampled), 16 signal averages, Gx = Gy = 231 mT/m, Gz = 77 mT/m, FOV = 64x64x192 mm3, voxel resolution = 250x250x750 µm3, scan time = 55 min 8 s.
Fixation: After pre-fixation MRI scanning, the specimen was placed in 20 mL of 10% neutral buffered formalin for 26 hours, sufficient time for the solution to adequately penetrate and fix this small tissue specimen. Following fixation, D2O-exchange and scanning were repeated exactly using the exchange and MRI protocols described above.
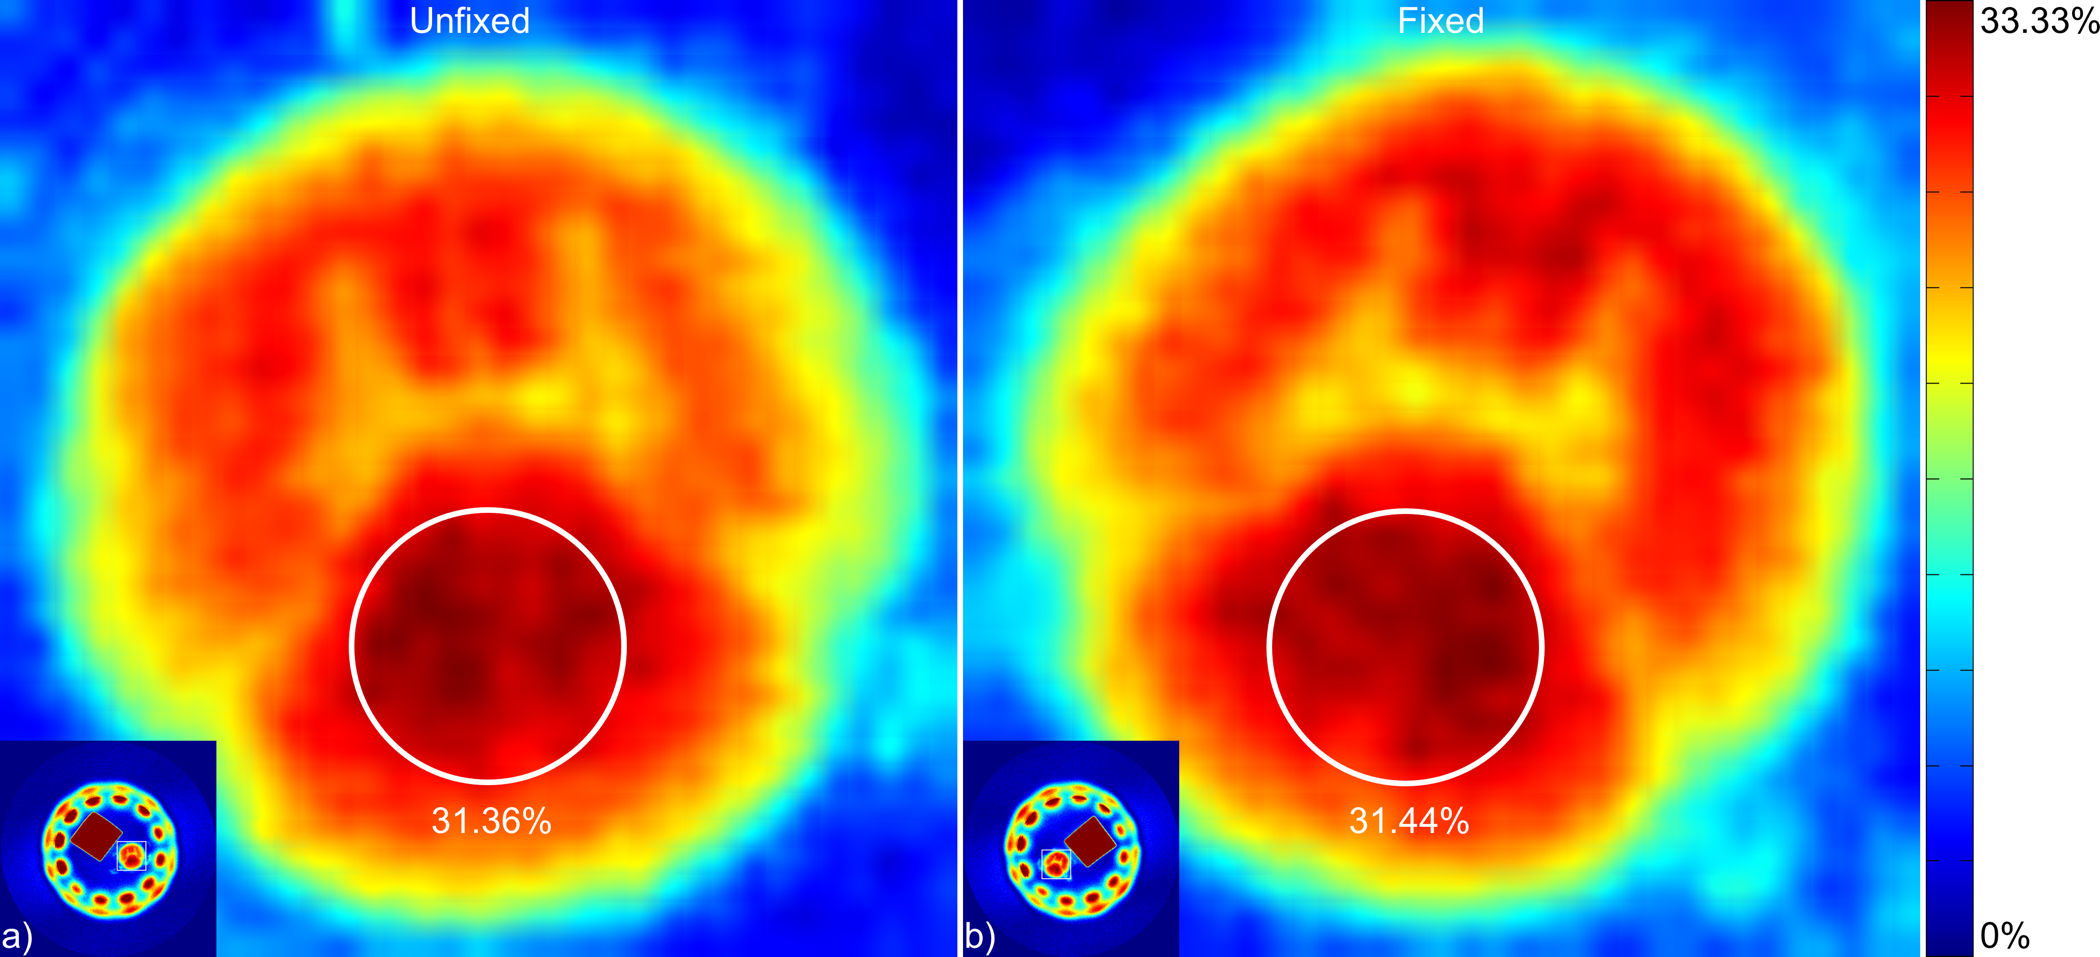
Analysis: SNR was calculated as the ratio of mean signal in the dorsal column white matter to mean background noise outside the coil. Signal intensity was normalized to the intensity in the rubber reference specimen and reported as a percentage of the reference intensity in an axial slice through the middle of the spinal cord segment.
Results
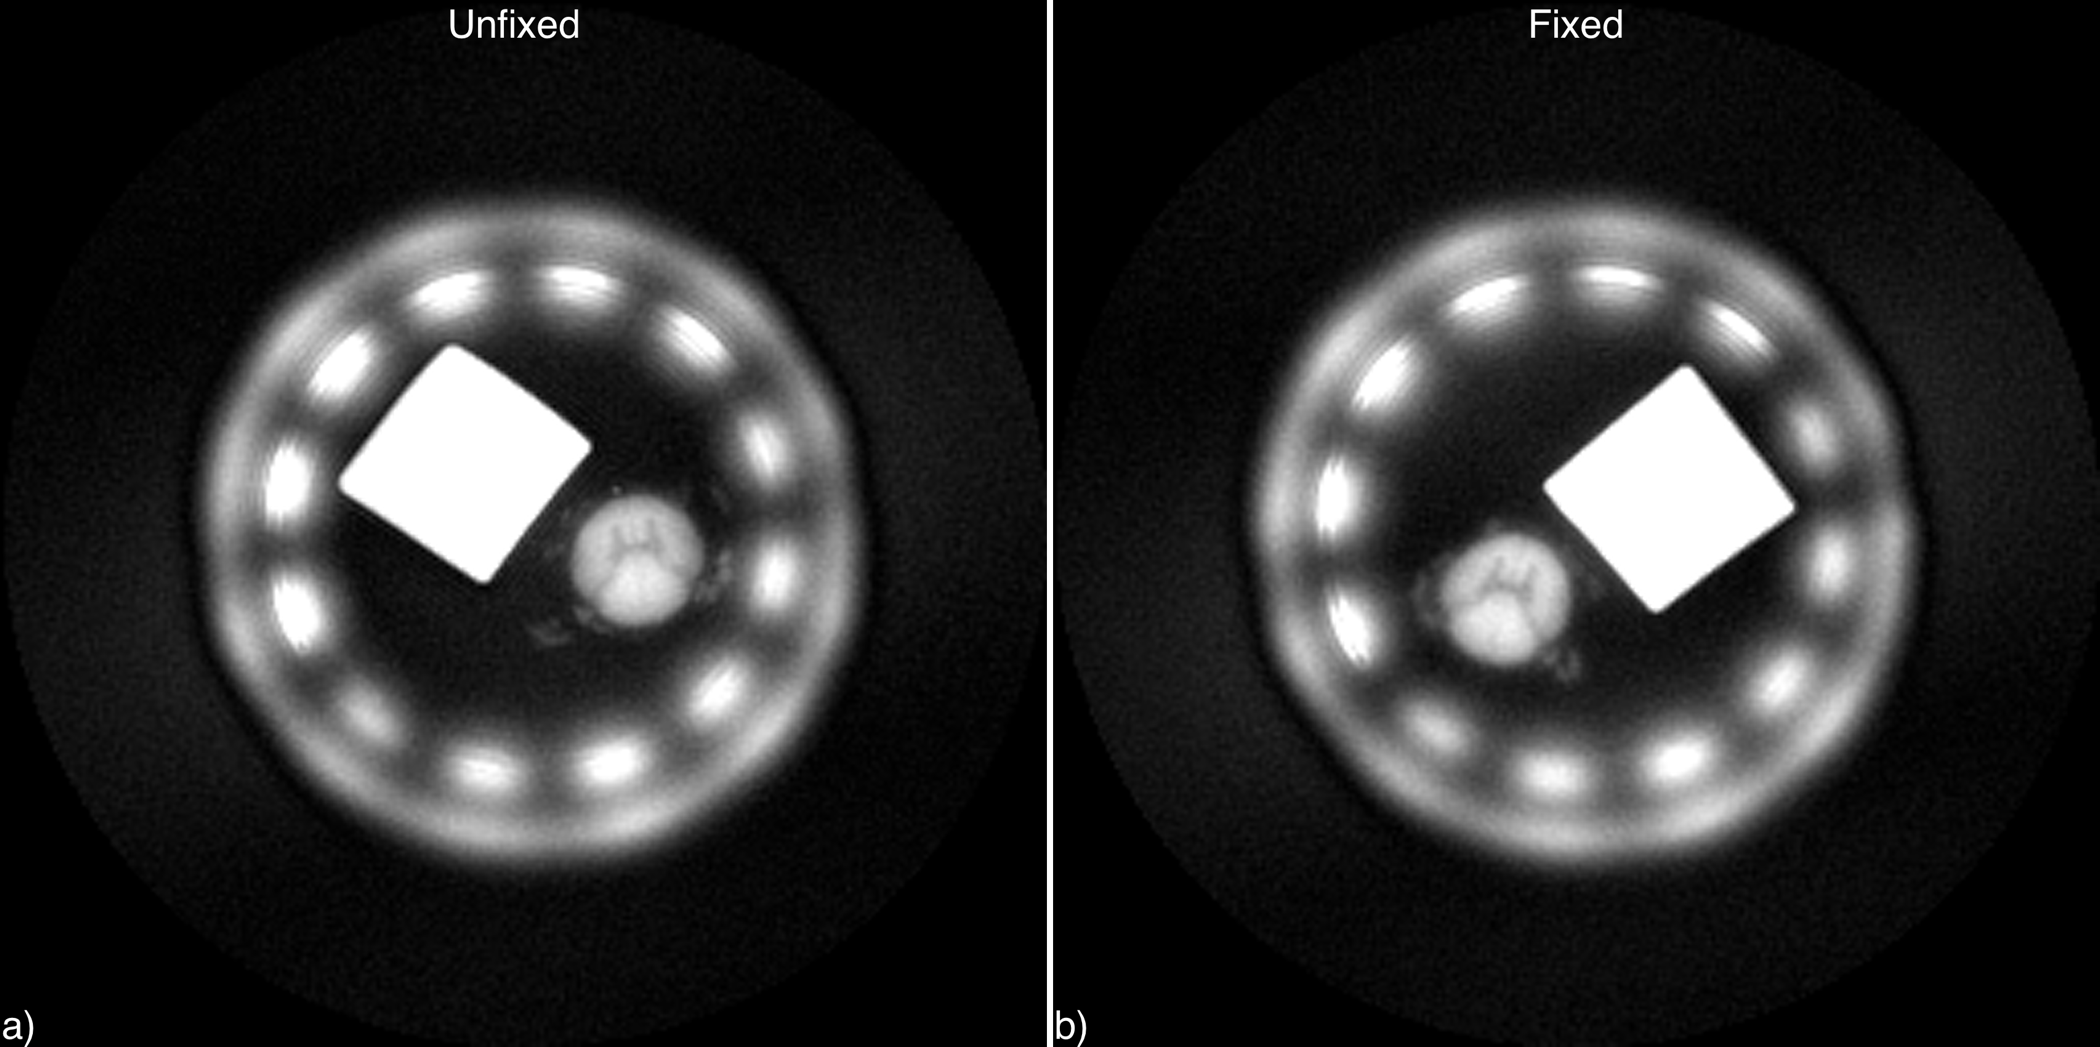
Raw images are shown in Figure 2. SNR in the dorsal column white matter was 46 before fixation and 45 after fixation. Signal intensity in the circular ROI in Figure 3 was 31.36% of reference intensity before fixation and 31.44% after fixation. Gray-white matter contrast is preserved (75% before fixation, 73% after fixation), and no increase in image blurring is evident.Discussion and Conclusions
Signal intensity in formalin-fixed D2O-exchanged spinal cord white matter differs only by 0.3% from signal intensity in unfixed D2O-exchanged white matter, which is known to correspond to myelin density. The consistency of these measurements is compelling evidence that the correspondence of ZTE signal intensity to myelin density in white matter after D2O exchange is not altered by formalin fixation. Although fixation cross-links proteins in tissue, these proteins exist and contribute detectable short-T2 signal in unfixed tissue as well2. Furthermore, myelin contains 30% protein by weight8, and these proteins comprise a significant portion of total white matter protein signal. Further experiments in a larger number of specimens and at an array of fixation times (ranging from hours to weeks), accompanied by spectroscopy and relaxometry, would enhance the soundness of this conclusion.Acknowledgements
No acknowledgement found.References
[1] Li C, Seifert AC, Wehrli SL, et al. Quantification of Myelin by Solid-State MRI of the Lipid Matrix Protons. Proc. ISMRM 2016, Abstract 1276.
[2] Wilhelm MJ, Ong HH, Wehrli SL, et al. Direct magnetic resonance detection of myelin and prospects for quantitative imaging of myelin density. PNAS 2012;109:9605-9610.
[3] Norton WT, Cammer W. “Isolation and Characterization of Myelin.” Myelin. New York: Plenum Press, 1984. 147-195.
[4] Puchtler H, Meloan SN. On the chemistry of formaldehyde fixation and its effects on immunohistochemical reactions. Histochemistry 1985;82:201-204.
[5] Metz B, Kersten GF, Hoogerhout P, et al. Identification of formaldehyde-induced modifications in proteins: reactions with model peptides. J Biol Chem 2004;279(8):6235-6243.
[6] Dawe RJ, Bennett DA, Schneider JA, et al. Postmortem MRI of human brain hemispheres: T2 relaxation times during formaldehyde fixation. Magn Res Med 2009;61(4):810-818.
[7] Fishbein KW, Gluzband YA, Kaku M, et al. Effects of formalin fixation and collagen cross-linking on T2 and magnetization transfer in bovine nasal cartilage. Magn Res Med 2007;57:1000-1011.
[8] Morell P, Quarles RH. “Characteristic Composition of Myelin.” Basic Neurochemistry: Molecular, Cellular and Medical Aspects. 6th Edition. Philadelphia: Lippincott-Raven, 1999.
Figures