2577
MRI compatible Set up for Optogenetic Stimulation of Living Brain Slices1Champalimaud Neuroscience Programme, Champalimaud Centre for the Unkown, Lisbon, Portugal
Synopsis
Organotypic slices are excellent controlled systems for investigating neural activity without many of the confounds introduced by in-vivo conditions. Here we describe a new setup that allows imaging of a living slice inside a MRI scanner while being stimulated with optogenetics which induces neuronal activity in pre-targeted neurons. This setup allows the survival of slices for at least three hours, without requiring new artificial CSF (aCSF) to be flushed. This property is highly advantageous for avoiding artifacts related with bubbles, motion or variation of shims during extended acquisitions.
Purpose
Despite its immense utility in mapping brain function, the Blood-Oxygenation-Level-Dependent (BOLD) mechanism is only indirectly related with neuronal activity through complex neurovascular couplings1. In investigating the complex neurovascular – or indeed other fMRI mechanisms – there is a need for delivering precise stimuli to controlled systems. An excellent example for this gap is diffusion fMRI, which has been proposed as a more direct method for detecting neuronal activity2-5, potentially detecting neural activity with faster dynamics and with more spatial specificity compared to BOLD (though n.b., e.g., Ref. 6). Organotypic slices routinely serve as excellent models in neuroscience; while several studies used MRI to study slices stimulated chemically3,6, the advantages afforded by optogenetics open up new ways of probing neural activity. Here we present a set up designed for optogenetic stimulation8,9 of a living brain slice in the MRI scanner.Methods
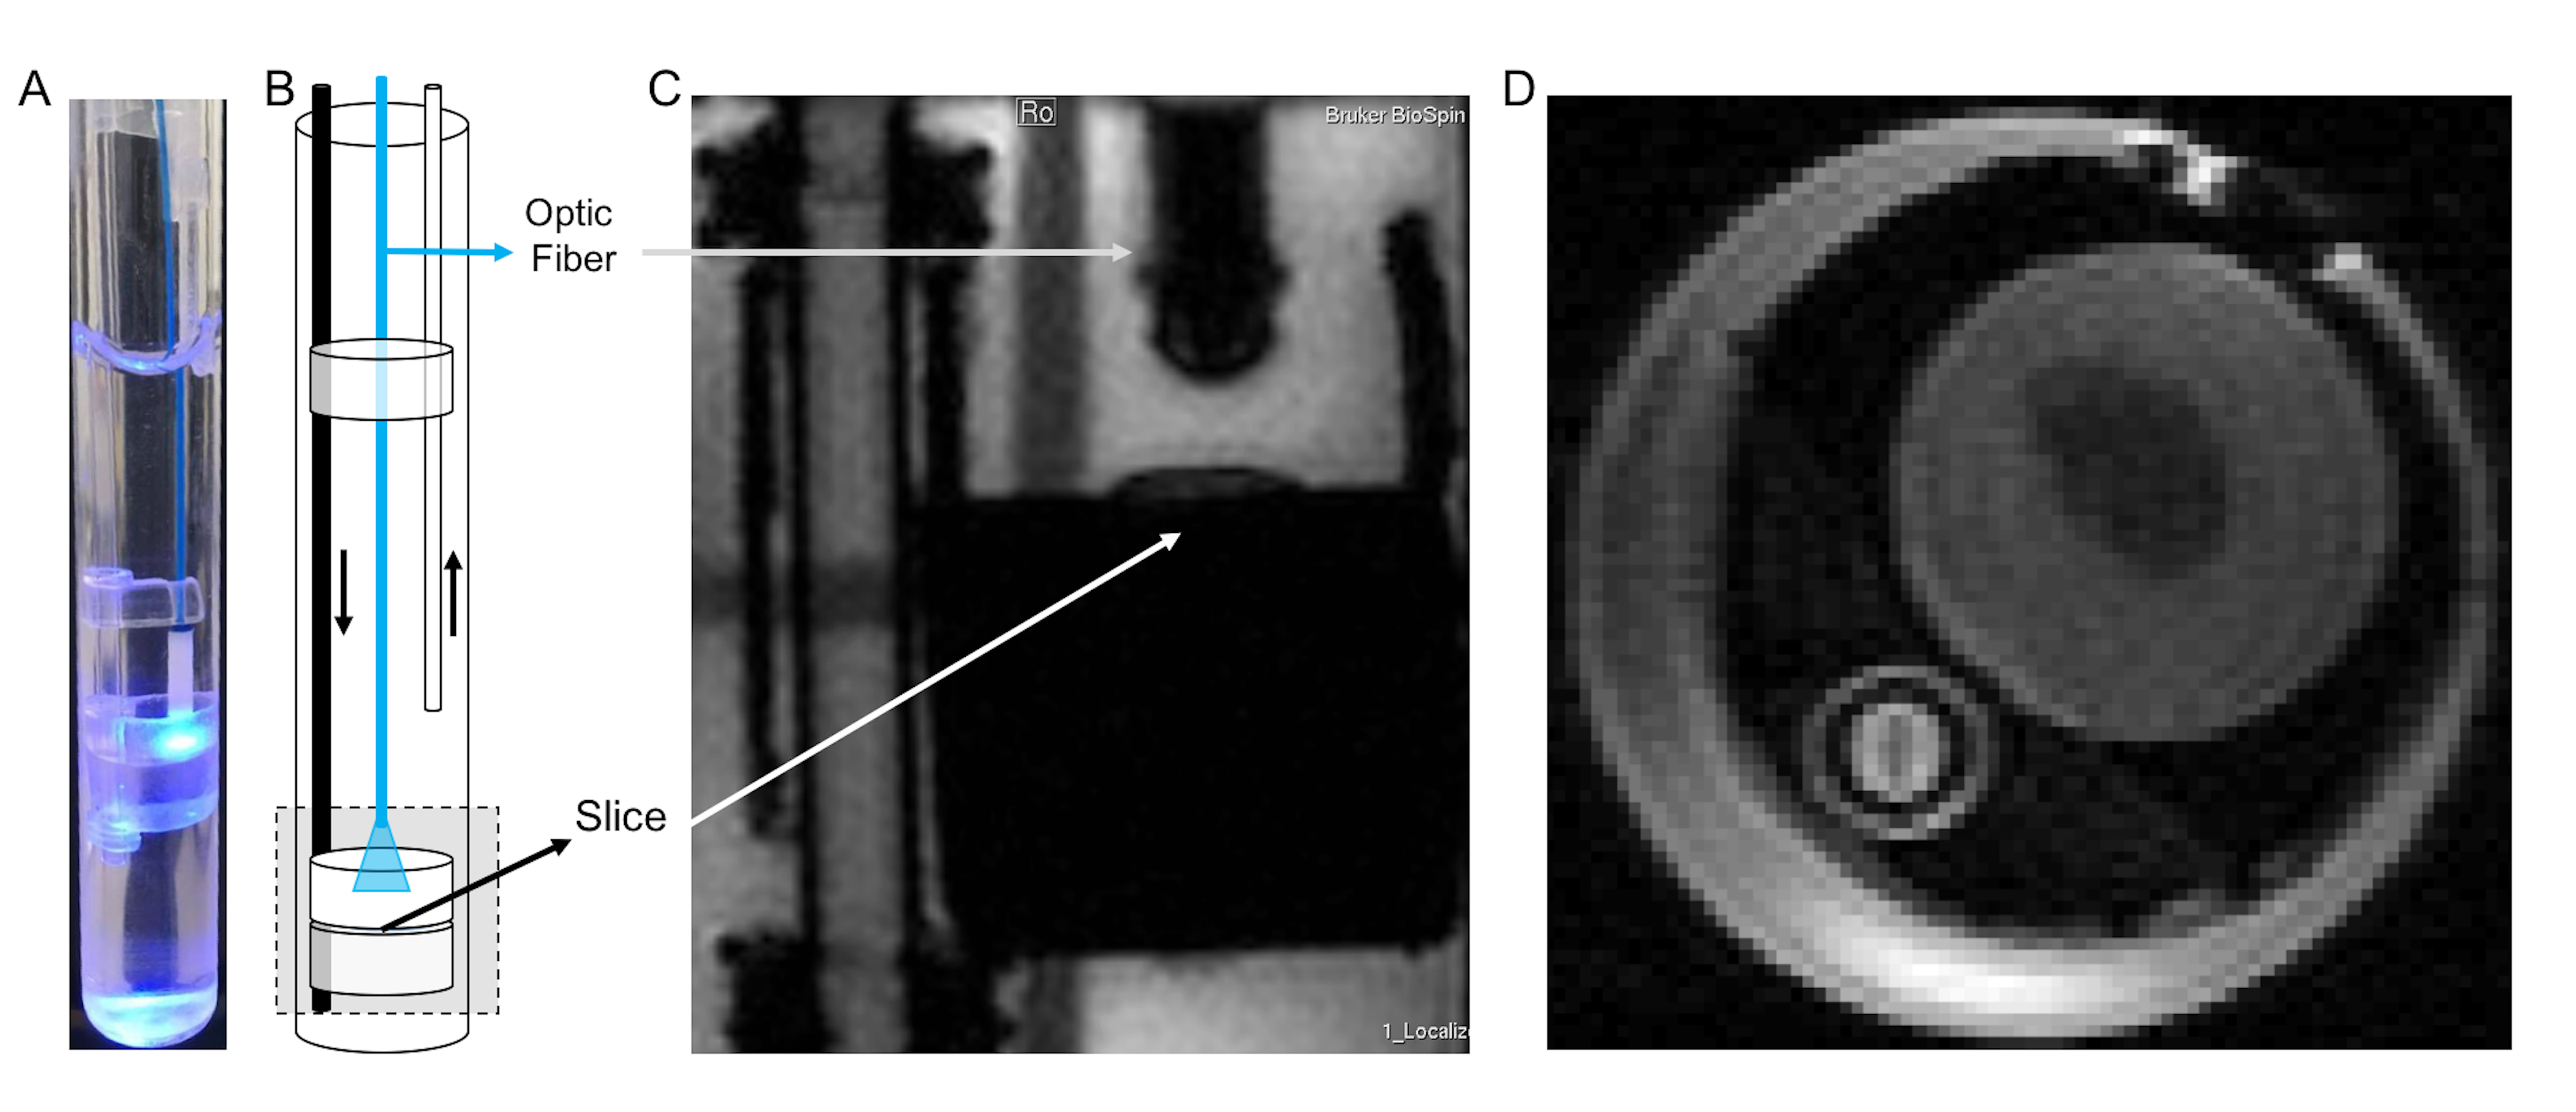
The present custom-built setup (Figure 1), which was loosely based on [10],
has an inflow and outflow lines for artificial CSF flow (aCSF, 127mM NaCl,
2.5mM, KCl, 25mM NaHCO3, 1.25mM NaH2PO4, 25mM D-Glucose, 2mM CaCl2, 1mM MgCl2).
Several round pieces made from Plexiglas® were cut in order to position the brain
slice and hold it in place during acquisition. These round pieces allow the
insertion of an optic fibre which is then held and directed to the slice
through a smaller holder (made from the same material) to avoid gradient
induced motion. This set up was built to fit a 10mm NMR tube. Images can thus
be acquired while a living brain slice is being stimulated optogenetically, ensuring
that both the brain slice and optic fibre are kept in place and the stimulation
induced by light is robust throughout the acquisition.
Organotypic slices were prepared as explained elsewhere11
from C57BL/6 mice. pH measurements described below were performed using a Thermo
Scientific Orion 3 star
pH meter.
All
MRI experiments were performed on a 16.4T Bruker Ascend Aeon MRI scanner, using
a micro5 10mm probe capable of producing up to 300 G/cm in all directions. To
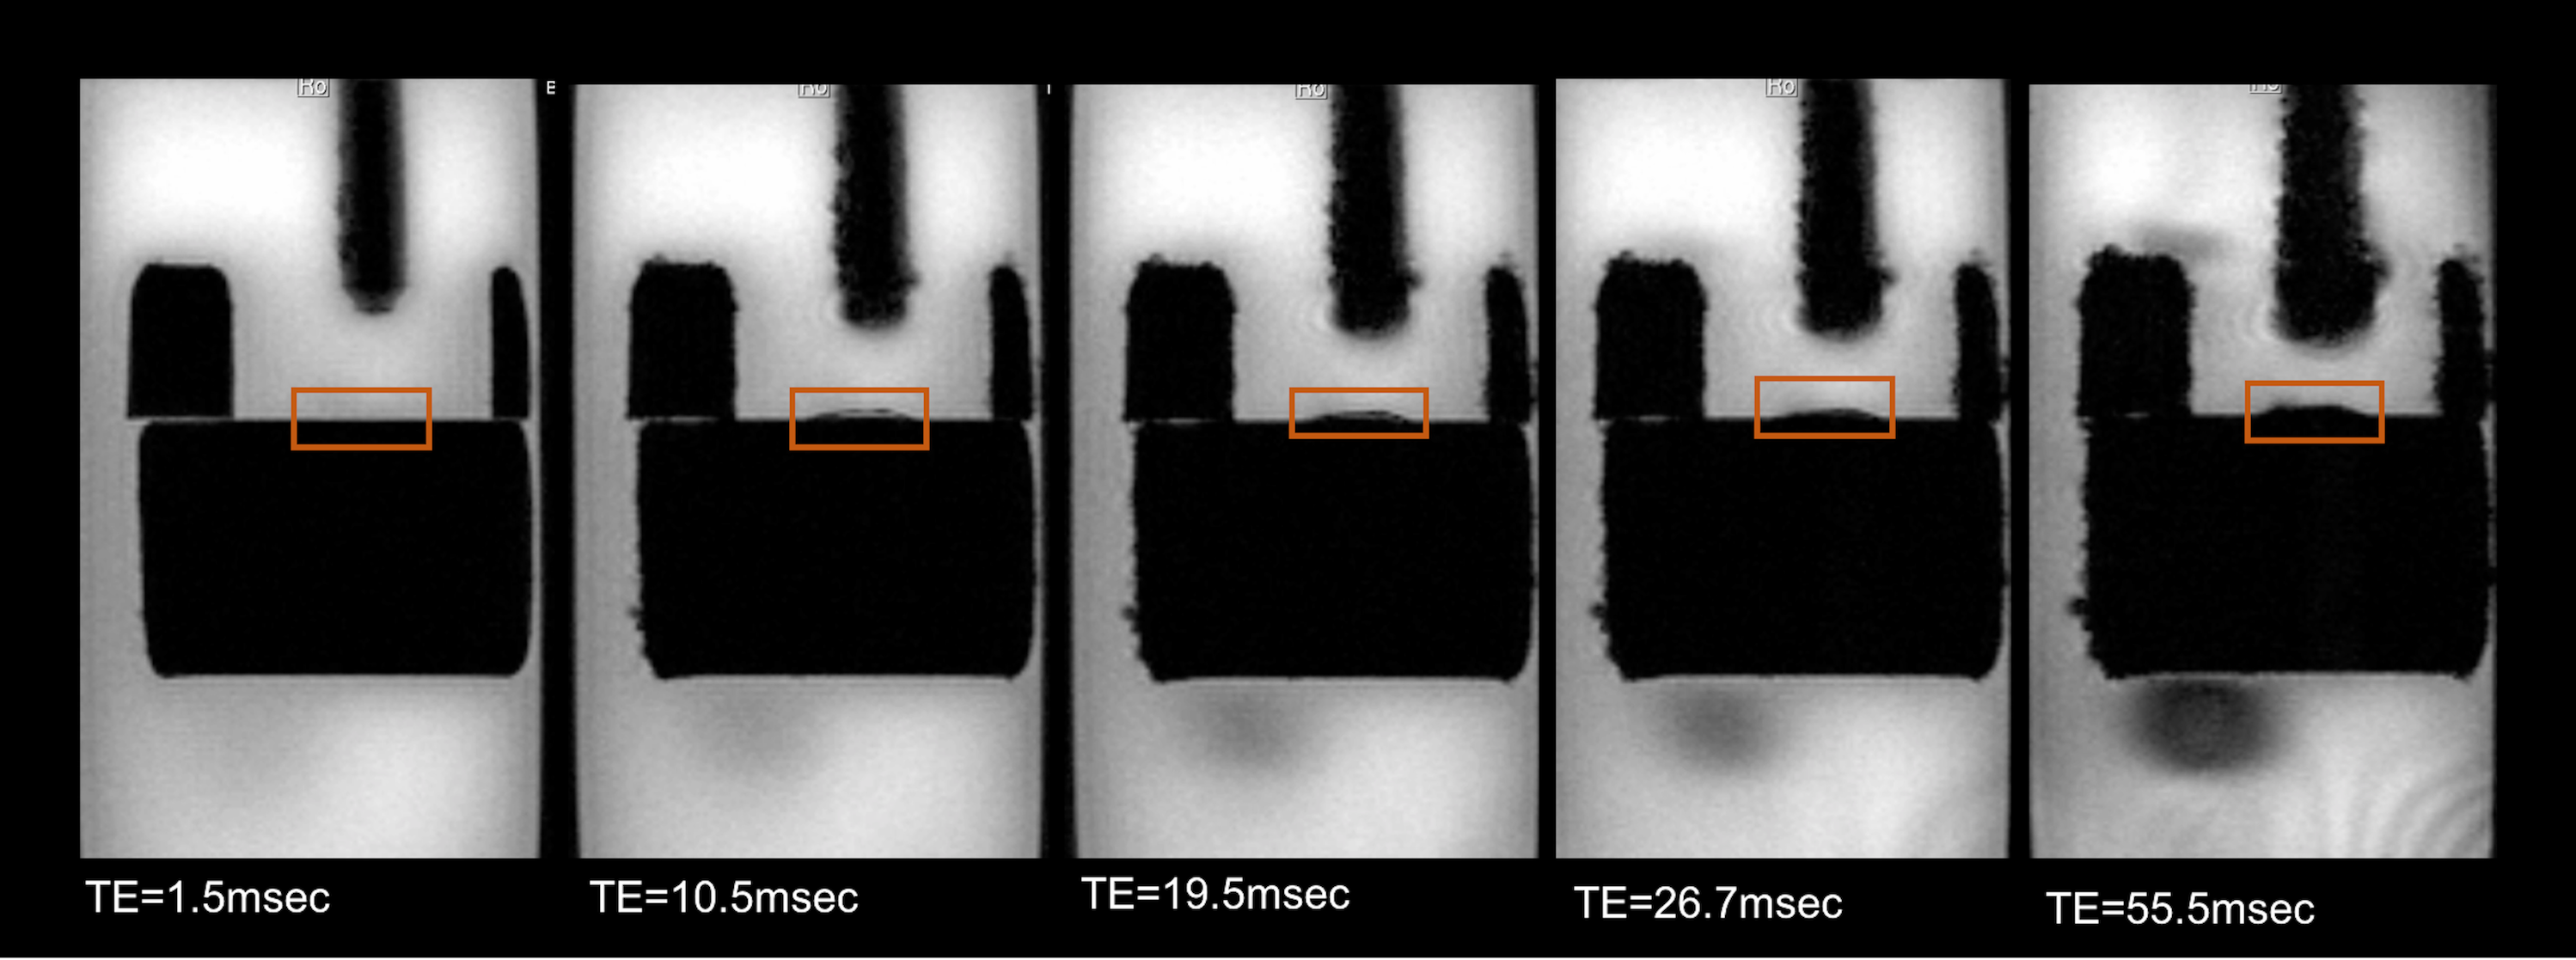
assess image quality, we performed multi-gradient echo MRI experiments with the
following parameters, TE=1.5ms, TR=350ms, NA=4, 32 echo images, echo
spacing=1.8ms, slice thickness= 0.5mm, FOV=16x11mm, resolution=80x79μm and MRI images of organotypic hippocampal
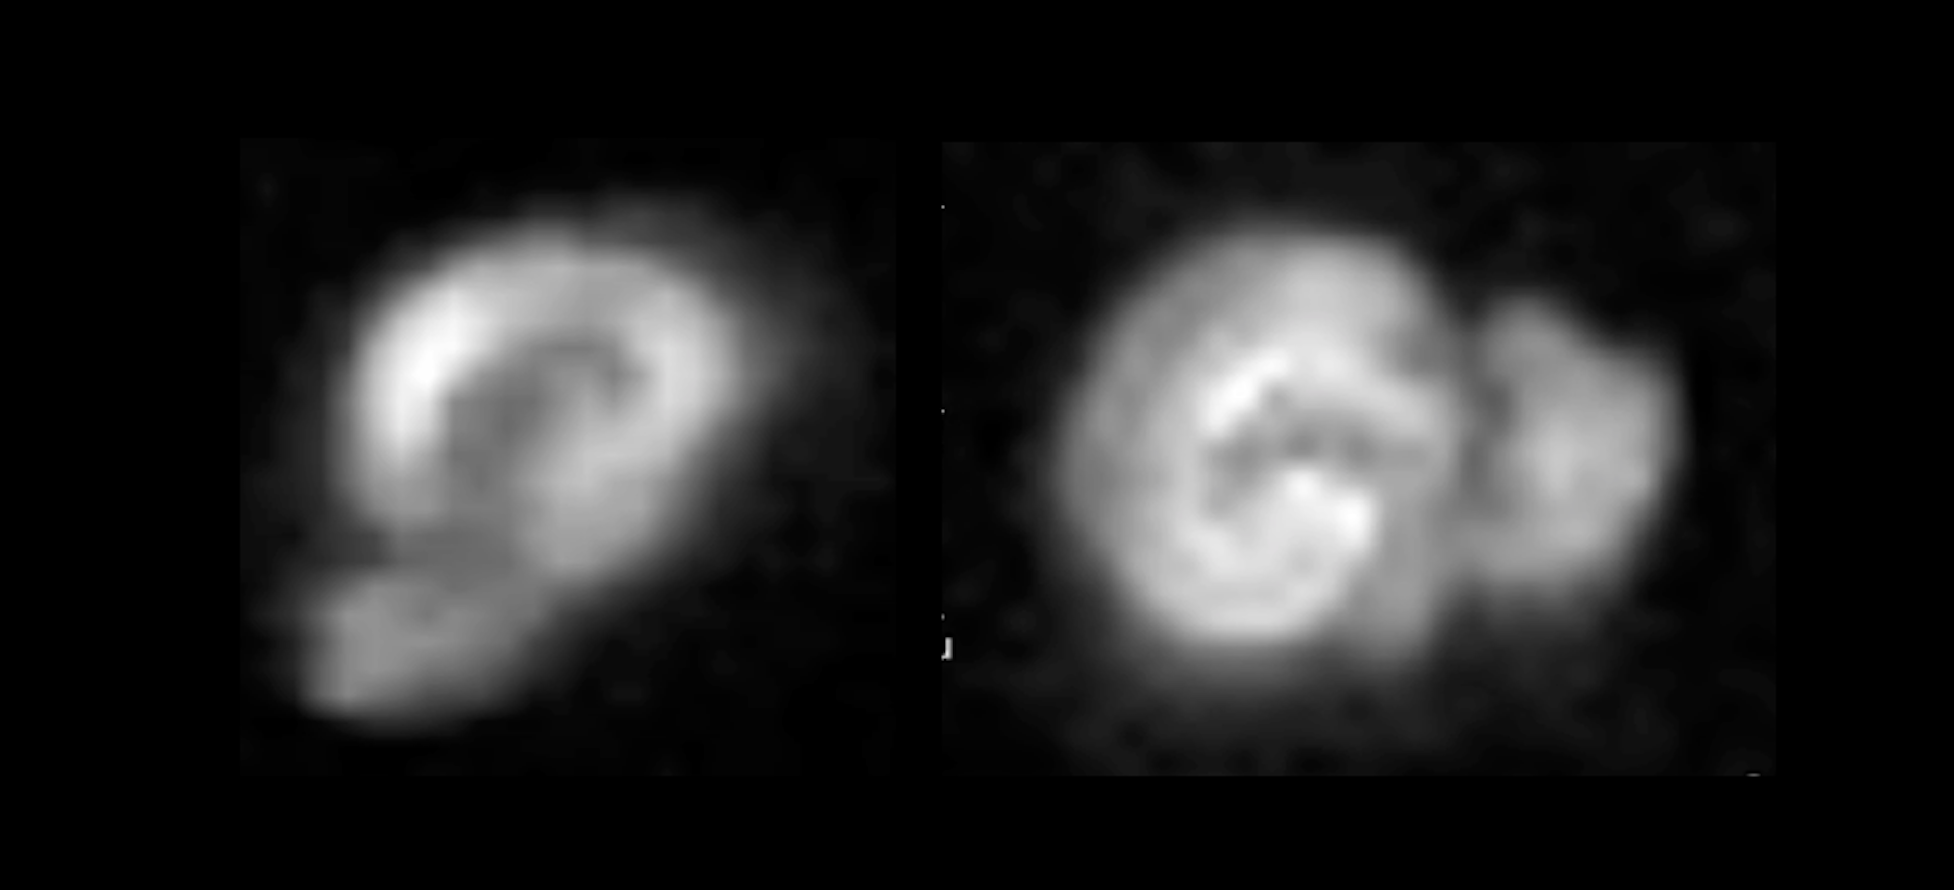
slices were acquired with a DWI-EPI sequence (TE=13.50ms, TR=45s, NA=80, slice
thickness=370mm, FOV=6.2mm2, in-plane resolution=138mm2,
BW=50kHz, b-value=2000 s/mm2, Δ/δ=3/1.7ms).Results and Discussion
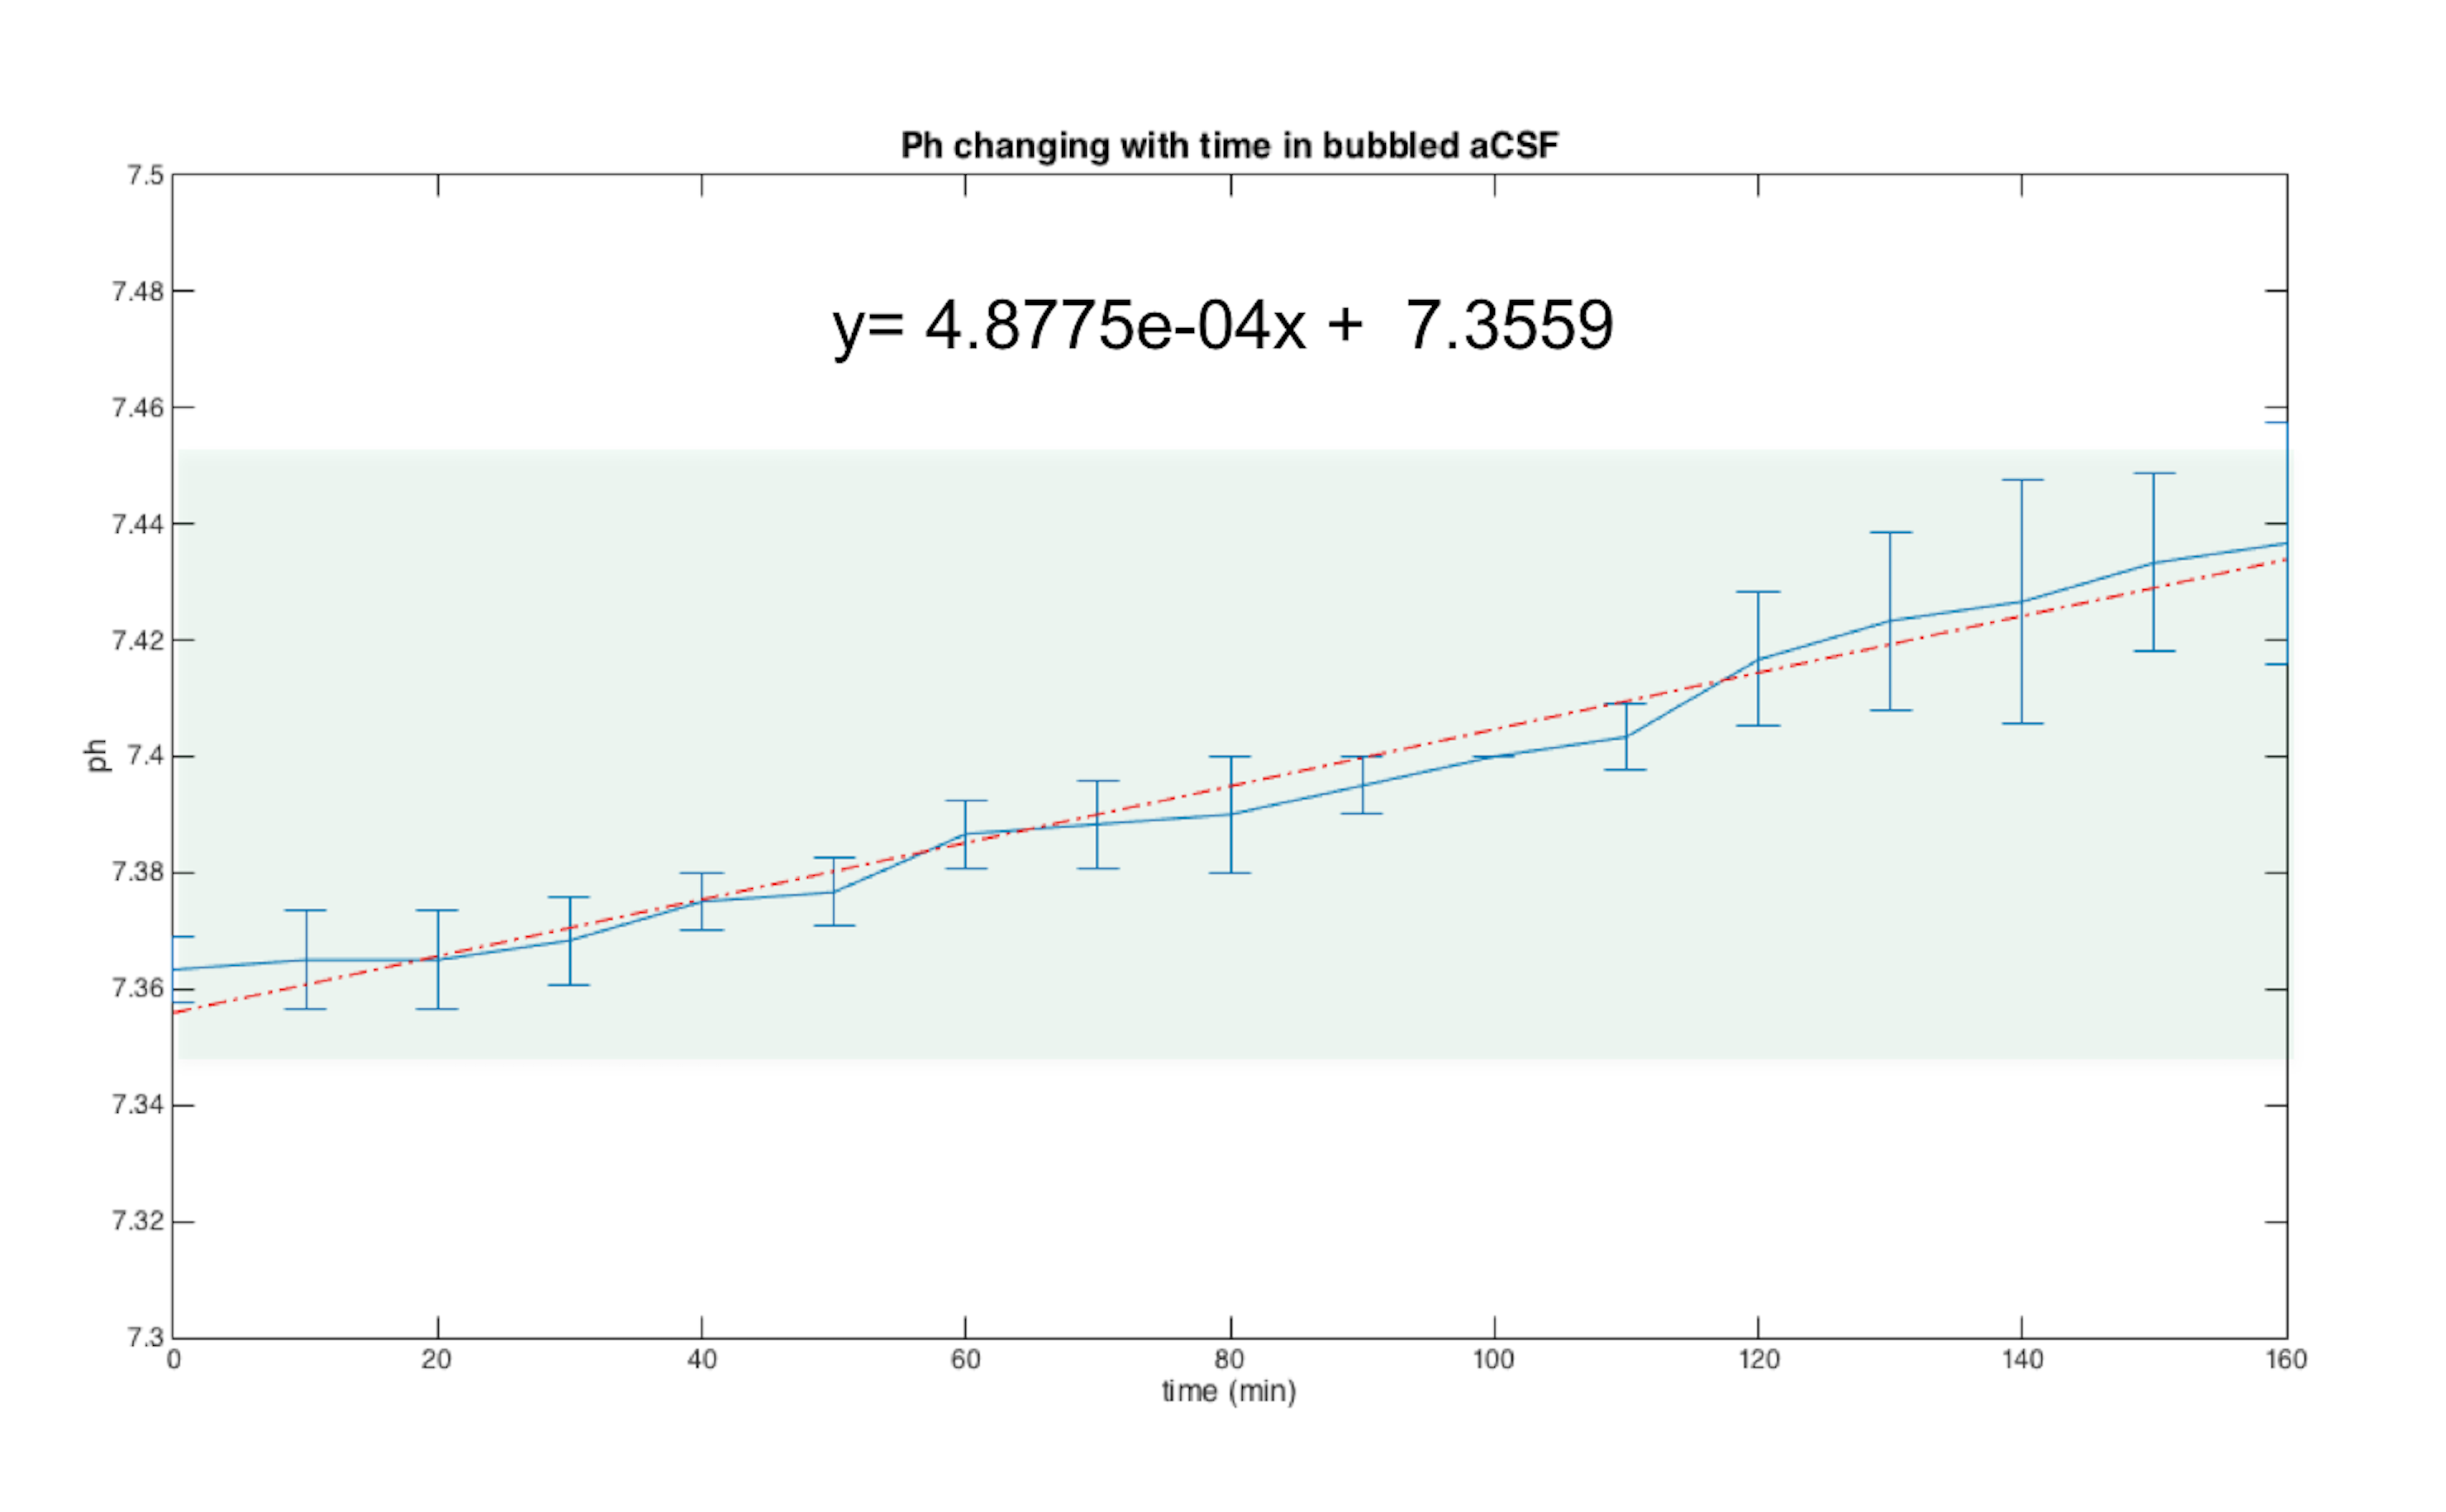
Previous studies10,12 reporting MRI experiments in live brain slices, suggested a ~5 min flush of aCSF every 20-30min; however, in our hands, this flushing may introduce a host of artifacts including introduction of bubbles to the slice, “motion” due to the fluid pressure, and effective changes in shim settings. To establish how long the slices could be kept under the similar conditions as in the magnet we measured the slice’s pH – perhaps the most detrimental parameter for slice survival – outside the magnet. The pH of the aCSF in contact with a living hippocampal slice placed in a set up as described was measured every 10 minutes. Figure 2 shows the average and standard deviation time evolution of pH measured in three different slices. The pH increases up to 7.44 after ~3h. A linear fit to the data points shows that at each hour there is an increase of ~0.02 in the pH. This means that by starting with a physiological pH of 7.35, an acquisition of three hours (maximum) can be done without compromising the slice’s physiological state and neuronal activity due to changes in the pH of the medium. To show the quality of images obtained using the setup, Figure 3 shows two different hippocampal slices placed in the setup. The DWI-EPI acquisitions at very high b-value of 2000 s/mm2 show excellent SNR, and no significant distortions originating from the setup, in particular from the fiber, could be observed. Figure 4 shows a further assessment of the inhomogeneity induced by the fiber, via multi-gradient echo images. Even at very long echo times for a 16.4T scanner, the fiber only induces very small field inhomogeneities. Indeed, the typical linewidth in localized spectroscopy performed on the water signal for shimming evidenced linewidths of ~6Hz. This setup described above is adequate for the acquisition of MRI images for a long period of time, which facilitates more complex experiments such as dfMRI (data not shown). The advantages of optogenetically-induced neuronal activity8,9 in living brain slices is clear given the temporal precision and population specificity. Experiments coupling dfMRI, optogenetics, and optical imaging are indeed underway in our Lab.Acknowledgements
This study was supported by funding from the European Research Council (ERC) under the European Union’s Horizon 2020 research and innovation programme (Starting Grant, agreement No. 679058). The authors would like to acknowledge Dr. Inbal Israely and Dr. Maria Royo for their technical assistance with slice dissection and culturing and Dr. Cristina Chavarrías for her help in programming the imaging sequence.References
[1] Logothetis, Nikos K. "What we can do and what we cannot do with fMRI." Nature 453.7197 (2008): 869-878.
[2] Kohno, Satoru, et al. "Water-diffusion slowdown in the human visual cortex on visual stimulation precedes vascular responses." Journal of Cerebral Blood Flow & Metabolism 29.6 (2009): 1197-1207.
[3] Flint, Jeremy, et al. "Diffusion weighted magnetic resonance imaging of neuronal activity in the hippocampal slice model." Neuroimage 46.2 (2009): 411-418.
[4] Le Bihan, Denis, et al. "Direct and fast detection of neuronal activation in the human brain with diffusion MRI." Proceedings of the National Academy of Sciences 103.21 (2006): 8263-8268.
[5] Tsurugizawa, Tomokazu, Luisa Ciobanu, and Denis Le Bihan. "Water diffusion in brain cortex closely tracks underlying neuronal activity." Proceedings of the National Academy of Sciences 110.28 (2013): 11636-11641.
[6] Bai, Ruiliang, et al. "Assessing the sensitivity of diffusion MRI to detect neuronal activity directly." Proceedings of the National Academy of Sciences 113.12 (2016): E1728-E1737.
[7] Miller, Karla L., et al. "Evidence for a vascular contribution to diffusion FMRI at high b value." Proceedings of the National Academy of Sciences 104.52 (2007): 20967-20972.
[8] Deisseroth, Karl, et al. "Next-generation optical technologies for illuminating genetically targeted brain circuits." The Journal of Neuroscience 26.41 (2006): 10380-10386.
[9] Lee, J., et al. "Optogenetic Functional Magnetic Resonance Imaging (ofMRI): Genetically Targeted In Vivo Brain Circuit Mapping." Proc. Intl. Soc. Mag. Reson. Med. Vol. 18. 2010.
[10] Shepherd, Timothy M., Stephen J. Blackband, and Edward D. Wirth. "Simultaneous diffusion MRI measurements from multiple perfused rat hippocampal slices." Magnetic resonance in medicine 48.3 (2002): 565-569.
[11] Lein, Pamela J., Christopher D. Barnhart, and Isaac N. Pessah. "Acute hippocampal slice preparation and hippocampal slice cultures." In Vitro Neurotoxicology: Methods and Protocols (2011): 115-134.
[12] Flint, Jeremy, et al. "Diffusion weighted magnetic resonance imaging of neuronal activity in the hippocampal slice model." Neuroimage 46.2 (2009): 411-418.
Figures