2573
Spatial Patterns of Intersubject CBF Variability in the CARDIA study1Department of Biomedical Engineering, Tsinghua University, Beijing, People's Republic of China, 2Department of Neurology, School of Medicine, University of Pennsylvania, 3Department of Radiology, School of Medicine, University of Pennsylvania, 4Departments of Neurology and Radiology, School of Medicine, University of Pennsylvania
Synopsis
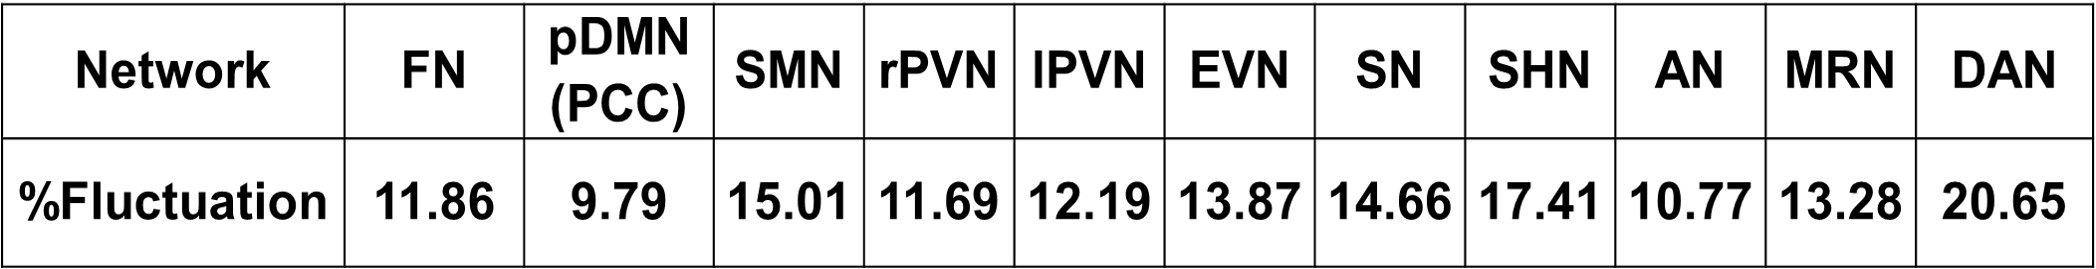
Variability in regional relative cerebral blood flow (CBF) from resting-state arterial spin labeling (ASL) MRI data obtained in a large (N=436) cohort were examined using spatial Independent Components Analysis (ICA). Some spatial patterns of intersubject CBF variability resembled known resting-state functional networks, and were largely reproducible across split samples. Network relative CBF fluctuation across subjects was about 14%.
INTRODUCTION
Spatially correlated fluctuations in brain activity are evident in a range of brain function measures, and are typically identified in time series data acquired at rest. While most functional MRI studies of resting state networks utilize blood oxygen level dependent (BOLD) contrast, resting-state networks were originally identified in cerebral blood flow (CBF) data obtained using positron emission tomography (PET)1 are have since been shown to be present in arterial spin labeling (ASL) perfusion MRI data2. ASL CBF has been shown to vary considerably across subjects3. Here, we assessed whether variations in regional CBF within a large cohort occur in a spatially correlated manner reflecting known resting state networks. We used spatial Independent component analysis (ICA) to characterize the distribution of relative CBF in a large cohort of middle-aged subjects acquired in the Year 25 of Coronary Artery Risk Development in Young Adults (CARDIA) study3.METHODS
Data from 436 subjects (54% female, age: 50.4±3.5 years) acquired using 2D PCASL with a labeling duration of 1.48s, a postlabeling delay of 1.5s, and voxel resolution of 3.4x3.4x5 mm3 were analyzed. ASL data were processed using ASLtbx4 which is based on SPM85. The processing pipeline consisted of first aligning the raw EPI images, CBF quantification, structural correlation and robust Bayesian (SCRUB) based data cleaning approach6, and subsequent normalization to MNI space using a Dartel template constructed using the high resolution structural scans7. Relative CBF maps for each subject were computed by dividing the CBF at each voxel by the whole brain CBF.
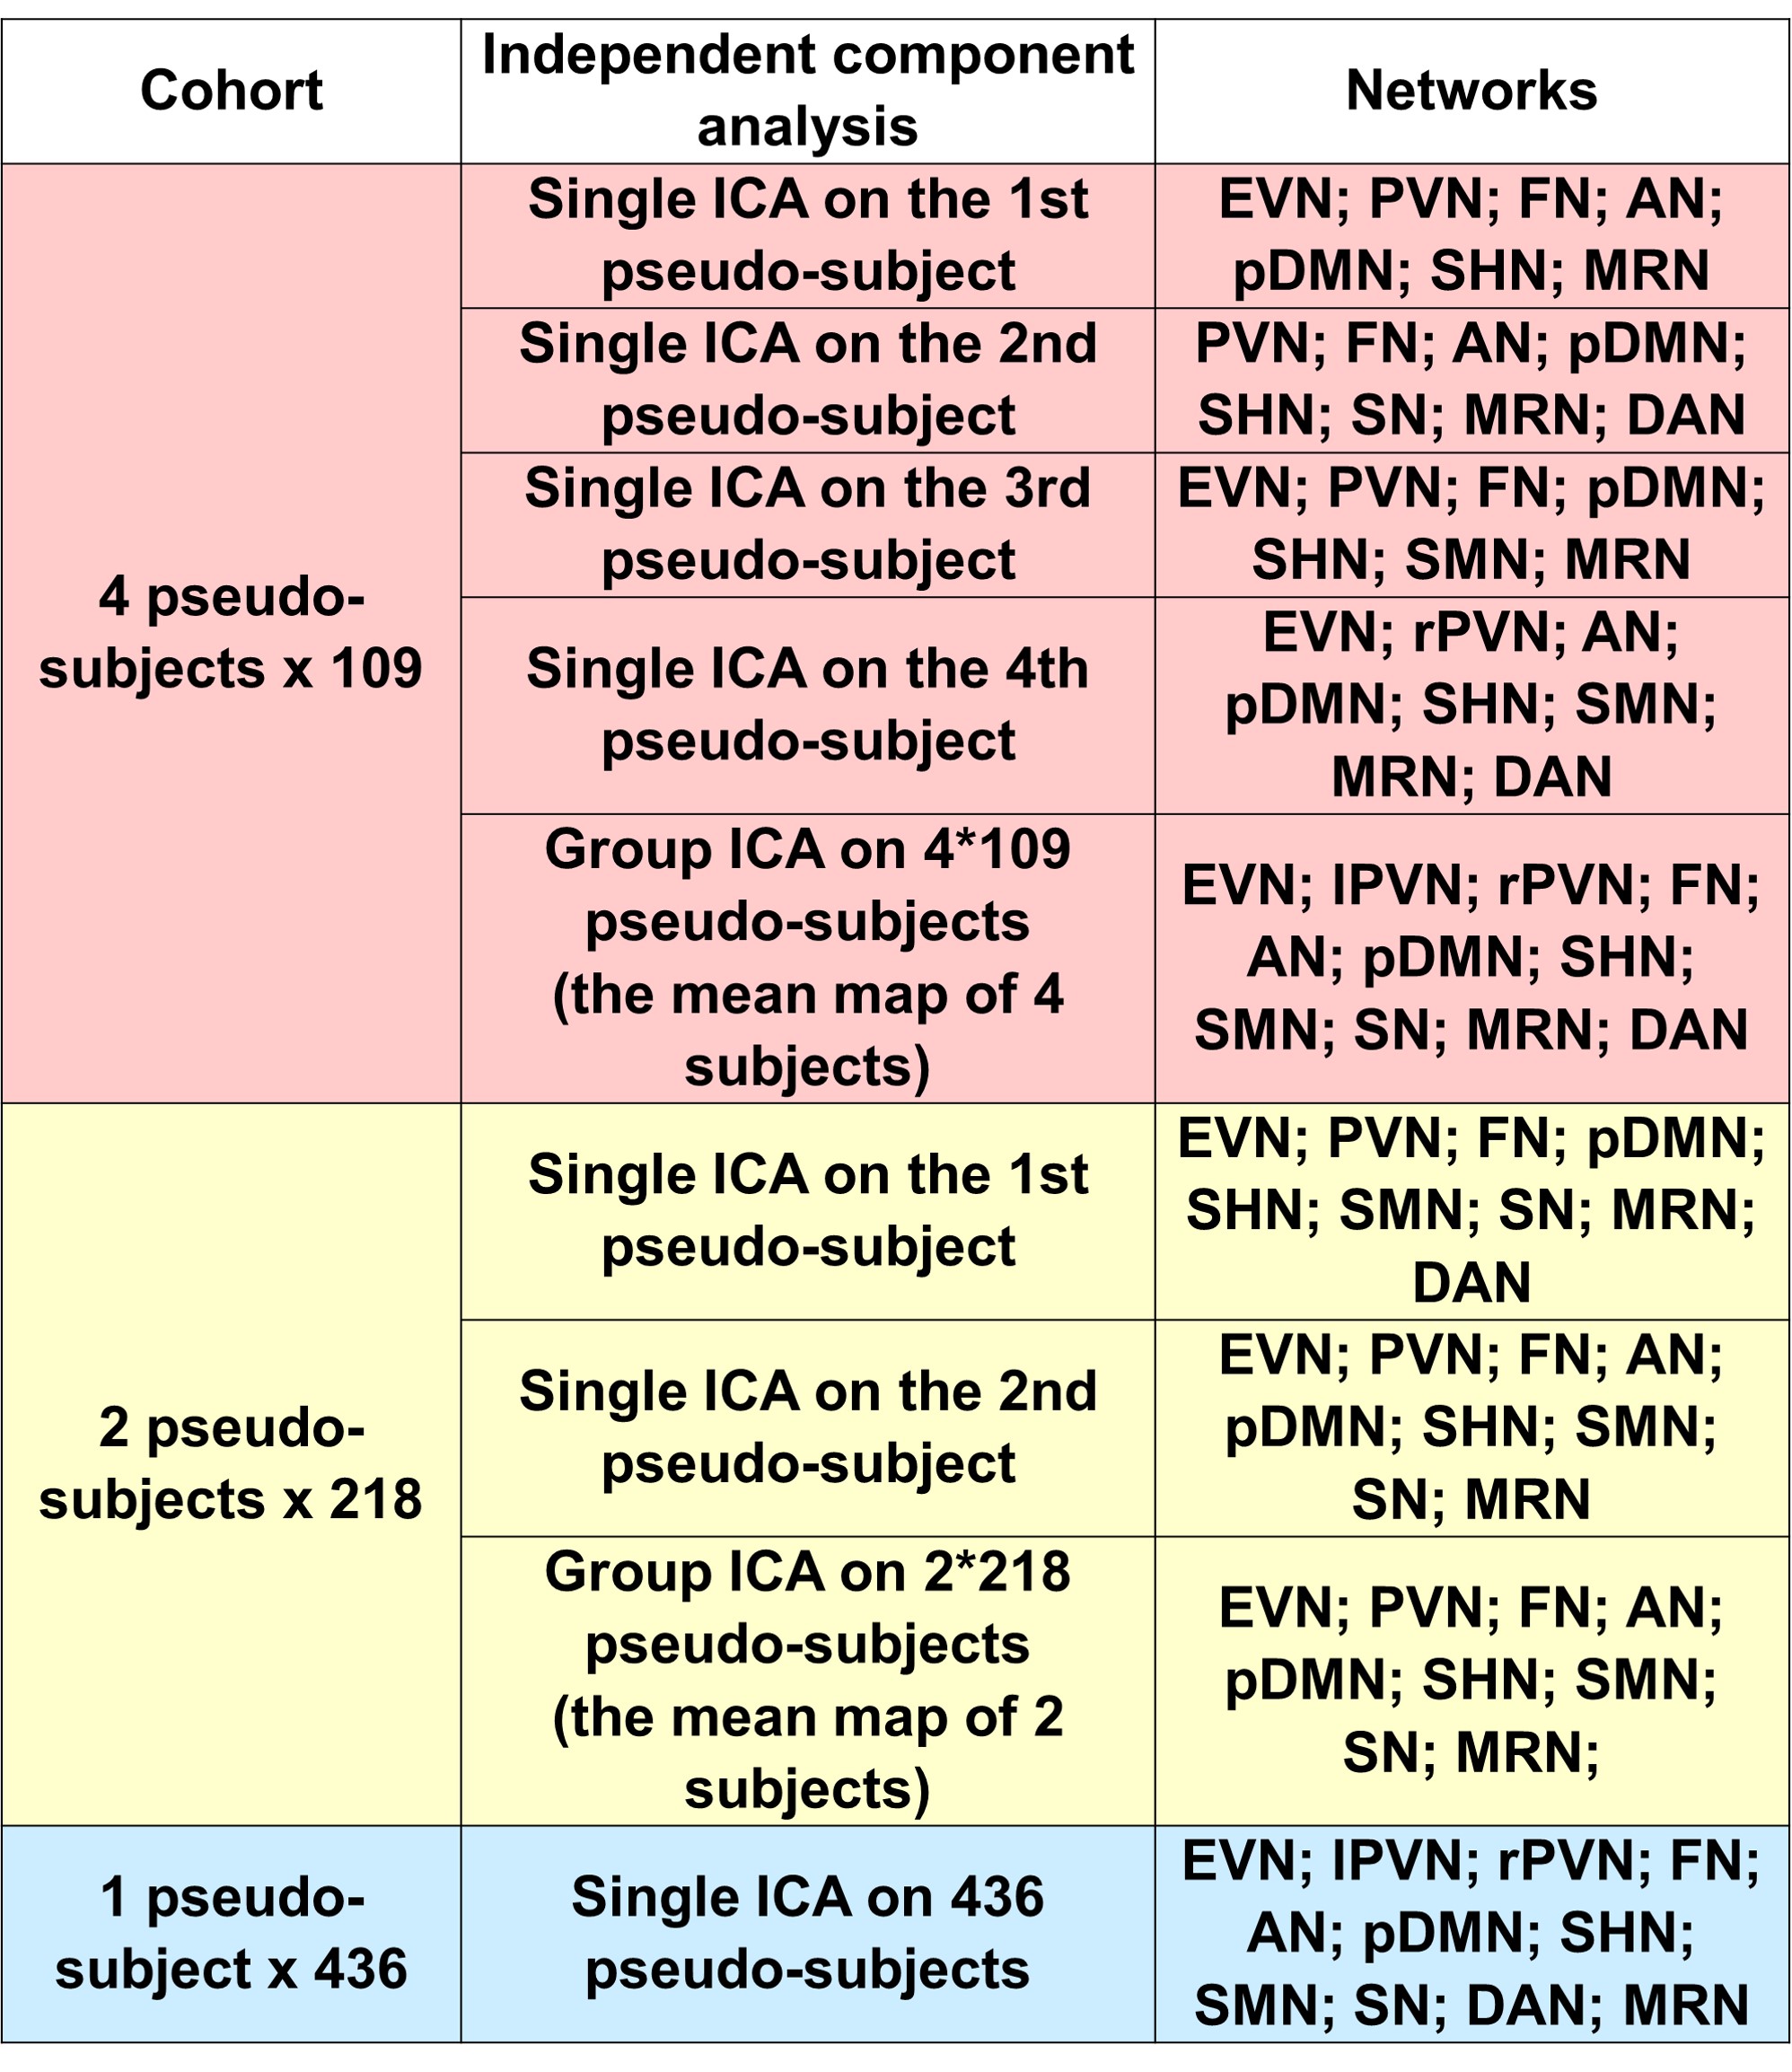
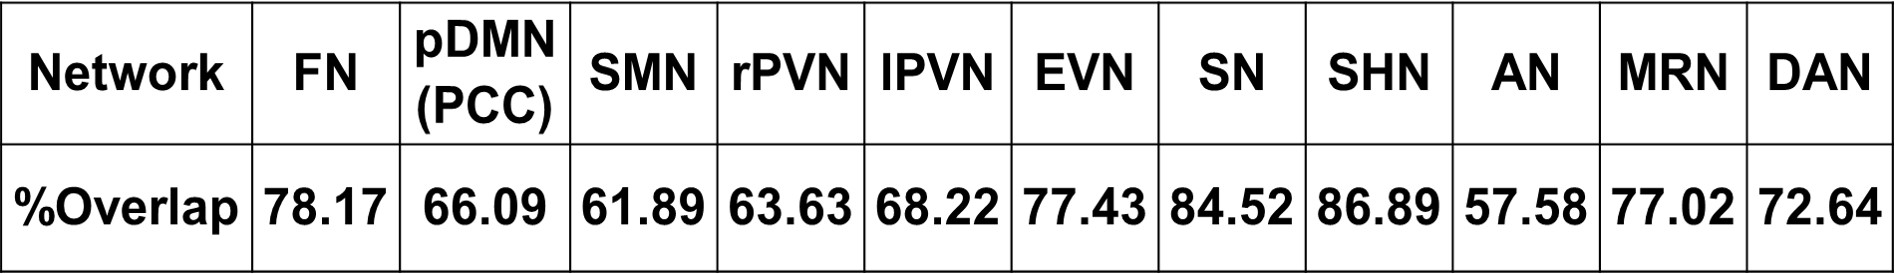
The 436 subjects’ relative CBF maps were then concatenated for ICA analysis of spatial components using the GIFT toolbox8 to extract 40 independent components from the 4-Dimensional pseudo-subjects’ CBF time volumes. This analysis was carried out on the entire cohort (436 samples), as well as divided samples consisting of 2X218 subjects, and 4X10⁹ subjects to evaluate the reproducibility of derived spatial patterns. Network maps were selected by spatially comparing them with previous resting state network maps9 . Network masks were generated by binarizing each network component map with z-score≥2. Each subject’s mean relative CBF within each network mask was extracted. The across-subject relative fluctuation of relative CBF was calculated as the across-subjects standard deviation of mean relative CBF in the network divided by the across-subjects mean of mean relative CBF in the same network mask.
To test the similarity of the ICA networks between the pseudo-subjects, the overlap rate was calculated as the volume of the overlapped region divided by the mean volume of the two network maps.
RESULTS
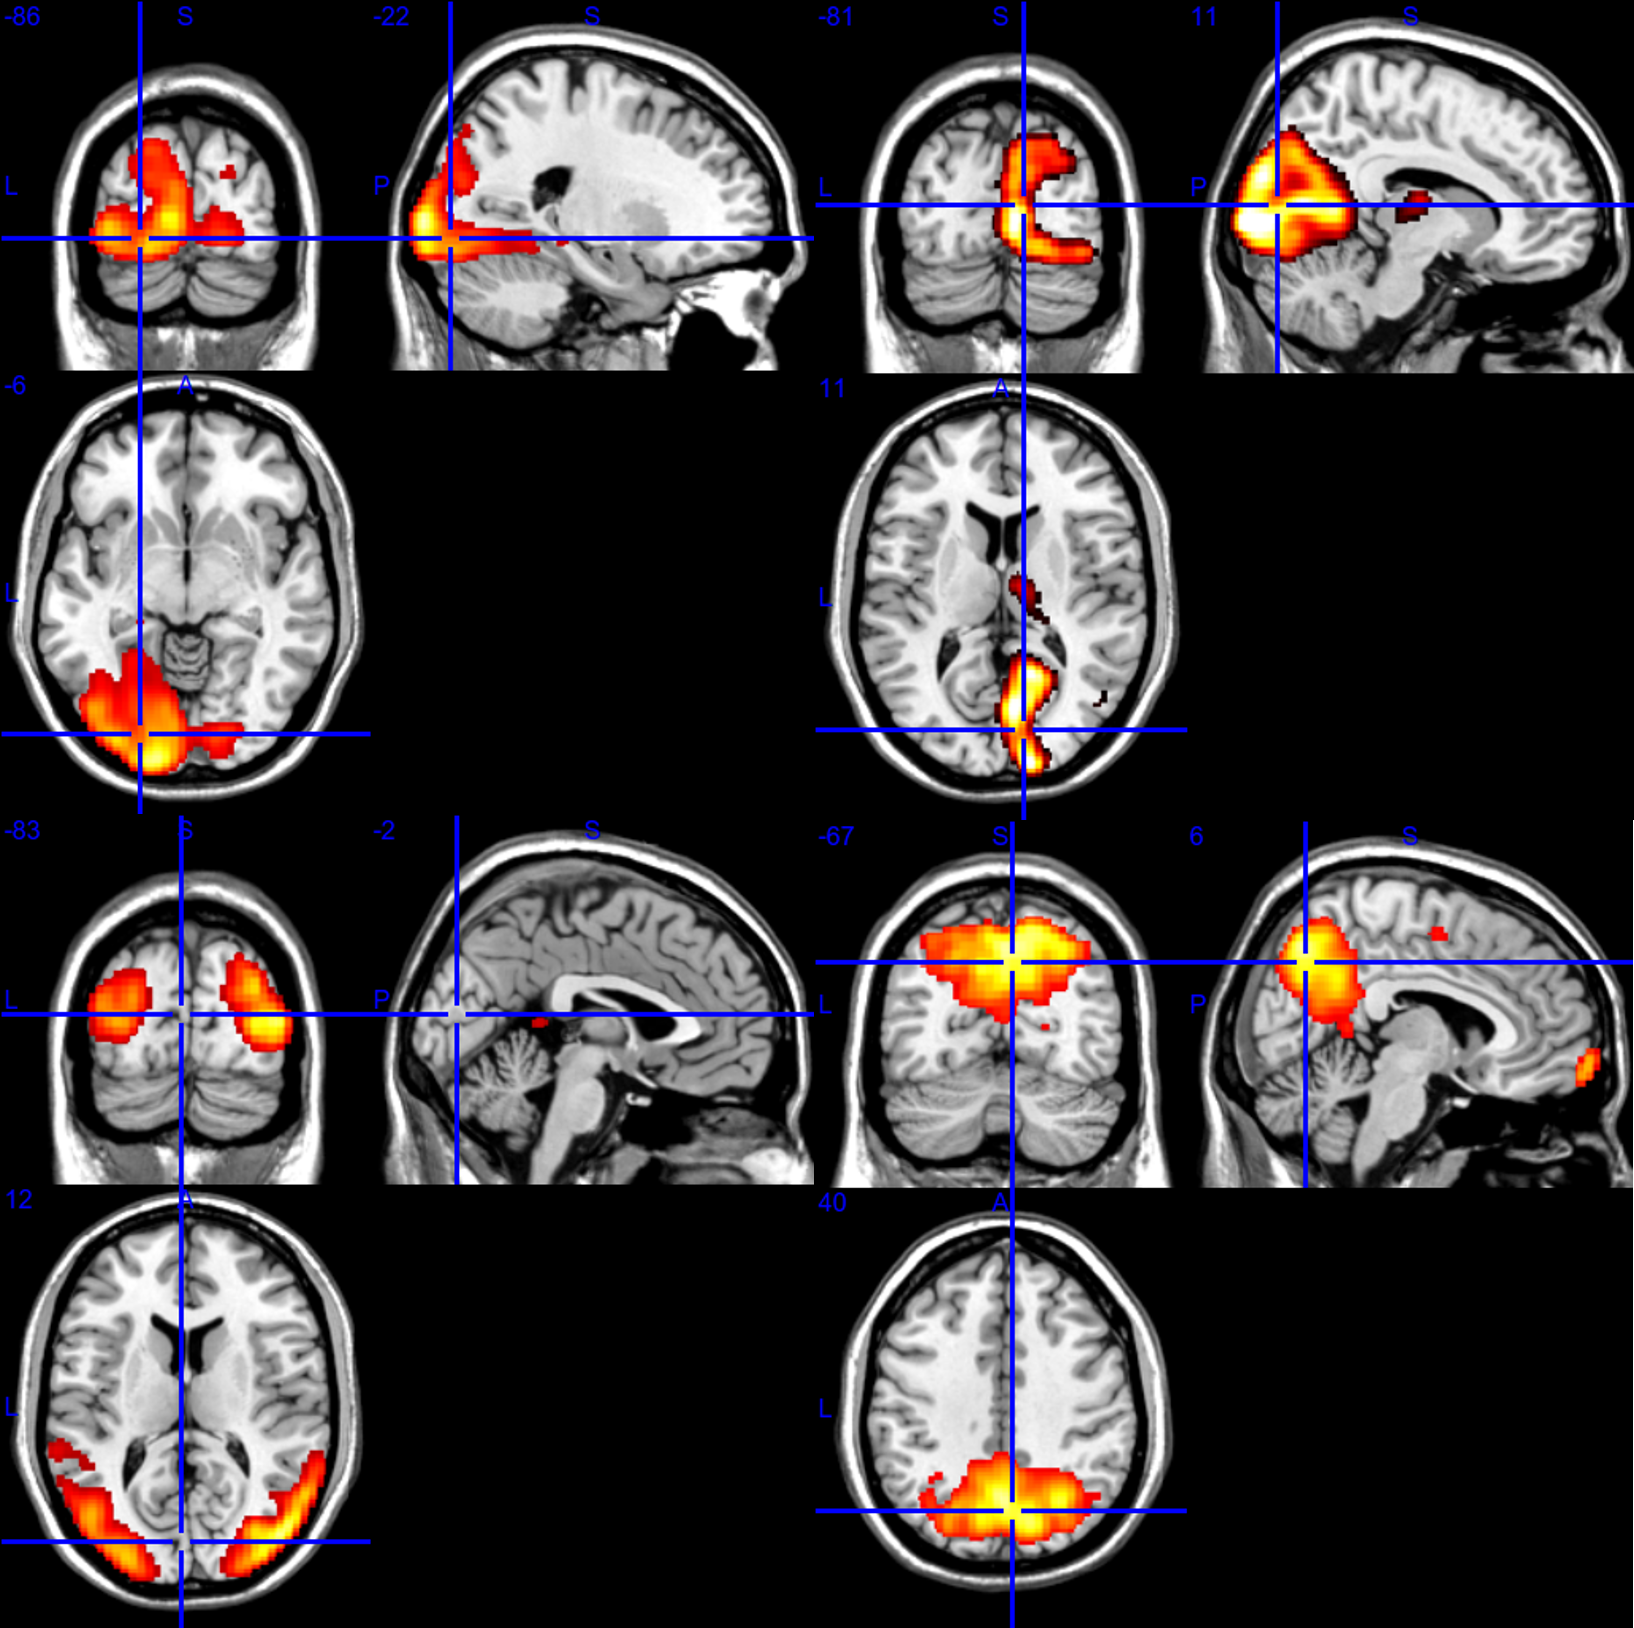
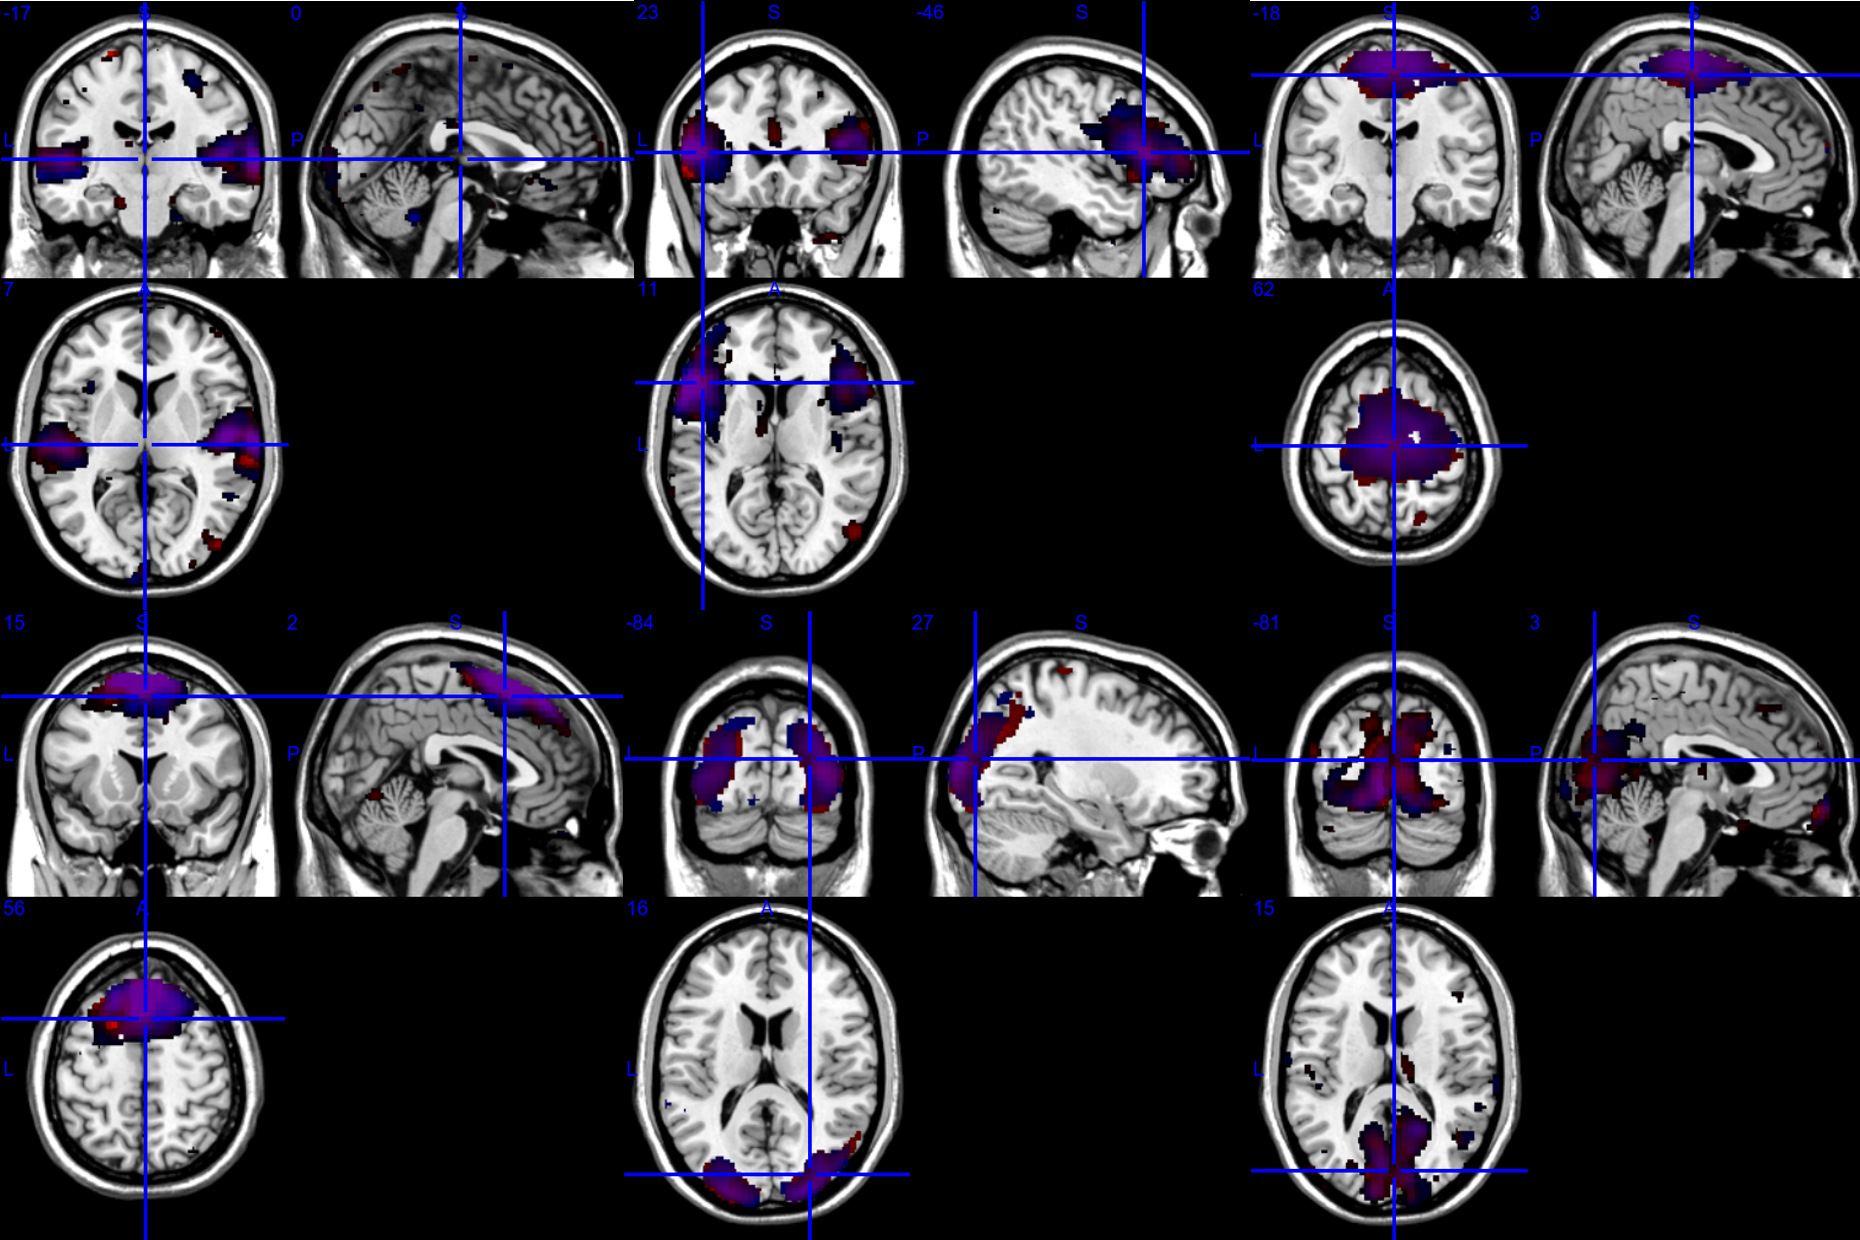
ICA analysis of cohort mean relative CBF maps revealed several identifiable patterns consistent with known functional networks9 as shown in Figure 1. These patterns were most easily identified using the entire cohort data, but most networks could also be identified with smaller samples, as listed in Table 1. Table 2 shows the overlapping rate between spatial networks using the 2X218 data. Figure 2 illustrates the overlap of the Auditory Network (AN), Sensorimotor Hand Network (SHN), Sensorimotor Mouth Network (SMN), Frontal Network (FN), Extra-striate Visual Network (EVN) and Primary Visual Network (PVN) for the 2X218 data. Relative regional fluctuation values for identified networks from the 1X436 data are listed in Table 3. Several spatial components also corresponded to non-functional patterns such as coregistration differences (edge predominant), susceptibility differences (for example in ventral temporal lobe and orbitofrontal regions), and perhaps vascular distributions.CONCLUSION
At least some of the variability in relative regional CBF across subjects occurs within spatially correlated regions resembling known resting-state networks. As regional CBF is coupled to regional neural activity, intersubject work tone may represent a neural phenotype for intersubject variability in cognitive, affective, perceptual, and motor function.Acknowledgements
NIH grants R01 MH080729, P41 EB015893 and Coronary Artery Risk Development in Young Adults (CARDIA) studyReferences
1. Raichle ME, MacLeod AM, Snyder AZ, Powers WJ, Gusnard DA, Shulman GL. A default mode of brain function. Proceedings of the National Academy of Sciences of the United States of America 2001;98:676-682.
2. Dai W, Varma G, Scheidegger R, Alsop DC. Quantifying fluctuations of resting state networks using arterial spin labeling perfusion MRI. Journal of cerebral blood flow and metabolism : official journal of the International Society of Cerebral Blood Flow and Metabolism 2016;36:463-473.
3. Dolui S, Wang Z, Wang DJ, et al. Comparison of non-invasive MRI measurements of cerebral blood flow in a large multisite cohort. J Cereb Blood Flow Metab 2016;36:1244-1256.
4. Wang Z, Aguirre GK, Rao H, et al. Empirical optimization of ASL data analysis using an ASL data processing toolbox: ASLtbx. Magnetic resonance imaging 2008;26:261-269.
5. http://www.fil.ion.ucl.ac.uk/spm/software/spm8/.
6. Dolui S, Wolk DA, Detre JA. SCRUB: A Structural Correlation and Empirical Robust Bayesian Method for ASL Data. Proceedings of the International Society of Magnetic Resonance in Medicine 2016.
7. Ashburner J. A fast diffeomorphic image registration algorithm. NeuroImage 2007;38:95-113.
8. Calhoun VD, Adali T, Pearlson GD, Pekar JJ. A method for making group inferences from functional MRI data using independent component analysis. Hum Brain Mapp 2001;14:140-151.
9. Power JD, Cohen AL, Nelson SM, et al. Functional network organization of the human brain. Neuron 2011;72:665-678.
Figures