2572
Direct Localization Human Pedunculopontine Nucleus Using 7T, Coordinate and Fiber Tracking Validation1State Key Laboratory of Brain and Cognitive Science, Beijing MRI Center for Brain Research, Institute of Biophysics, Chinese Academy of Sciences, Beijing, People's Republic of China, 2Graduate University, Chinese Academy of Sciences, Beijing, People's Republic of China, 3Department of Functional Neurosurgery, Xuanwu Hospital, Capital Medical University, Beijing, People's Republic of China
Synopsis
The pedunculopontine nucleus (PPN), as a potential Deep brain stimulation (DBS) target for the patients to improve gait and posture. Until now, only a few results of the location of PPN has been published. In this study, 7T ultra-high field MR system and high resolution MP2RAGE sequence were used to locate the PPN by a direct view, manually measurement and fiber tracking method were used to verify the results. The results showed a clear and accurate location of PPN.
Introduction
Deep brain stimulation (DBS) had become a widely used method for treatment of Parkinson disease (PD), the pedunculopontine nucleus (PPN), as a potential DBS target for the patients to improve gait and posture [1]. Until now, only a few results of the location of PPN has been published, due to its deep location in the pons, small structure and no clear boundary. In this study, 7T ultra-high field MR and parameter optimized MP2RAGE [2] sequence was used to locate the PPN by a direct view, and the results was verified by measurement and fiber tracking.Method
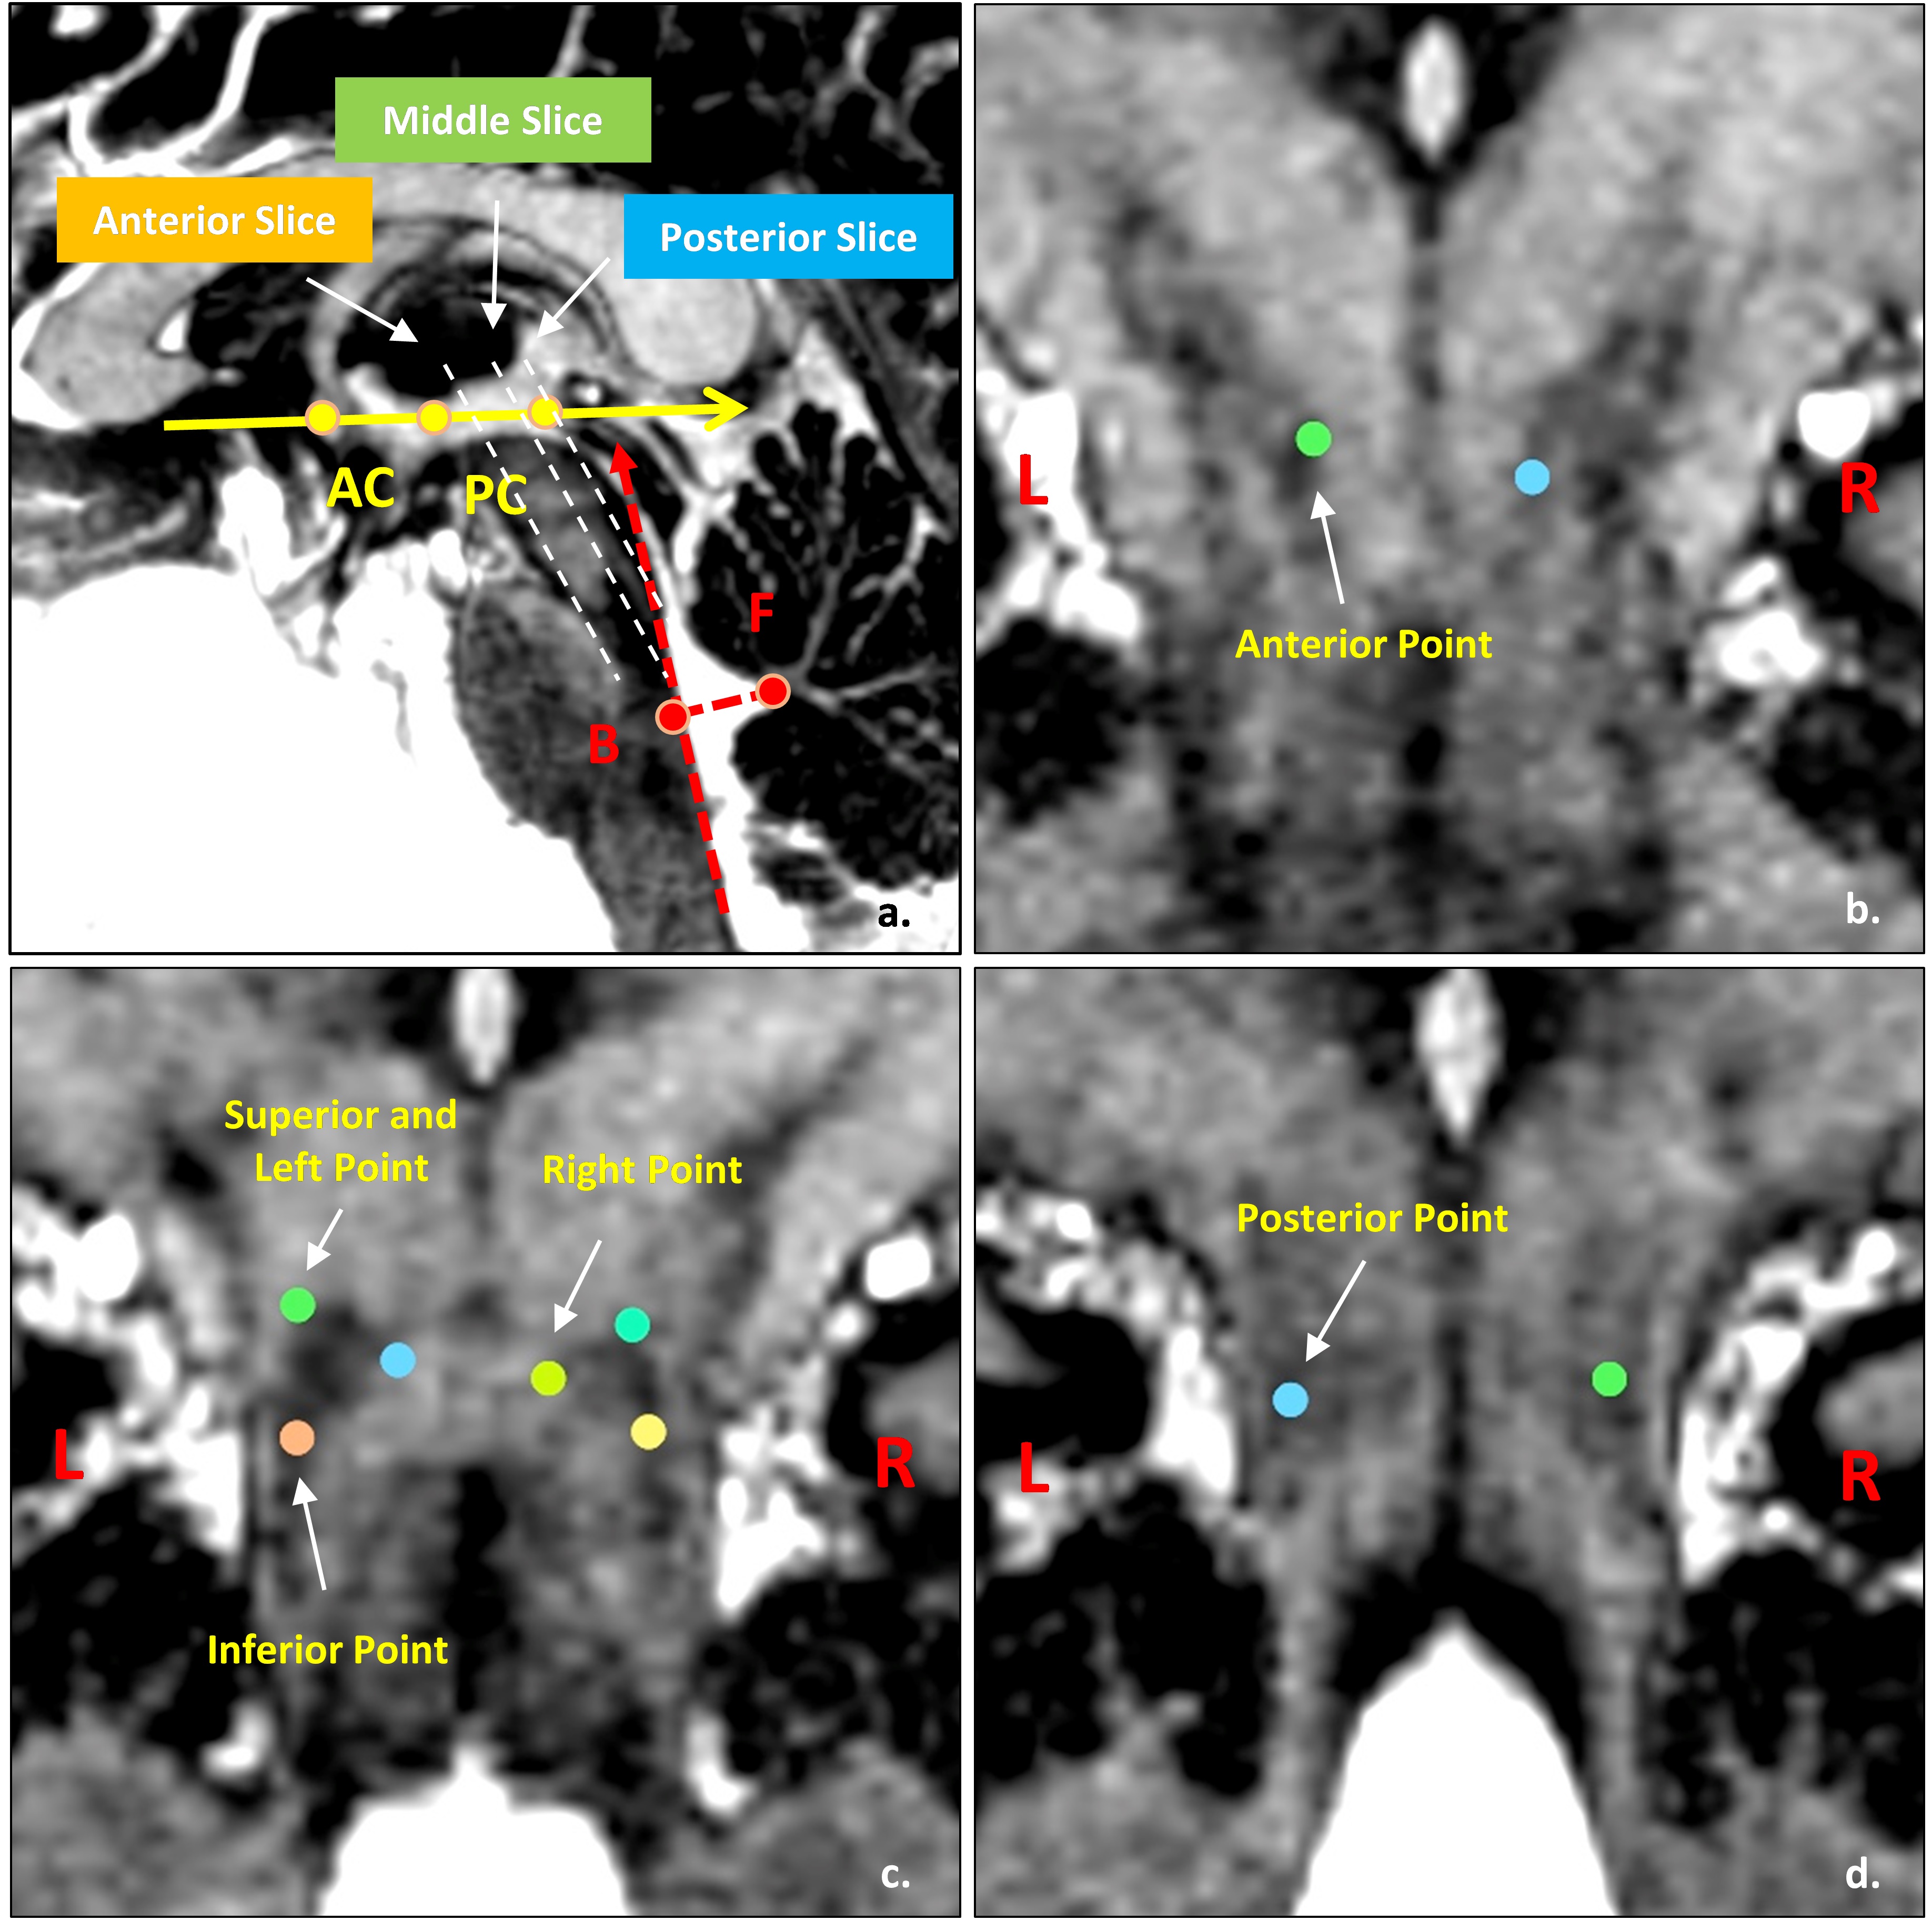
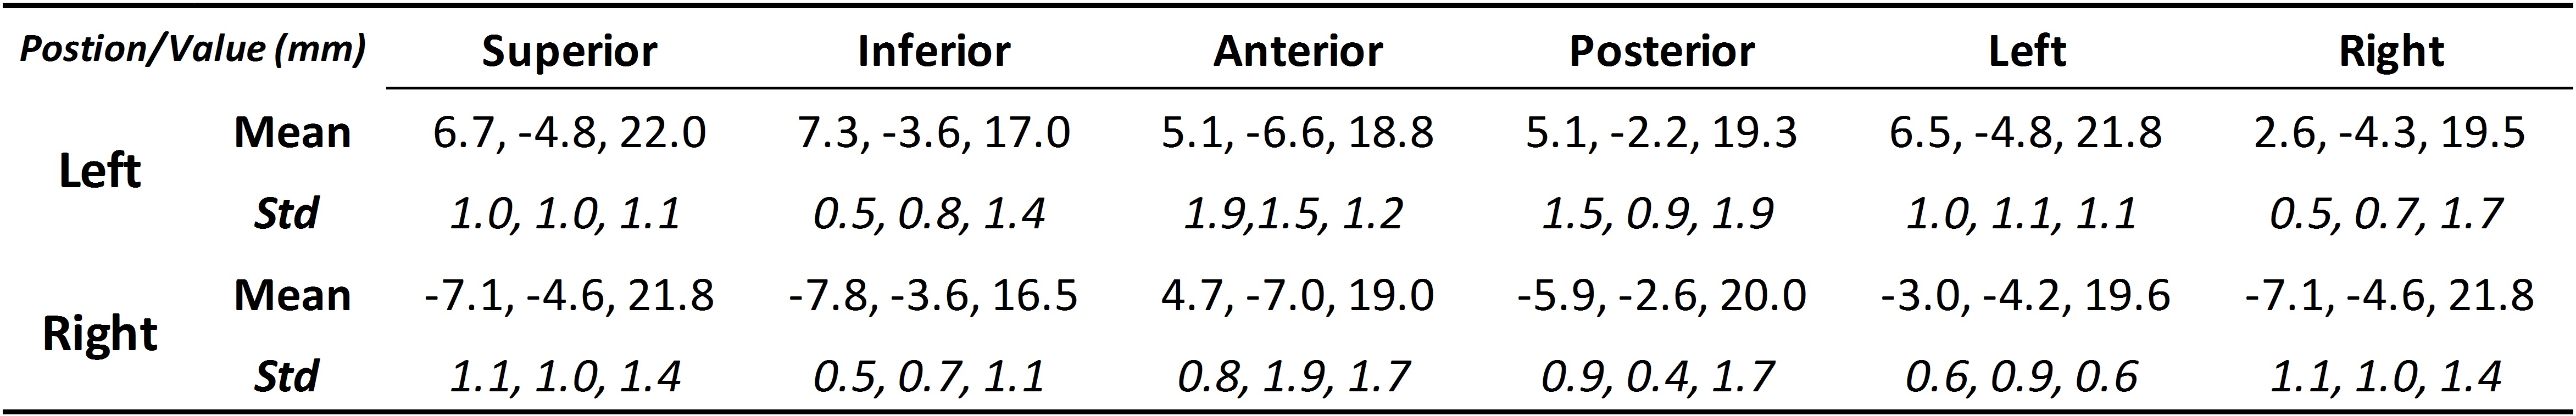
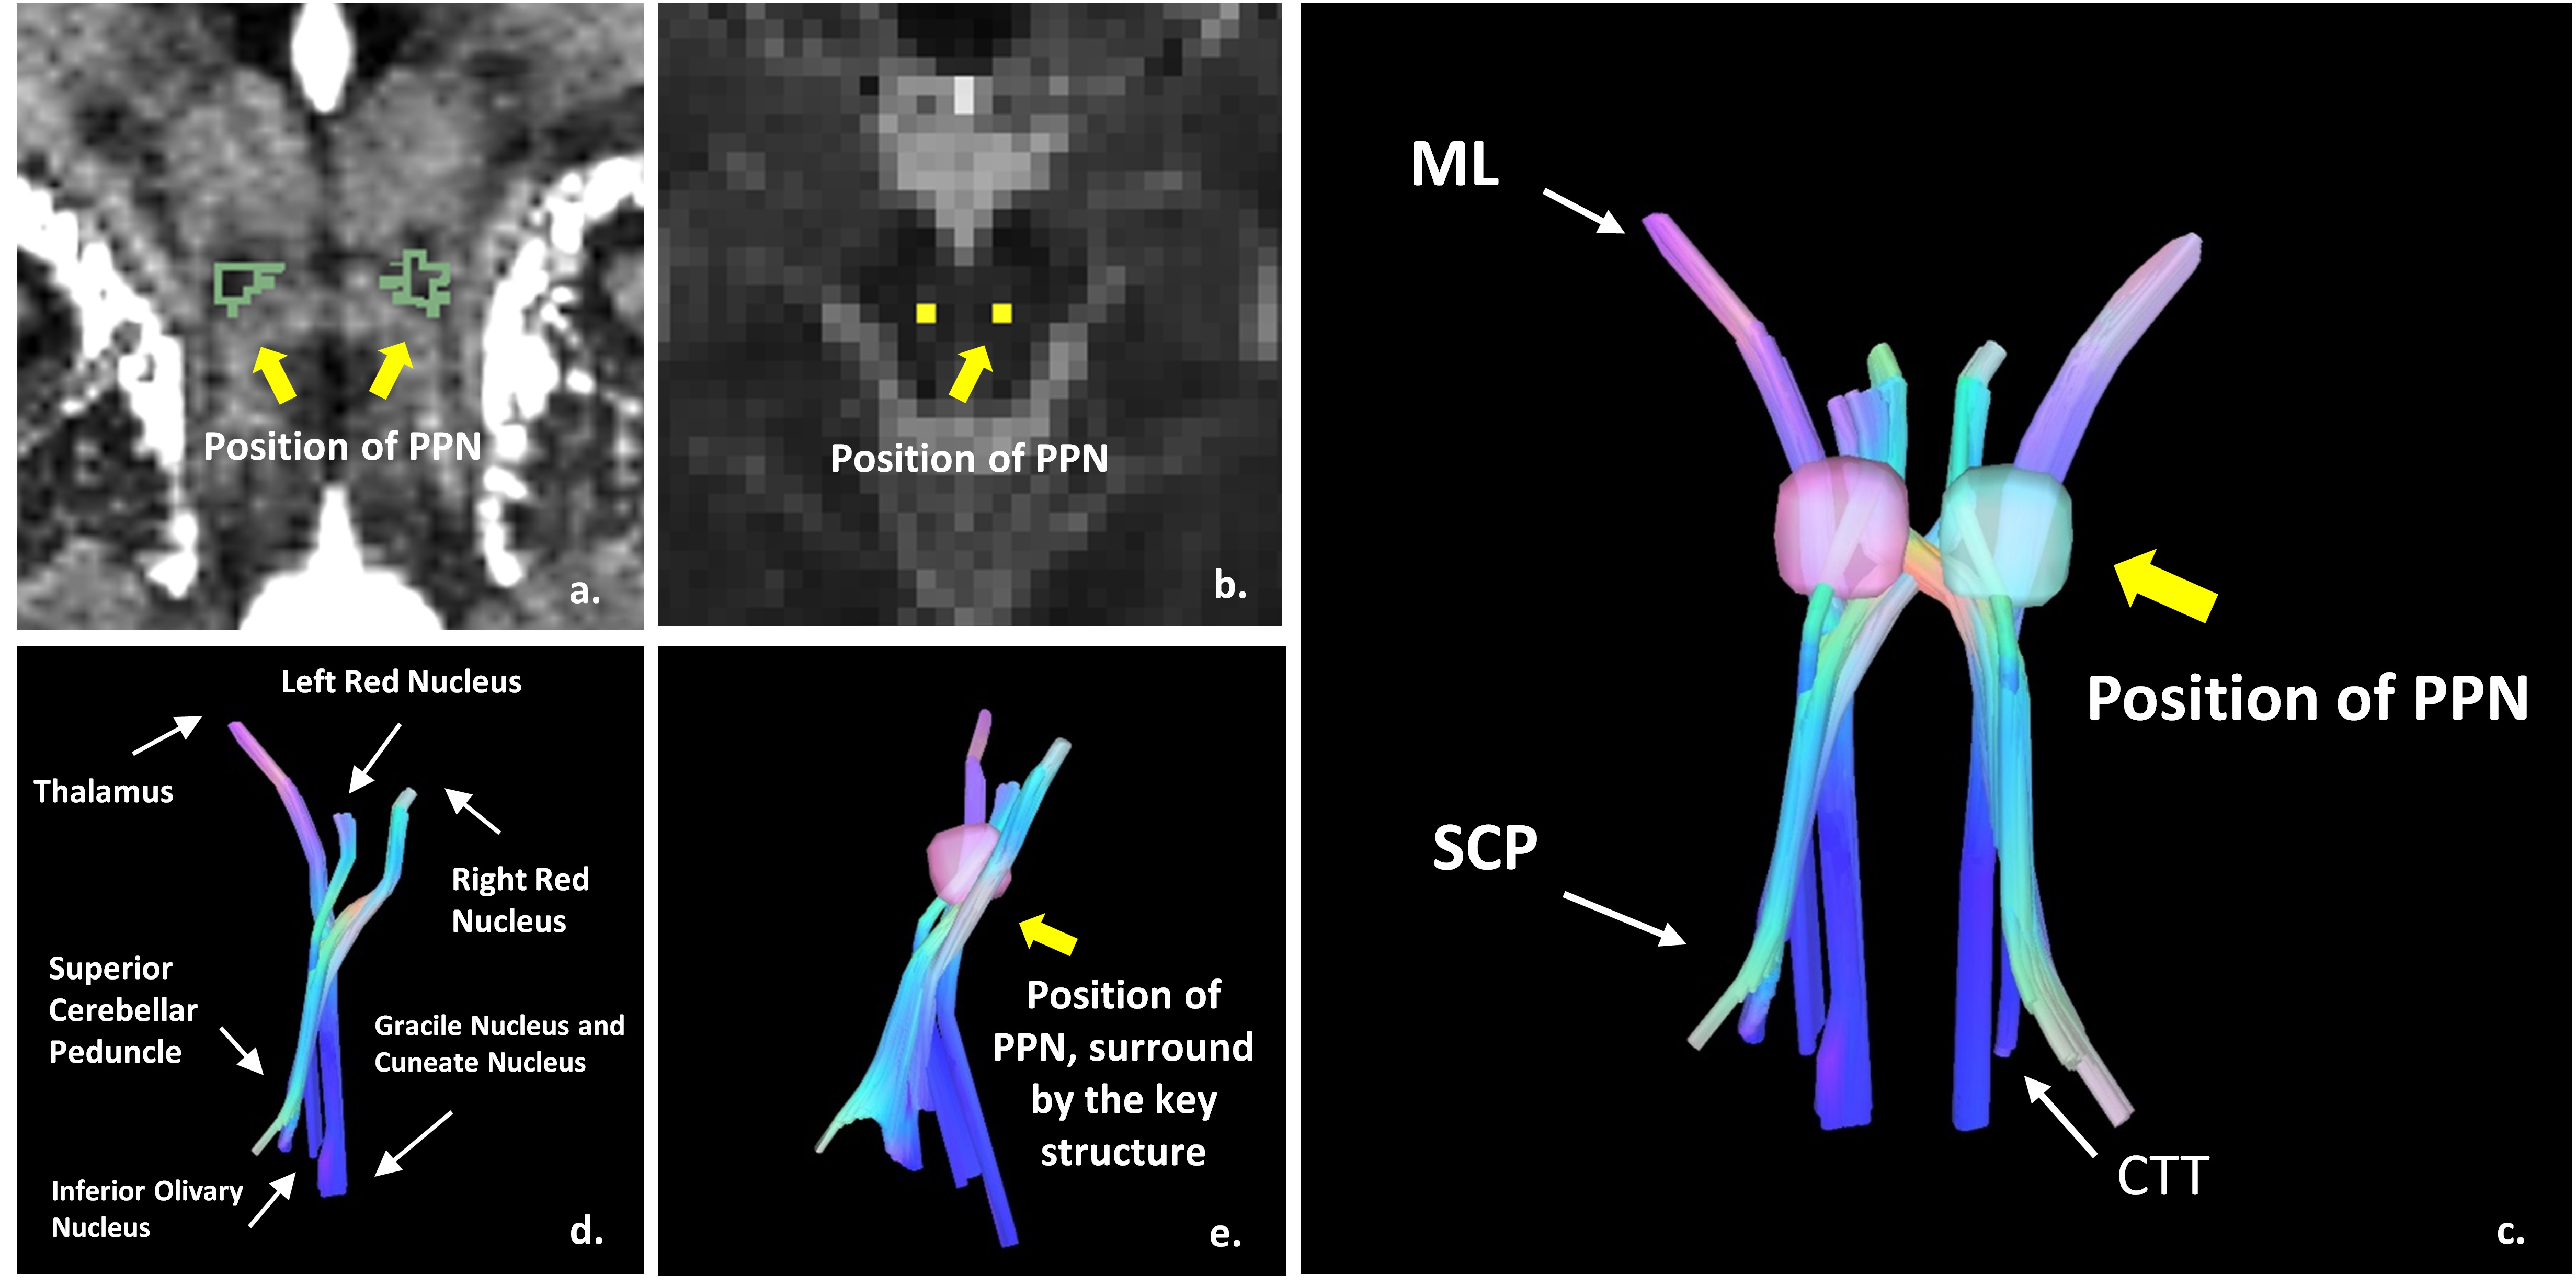
In vivo structure and location data was collected at a 7T research system (Siemens, Erlangen Germany), using MP2RAGE sequence: 0.7 isotropic voxels with 384*384*224 data matrix, TR = 4000ms, TE = 3.08ms, TI1/TI2 = 900/2750ms, FA1/FA2 = 4/5deg. Four healthy volunteers were scanned using this protocol, the images were interpolated at 0.35ms isotropic offline by using OsiriX Lite (http://www.osirix-viewer.com/). The manually measured coordinates of PPN boundary points using the two coordinate as the reference [5]. The anterior, posterior, superior, inferior, left and right of PPN were measured at three-dimensional coordinates, as Figure 2.The diffusion images were acquired on a MAGNETOM Prisma 3T MR TE=97ms, and TR=5000ms. A diffusion spectrum imaging scheme [3] was used, and a total of 514 diffusion sampling were acquired. The maximum b-value was 7010 s/mm2. The resolution was 2.2x2.2x2.2 mm3. One of the four healthy volunteers that scanned by 7T MP2RAGE sequence was performed the diffusion data acquisition. The analysis was conducted using DSI Studio (http://dsi-studio.labsolver.org) [4]. The key structure of PPN, decussation of superior cerebellar peduncle (Dec SCP), medial lemniscus (ML) and central tegmental tracts (CTT) [5] were reconstructed. The pathway of each fiber as followed. Dec SCP, seed from Superior Cerebellar Peduncle, end to Red Nucleus. ML, seed from Upper bound of Gracile and Cuneate Nuclei, end to Ventral Posterolateral Nucleus. CTT, between the Inferior Olivary Nucleus and Red Nucleus.Result
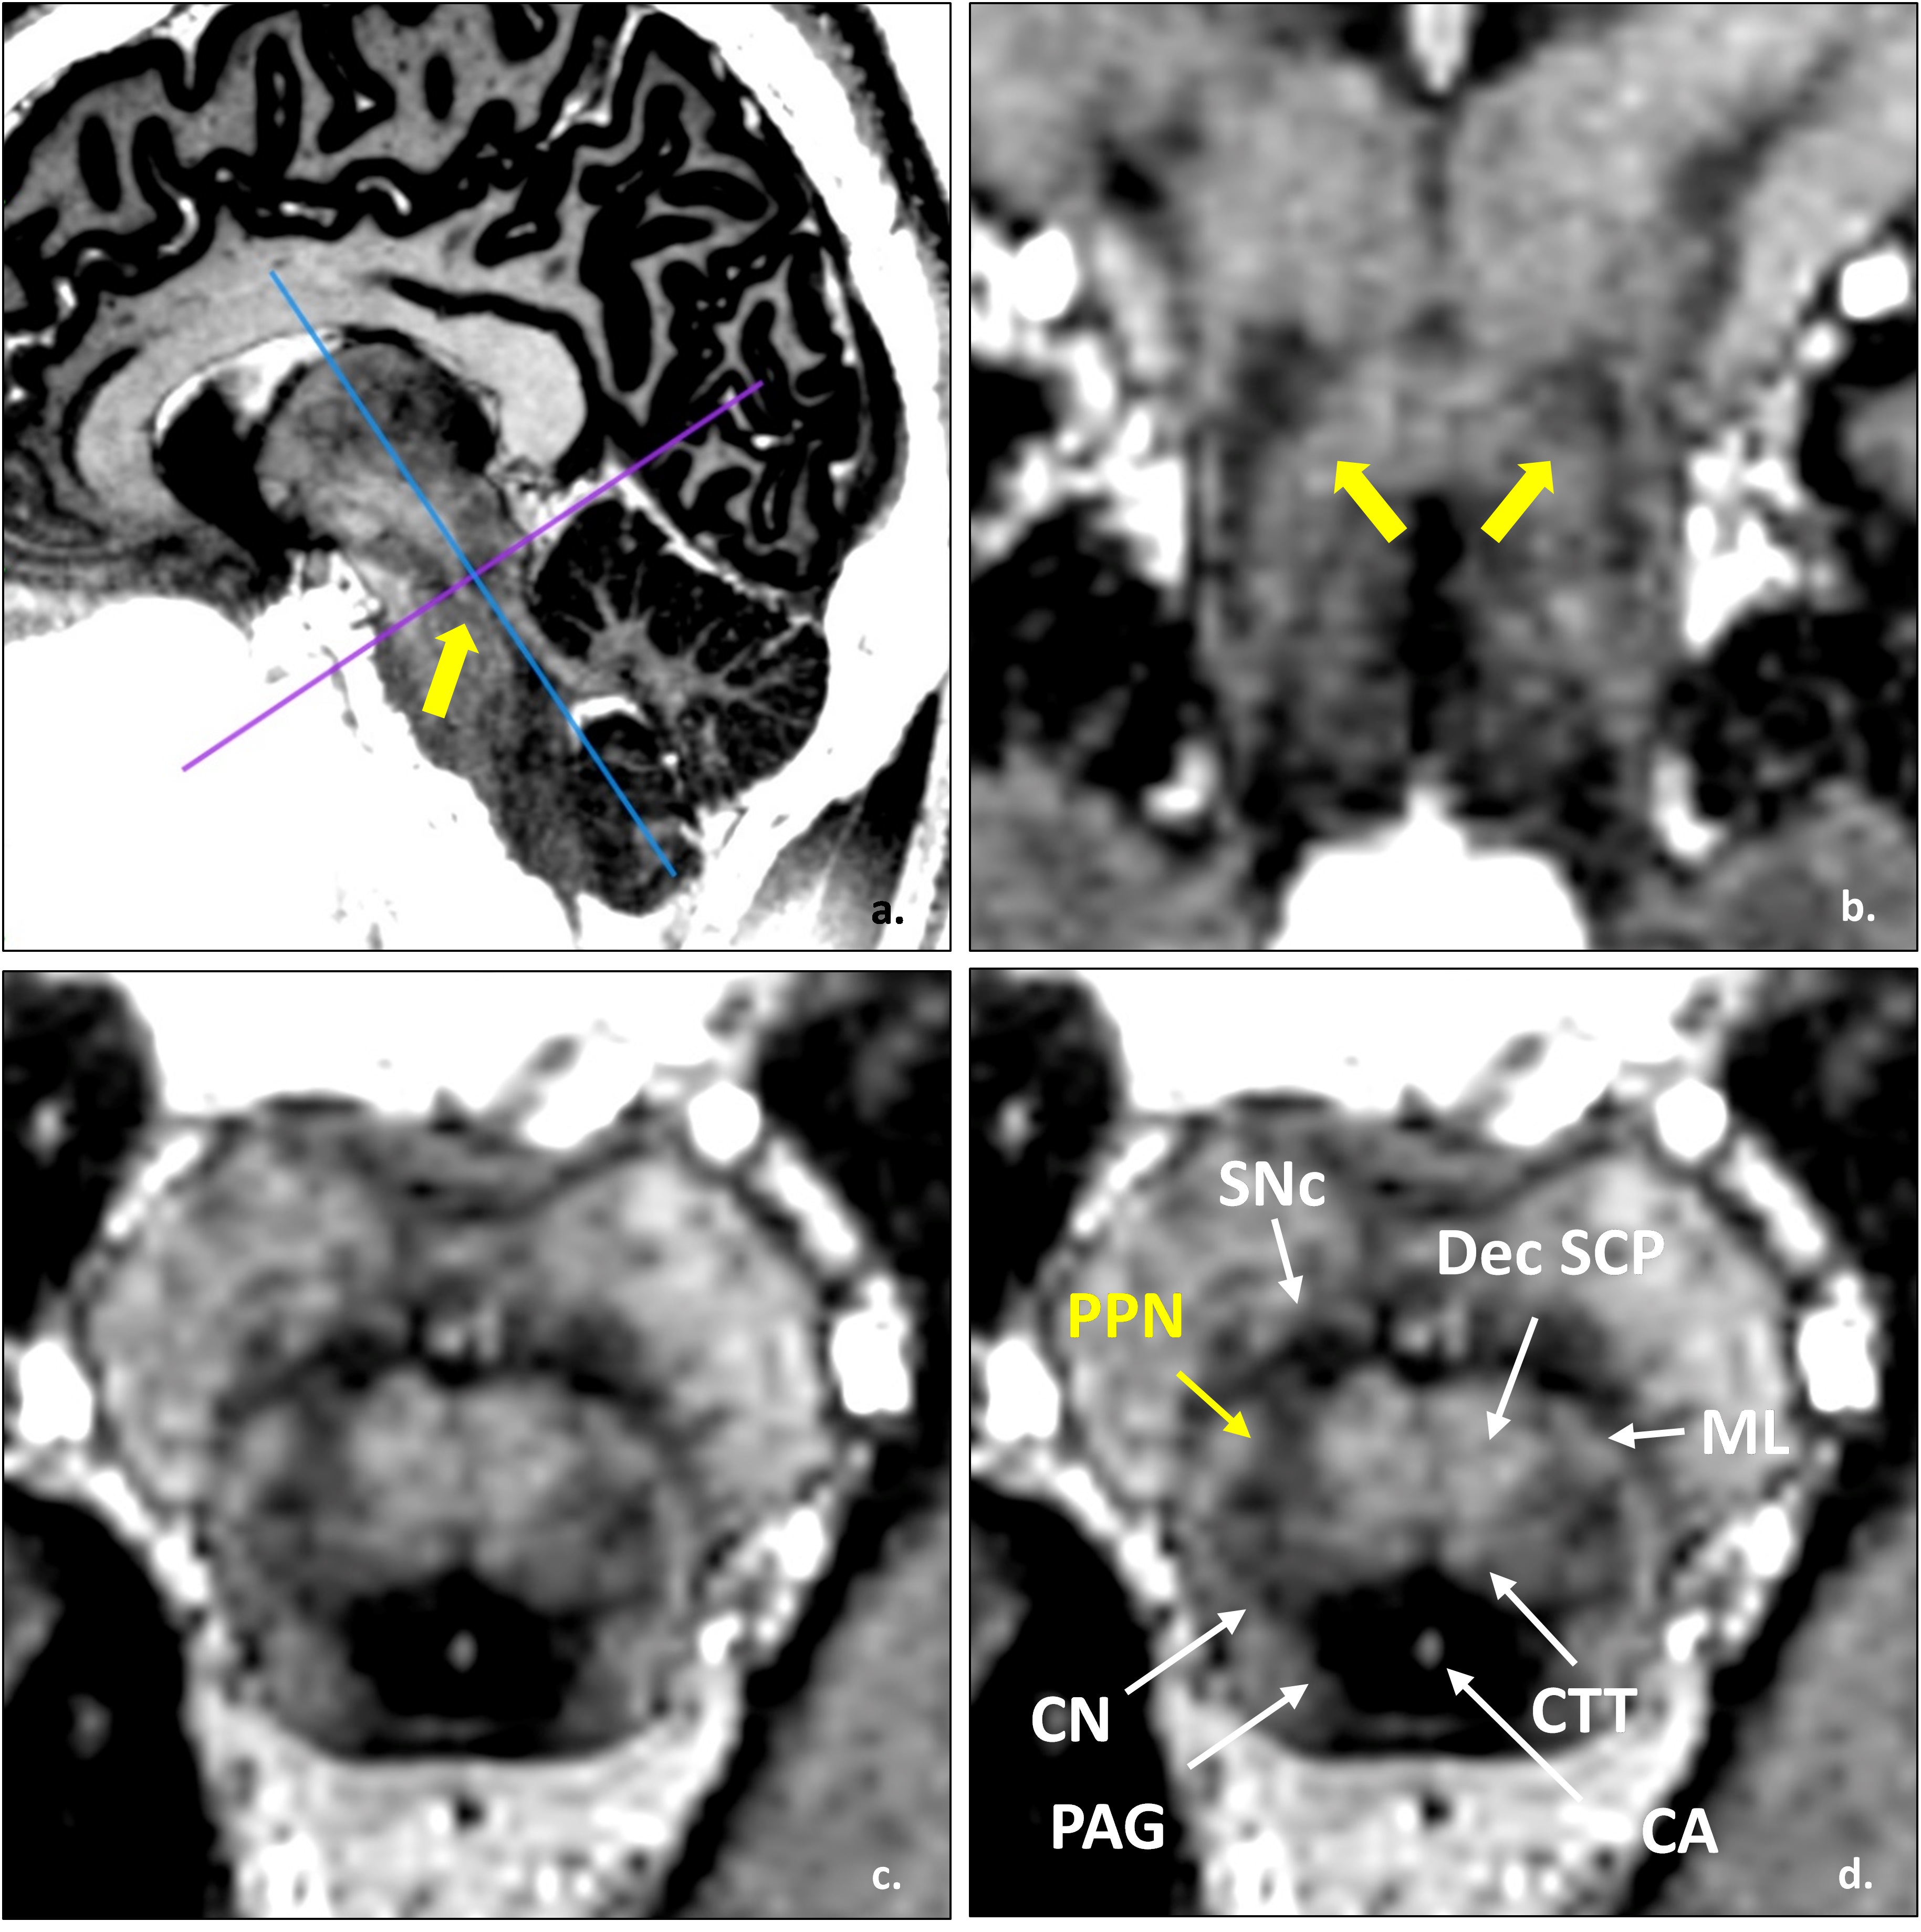
The narrow boomerang shape PPN could be seen from Figure 1, it is located at the anterolateral of the pons, and confined by Dec SCP, CTT and ML. And other fine structures such as cerebral aqueduct (CA), periaqueductal gray (PAG), substantial nigra pars compacta (SNc) and cuneiform nucleus (CN) also could been seen directly from the image. The measurement mean and standard error deviation details listed in Table 1 and Table 2. Note that from Figure 2 c, at middle slice of coronal, PPN showed oblique inverted triangle shape, so the superior point might be coinciding with left or right point. The measurement had results consistent with paper [5] and small variance.The fiber tracking results were displayed as Figure 3, the directly identified PPN at MP2RAGE (Figure 3 a) was registration and resample into diffusion image space (Figure 3 b), with the start points, end points and path ways, the fiber of Dec SCP, ML and CTT were reconstructed, and the outline of PPN were project into the fibers (Figure 3 c, d, e), note that the imaging PPN located centered at the Dec SCP, ML and CTT.Conclusion and discussion
High resolution followed the high field and SNR, that was the key reasons why the PPN could be visible directly at 7T. In order to verify the results, manually measurement and key structure reconstruction around the PPN were used. The measurement results agreed with the paper [5] report, and with the help of clear boundary information, the number of measurement points increased from 2 of the paper [5] to 6 of our works, this promotion not only could be used in image results verification, but also offer a more precisely delineation of the outline of PPN. The fiber tracking method, which benefitting by the strong gradient of scanner and simultaneous multiple slice technical to reduce the scan time but no data quality losing, was used to reconstruct the key structure around the PPN, the directly identified PPN at high MP2RAGE image could locate the center between the reconstruct Dec SCP, ML and CTT, this also confirmed the PPN locating result. The PPN location at 7T with high resolution MP2RAGE sequence, could offer an accurate PPN location results, bring the benefits for DBS nucleus preoperative localization.Acknowledgements
We thank Jing An (Siemens Shenzhen MR Ltd.) for her technical assistance. This work was supported in part by Chinese MOST grants (2015CB351701, 2012CB825500), NSFC grant (91132302), and CAS grants (XDB02010001, XDB02050001).References
1. Fournier-Gosselin, M.-P., et al., Regional anatomy of the pedunculopontine nucleus: Relevance for deep brain stimulation. Movement Disorders, 2013. 28(10): p. 1330-1336.
2. Marques, J.P., et al., MP2RAGE, a self bias-field corrected sequence for improved segmentation and T1-mapping at high field. NeuroImage, 2010. 49(2): p. 1271-1281.
3. Sotiropoulos SN, Jbabdi S, Xu J, Andersson JL, Moeller S, Auerbach EJ, Glasser MF, Hernandez M, Sapiro G, Jenkinson M, Feinberg DA, Yacoub E, Lenglet C, Van Essen DC, Ugurbil K, Behrens TEJ. Advances in diffusion MRI acquisition and processing in the Human Connectome Project. NeuroImage 2013;80:125-143.
4. Yeh F-C, Wedeen VJ, Tseng W-YI. Generalized-sampling imaging. Medical Imaging, IEEE Transactions on 2010;29(9):1626-1635.
5. Zrinzo, L., et al., Stereotactic localization of the human pedunculopontine nucleus: atlas-based coordinates and validation of a magnetic resonance imaging protocol for direct localization. Brain, 2008. 131(6): p. 1588-1598.
Figures