2571
Mapping the Neurological Effect of Soman, a Chemical Warfare Nerve Agent, using 9.4T MRI1Radiology, University of Calgary, Calgary, AB, Canada, 2National Defence, Defence Research And Development Canada, Suffield, AB, Canada
Synopsis
Soman is a chemical warfare nerve agent that is categorized as a weapon of mass destruction. Nerve agents are potent irreversible inhibitors of acetylcholinesterase and exposure can be extremely lethal. At a sub-lethal dose, our understanding of the neurological effect is limited. To understand the soman associated physiological changes, MRI was used to quantify the cerebral blood flow after a convulsive dose of soman.
Purpose
Soman is a highly toxic chemical warfare nerve agent (NA) that has been categorized as a weapon of mass destruction and banned by the United Nations. Despite being banned, there has been a rise in the usage of chemical weapons with escalating conflicts in the Middle East. In August 2013, NA was released on Syrian civilians causing mass casulties1. NAs are irreversible acetylcholinesterase inhibitors that cause excess acetylcholine to accumulate in the neuronal synapse and neuromuscular junction2. Although the cause of death with lethal exposure to NA is understood, there is limited understanding of the neurological impact of a sub-lethal dose. NA induced convulsive seizures can cause extensive neurological damage3. The objective of this study was to quantify cerebral blood flow (CBF) with MRI, 1 hour after a convulsive dose of soman, to improve our understanding of the physiological changes associated with exposure.Methods
This research was conducted in accordance with the Canadian Council on Animal Care guidelines, under protocols approved by the University of Calgary Animal Care Committee. Male Sprague-Dawley rats, weighing 200-300g, were obtained from Charles-River. Imaging Time Points: Control images were taken at least 24 hours prior to soman injection (n=8). Each animal was then imaged 18-22 hours after soman injection (n=10). Pretreatment: 30 minutes prior to soman injection, 125mg/kg of HI-6 dimethansulfonate (DMS) and 20mg/kg of atropine methyl nitrate (AMN) were injected intraperitoneally (ip) to reduce mortality from excess mucous secretion. Soman Injection: 90μg/kg of soman was injected subcutaneously over the scapular region into the loose skin of the neck in isoflurane-anaesthetized animals. Following soman administration animals rapidly awoke from anaesthesia and signs of soman poisoning were first noted between 3 and 5 minutes post dosing. Every animal had convulsions within 10 minutes after injection. Post treatment: Up to an additional three doses of HI-6 and AMN (ip) were given post soman exposure every 20 minutes. MRI Parameter: MRI was performed on isoflurane anaesthetized rodents in vivo on a 9.4T Bruker Avance console with a 35mm volume coil. (Continuous arterial spin labeling (cASL): TE/TR: 2.66/3000 ms, averages: 16, RARE factor=36, FOV= 30x30 mm, matrix= 128x128, voxel size: 0.23x0.23x1mm).Results
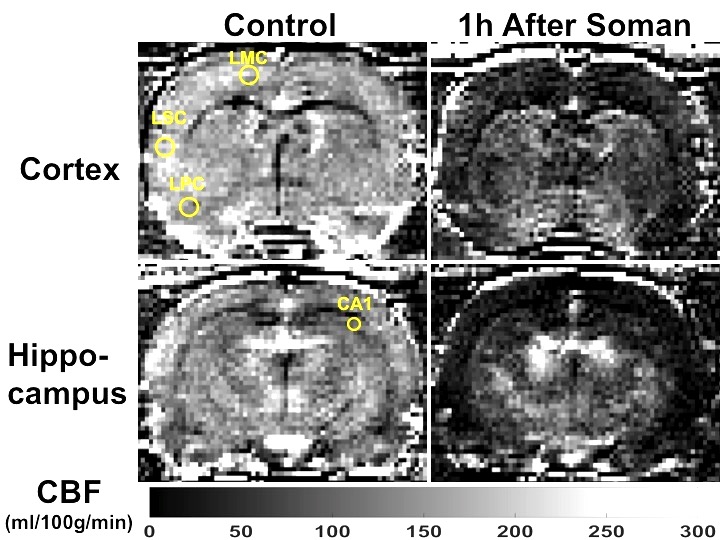
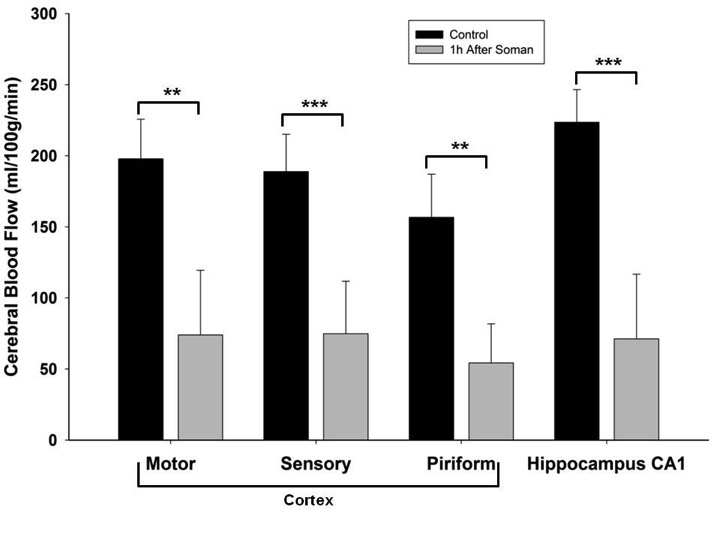
Qualitatively, 1h after soman injection, hypoperfusion can be seen throughout the brain (Fig. 1). Quantification of CBF shows significantly reduced blood flow in every region of interest (left motor cortex, left piriform cortex: p<0.01, paired t-test, n=8) (Hippocampus CA1 and left sensory cortex: p<0.001, paired t-test, n=8) (Fig. 2). The relative decline in CBF from control was: Motor cortex: 65%, Sensory cortex: 70%, Piriform cortex: 64%, and Hippocampus CA1: 77%.Discussion
It has been reported that soman induced convulsions cause an increase in cerebral blood flow (CBF)4-5 and metabolism5. In this study, we have contrary findings, where we see hypoperfusion in the cortex, piriform cortex, and hippocampus 1 hour after a convulsive dose of soman. Although the hypothesis that ischemia is the cause for soman related neuropathology has been previously discounted, a more in-depth analysis of the changes in neurovascular coupling should be considered. Although isoflurane is a confounder in that it is an anticonvulsant6, it is doubtful this would cause such a dramatic reduction in CBF. Interestingly, a reduced CBF was reported after epileptic seizures in humans7 which may result in hypoxic/ischemic damage. At a convulsive dose, you would expect increased metabolism caused by seizure activity, yet we see a reduced CBF. This suggests a possible impairment of the neurovascular response. The link with seizures and a potential for associated hypoxic/ischemic damage suggests that antiepileptic drugs could be an option for treatment of sub-lethal doses of soman, when seizure activity is noted for many hours past exposure.Conclusion
We have shown highly restricted blood flow 1 hour after a convulsive dose of soman. To the best of our knowledge, this is the first MRI study measuring cerebral blood flow after a convulsive dose of soman and supports the use of anti-epileptic drug treatments associated with stimulating blood flow.Acknowledgements
The authors thank David Rushforth and Tadeusz Foniok at the Experimental Imaging Centre (University of Calgary) for their contribution in operating the MRI. We also thank Thomas Johnson for operating the MRI after hours and image processing.
References
1. Dolgin, E. (2013). "Syrian gas attack reinforces need for better anti-sarin drugs." Nat Med 19(10): 1194-5.
2. Collombet, J. M. (2011). "Nerve agent intoxication: recent neuropathophysiological findings and subsequent impact on medical management prospects." Toxicol Appl Pharmacol 255(3): 229-41.
3. Lallement, G., I. Pernot-Marino, D. Baubichon, M. F. Burckhart, P. Carpentier and G. Blanchet (1994). "Modulation of soman-induced neuropathology with an anticonvulsant regimen." Neuroreport 5(17): 2265-8.
4. Goldman, H., R. F. Berman, J. Hazlett and S. Murphy (1993). "Cerebrovascular responses to soman: time and dose dependent effects." Neurotoxicology 14(4): 469-83.
5. Shih, T. M. and O. U. Scremin (1992). "Cerebral blood flow and metabolism in soman-induced convulsions." Brain Res Bull 28(5): 735-42.
6. Modica, P. A., R. Tempelhoff and P. F. White (1990). "Pro- and anticonvulsant effects of anesthetics (Part I)." Anesth Analg 70(3): 303-15.
7. Leonhardt, G., A. de Greiff, J. Weber, T. Ludwig, H. Wiedemayer, M. Forsting and A. Hufnagel (2005). "Brain perfusion following single seizures." Epilepsia 46(12): 1943-9.
Figures