2565
Evaluation of Whole Brain and ZOOMit T1-weighted Turbo-Spin Echo (TSE) for Visualization of Human Lenticulostriate Arteries at 3.0 T: A Preliminary Study1Neurology, University of Southern California, Los Angeles, CA, United States
Synopsis
Cerebral small vessel disease frequently affects the lenticulostriate arteries, resulting in silent strokes which contribute to progressive cognitive impairment in elderly persons. Recent studies have demonstrated the ability of MRI to non-invasively image these small arteries at 7T; however, ultrahigh magnetic field is not commonly available in clinical practice. This preliminary study evaluates the feasibility of visualizing and characterizing the lenticulostriate arteries using whole-brain and ZOOMit 3D T1-weighted turbo spin-echo at 3T.
Purpose
Cerebral small vessel disease (SVD) leads to cognitive decline and is the most common vascular cause of dementia1. Small arteries, particularly the lenticulostriate arteries (LSAs) are known to be involved in silent strokes, which contribute to progressive cognitive impairment in elderly persons. The LSAs with small diameters of 280-510 µm take origin directly from the high flow middle cerebral artery (MCA), making them especially susceptible to damage2. Recent studies have shown the ability of MRI to non-invasively image these small arteries at 7.0 T 3; however, ultrahigh magnetic field is not commonly available in clinical practice. Recently, a new high-resolution black blood MRI technique has emerged for intracranial vessel wall imaging at 3T using 3D turbo spin-echo (TSE) sequences with variable flip angles (VFA) 4-6. We sought to examine the feasibility of visualizing and characterizing the LSAs using high resolution 3D T1-weighted TSE at 3.0 T.Methods
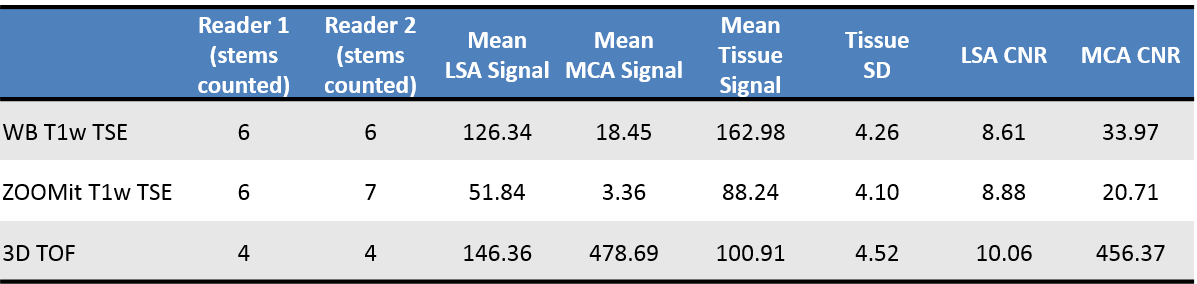
A T1-weighted 3D TSE with VFA (or SPACE on Siemens) was chosen for small vessel imaging due to its high sampling efficiency and good blood suppression properties. Three volunteers (3M, 26.3±2yrs) were scanned on a 3.0 T Siemens Prisma MRI system using a 32-channel head coil. T1-weighted black blood images covering almost the whole brain were acquired from each volunteer using the TSE sequence with the following parameters: FOV = 194mmx230mm, matrix size = 756x896, voxel size = 0.26x0.26x0.5 mm3, bandwidth = 465 Hz/pixel, TE/TR = 10/700ms, ETL=38, GRAPPA rate = 2, scan time = 6:41 minutes. We also tested the feasibility of using ZOOMit parallel transmit technology for selective field-of-view imaging in the TSE sequence with the following parameters: FOV = 78mmx120mm, matrix size = 252x384, voxel size = 0.31x0.31x0.55, bandwidth = 490Hz/pixel, TE/TR = 26/700ms, ETL = 44, 2 averages, scan time = 9:50 minutes. High resolution 3D time of flight (TOF) was performed in one subject to obtain bright blood angiography of the intracranial arteries. The number of stems of the LSAs were counted by two readers blinded to the type of sequence for both TSE and TOF MRA.
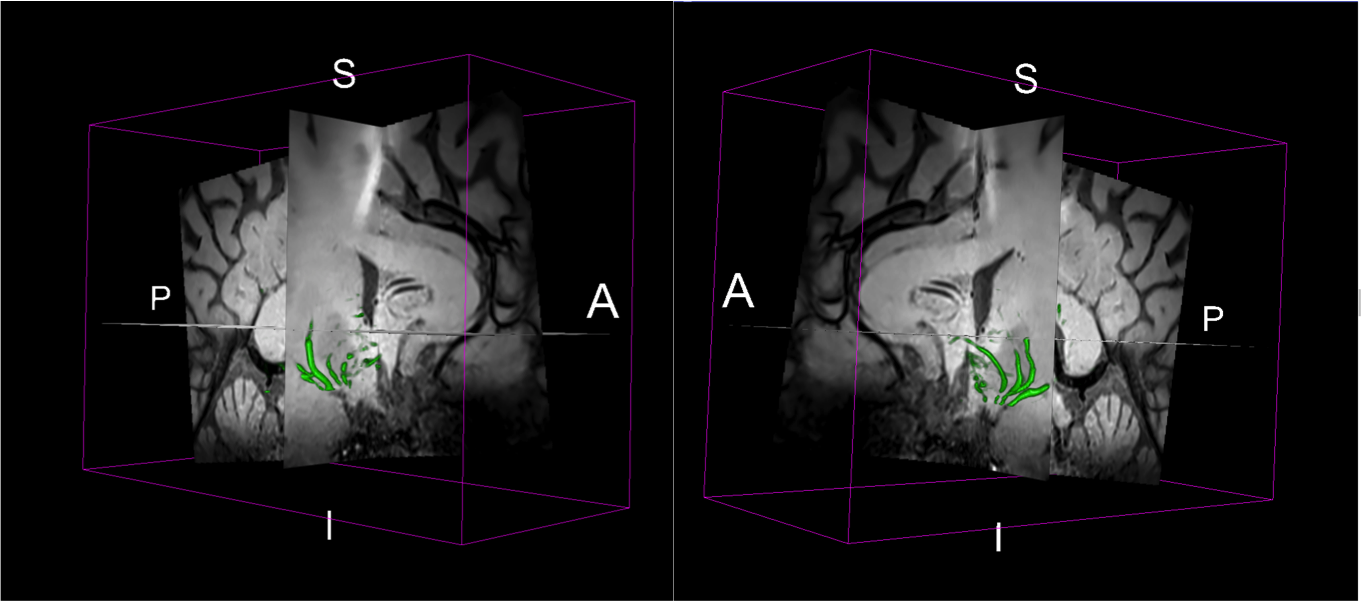
We further developed automated 3D vessel reconstruction algorithms for the segmentation of lenticulostriate arteries. A scalar, vesselness map across the image was computed based on the eigenvalues of the Hessian matrix at each voxel7. The basal ganglia structures were segmented from MRI for the computation of the vesselness map. Finally, we applied anisotropic diffusion to the TSE MRI and generated a 3D rendering of the detected perforating arteries8.
Results and Discussion
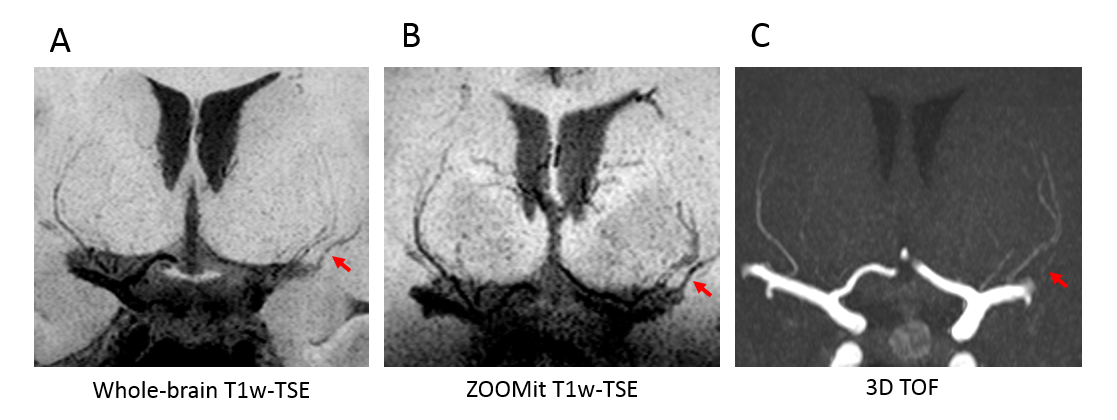
Images delineating the LSAs in one volunteer using minimum intensity projection across 9.8 mm slices are shown in Fig. 1A and B for whole-brain and ZOOMit T1-weighted TSE, respectively. The standard 3D TOF MRA with maximum intensity projection across 9.8mm slices is shown in Fig. 1C. The total number of stems counted by the two readers of the subject with all 3 scans is listed in Table 1 along with the measured contrast-to-noise ratios (CNR) for blood in the LSAs and in the MCA versus the surrounding white matter. Although the CNR for small arteries is higher in TOF MRA, more LSAs can be visualized in both whole-brain and ZOOMit TSE images than in 3D TOF. The CNR of MCA and surrounding tissue is excessively higher in TOF, while T1-weighted TSE has moderate CNR for large vessels. In contrast, the CNR of LSAs versus surrounding white matter is comparable between TSE and TOF MRA. The large drop of CNR from large to small vessels suggests that slow flowing blood in LSAs is heavily saturated in TOF MRA, whereas T1-weighted TSE is able to preserve the black blood contrast for slow flowing blood in LSAs.
ZOOMit T1-weighted TSE is a promising method for high resolution imaging within a small FOV. The 3D rendering of the detected perforating arteries based on the vesselness map of ZOOMit TSE for another volunteer is shown in Fig. 2, indicating the feasibility of automatic segmentation and characterization of the LSAs using T1-weighted TSE. Compared to TOF, the whole brain TSE has the advantage of simultaneous evaluation of the vessel wall of large arteries as well as the geometry of small vessels. Further optimization of both the TSE sequence and segmentation algorithms is needed to reliably visualize and quantify the geometry of the LSAs.
Conclusion
This preliminary study demonstrated the feasibility for visualizing LSAs on the order of 280-510 µm in the human brain using T1-weighted TSE at 3.0 T. This would enable the possibility of a more comprehensive non-invasive evaluation of cerebral small vessel diseases using clinical scanners.Acknowledgements
This study was supported by the US National Institutes of Health grant UH2NS100614.References
1. Wardlaw JM, Smith EE, Biessels GJ, et al. Neuroimaging standards for research into small vessel disease and its contribution to ageing and neurodegeneration. Lancet Neurology. 2013;12(8):822-838. doi:10.1016/S1474-4422(13)70124-8.2. http://stroke.ahajournals.org/content/39/5/1604
2. Marinkovic SV, Milisavljevic MM, Kovacevic MS, and Stevic ZD. Perforating Branches of the Middle Cerebral Artery: Microanatomy and Clinical Significance of their intracerebral segments. Stroke. 1985; 16(6):1022-29.
3. Kang, C.-K., Park, C.-W., Han, J.-Y., Kim, S.-H., Park, C.-A., Kim, K.-N., Hong, S.-M., Kim, Y.-B., Lee, K. H. and Cho, Z.-H. (2009), Imaging and analysis of lenticulostriate arteries using 7.0-Tesla magnetic resonance angiography. Magn. Reson. Med., 61: 136–144. doi:10.1002/mrm.21786
4. Qiao Y, Steinman DA, Qin Q, et al. Intracranial arterial wall imaging using three-dimensional high isotropic resolution black blood MRI at 3.0 Tesla. J Magn Reson Imaging 2011;34:22-30.
5. Qiao Y, Zeiler SR, Mirbagheri S, et al. Intracranial plaque enhancement in patients with cerebrovascular events on high-spatial-resolution MR images. Radiology 2014;271:534-542.
6. Fan Z, Yang Q, Deng Z, et al. Whole-brain intracranial vessel wall imaging at 3 Tesla using cerebrospinal fluid-attenuated T1-weighted 3D turbo spin echo. Magn Reson Med 2016.
7. Frangi AF, Niessen WJ, Vincken KL, Viergever MA. Multiscale vessel enhancement filtering. In: W.M. Wells ACaSLD, ed. Lecture Notes in Computer Science. Berlin, Germany: Springer Verlag, 1998: 130-137.
8. Perona P, Malik J. Scale-space and edge detection using anisotropic diffusion. IEEE Trans Pattern Analysis and Machine Intelligence 1990;12:629-639.
Figures