2564
Brain Structural Alterations in Obese Adults with Impulsive Personality Traits: A Voxel-Based Morphometry Study1Department of MRI, The First Affiliated Hospital of Zhengzhou University, Zhengzhou, People's Republic of China, 2MR Research China, GE Healthcare, Beijing, People's Republic of China, 3Peking University, Beijing, People's Republic of China
Synopsis
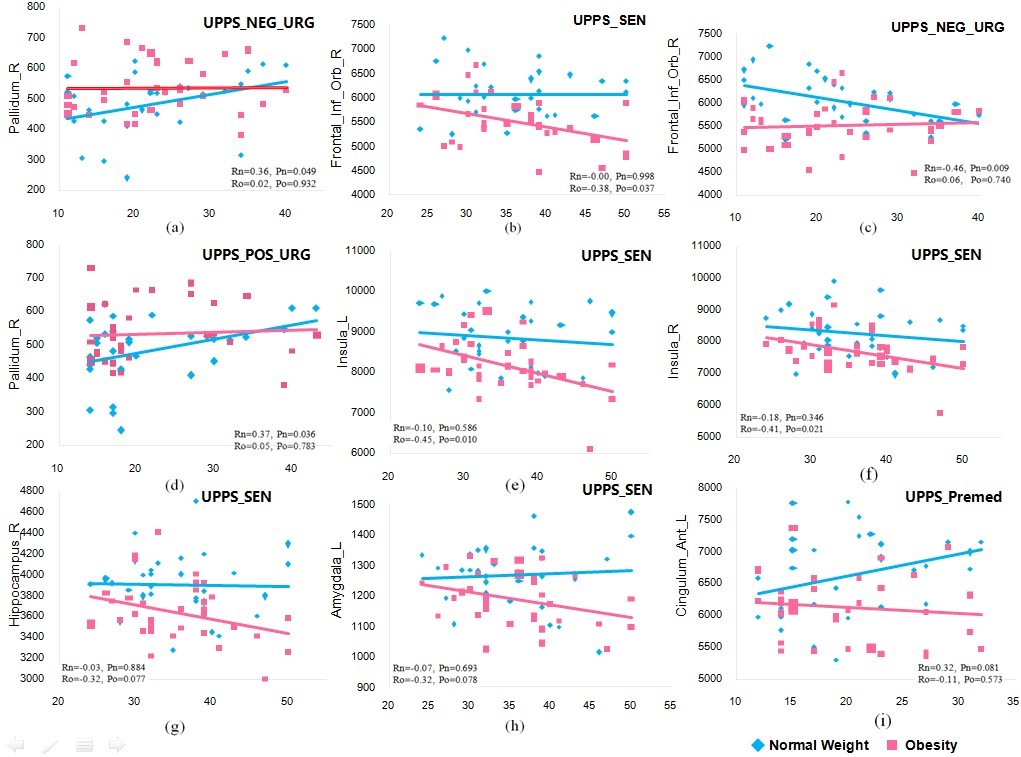
This study used voxel-based morphometry method to examine gray matter volume alterations related to impulsive personality traits in obese individuals relative to controls. 62 adolescents completed the UPPS-P Impulsive Behavior Scale were analyzed. Possible GM volume alterations were firstly analyzed at the whole brain range. The relationship of regional GM volumes with UPPS-P scores were examined in selective regions of interest. This study demonstrated that sensation seeking behavior in obese people negatively correlate with GM volumes of amygdala, OFC, hippocampus, and insula indicate high sensitivity to food cues in adult obesity that link to certain alternations of the brain structure.
Purpose
Obesity is a major health hazard of modern society and promotes co-morbid diseases such as heart disease, obstructive sleep apnea, certain types of cancer, and osteoarthritis[1,2]. The objectives of this investigation were (i) to use voxel-based morphometry (VBM) analyses to examine possible GM changes in obese individuals as compared to the normal weight group; and (ii) to measure differences in GM volumes specifically related to impulsive personality in obese individuals vs. controls.Method
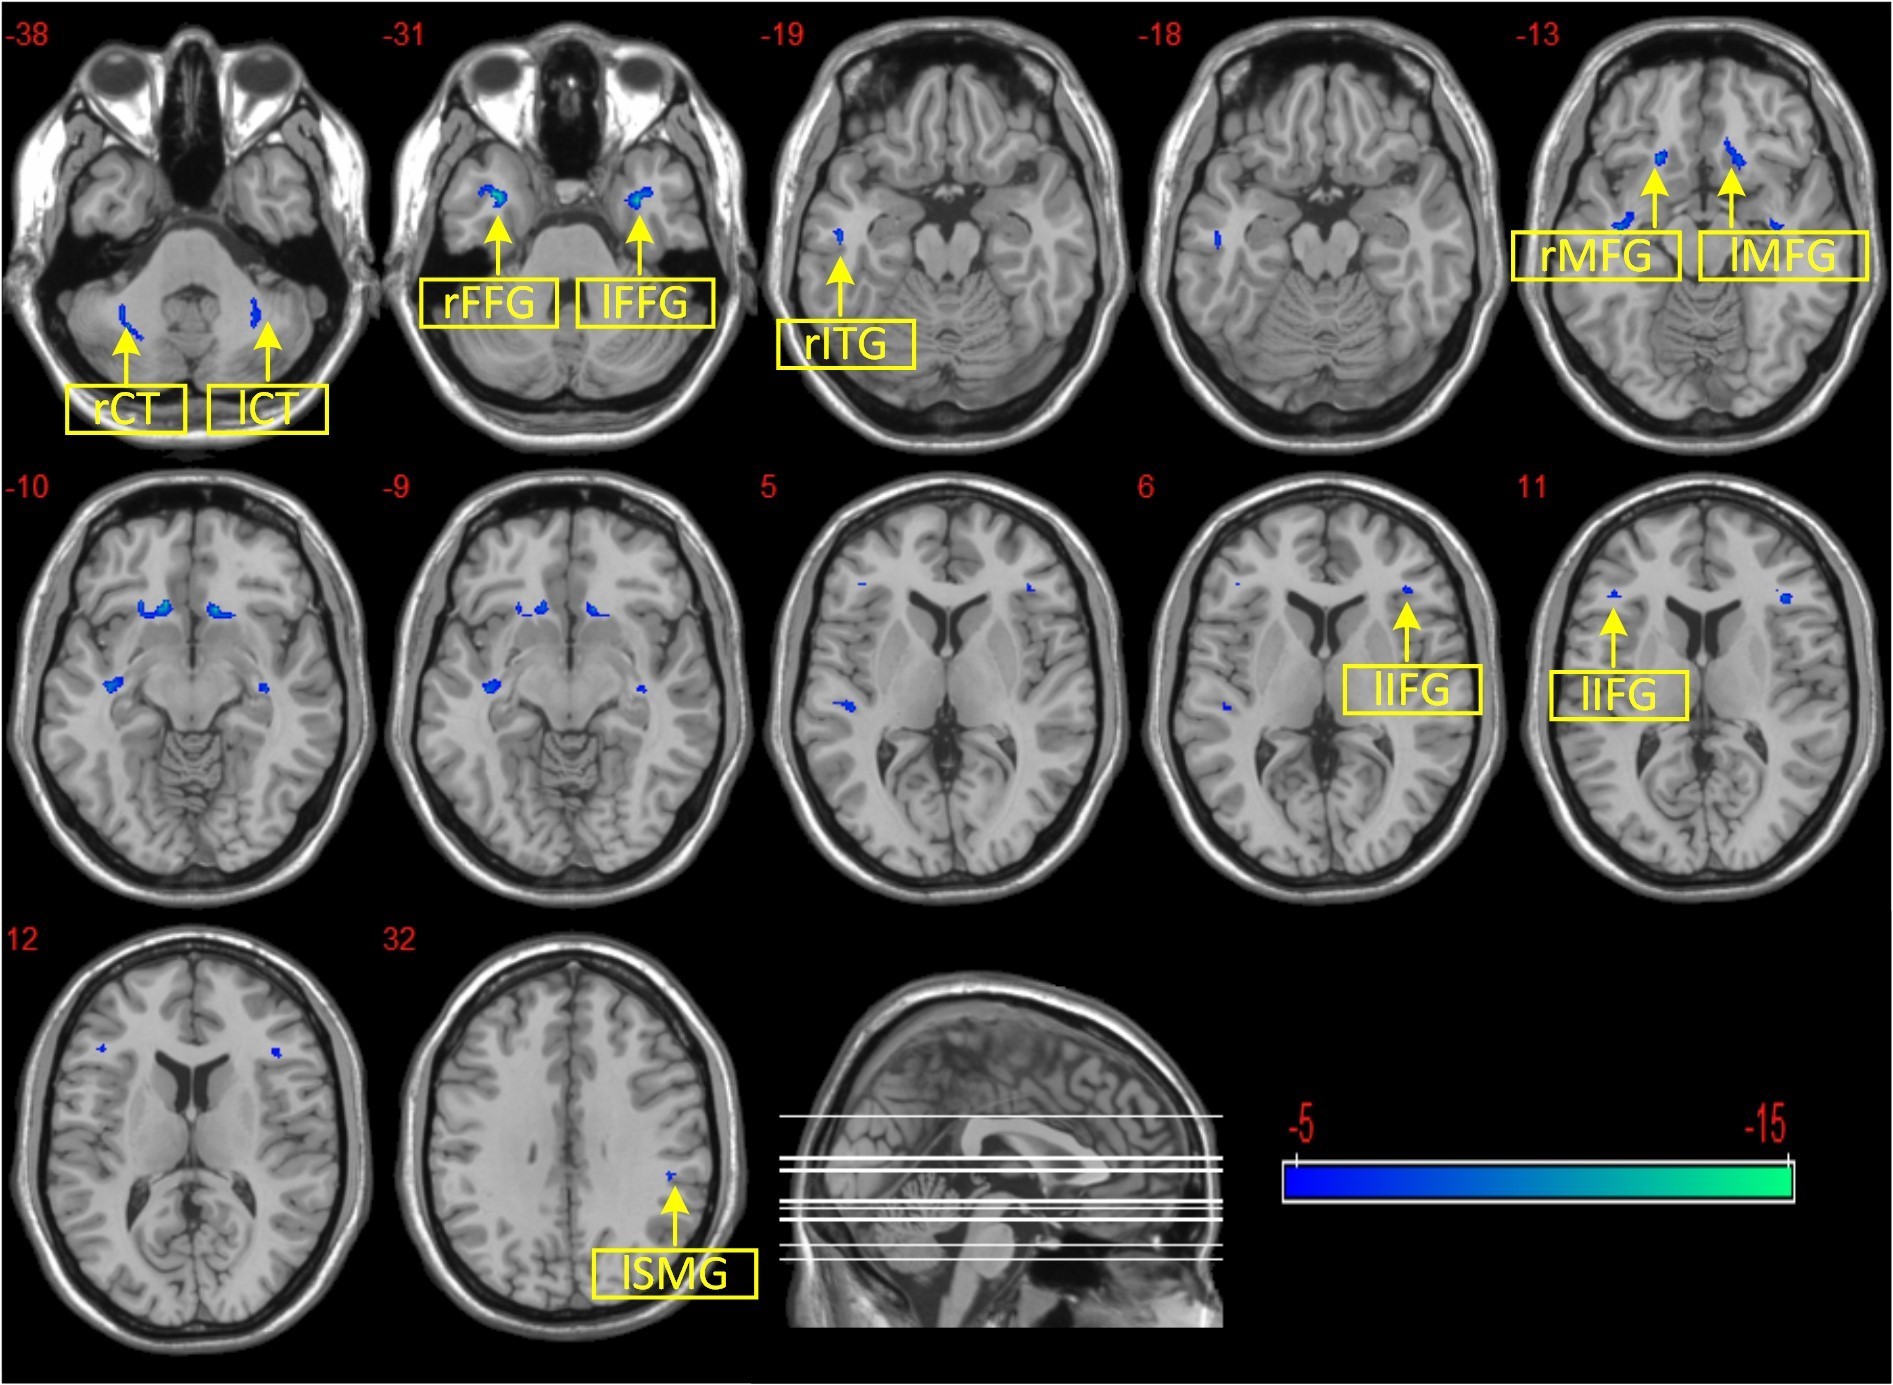
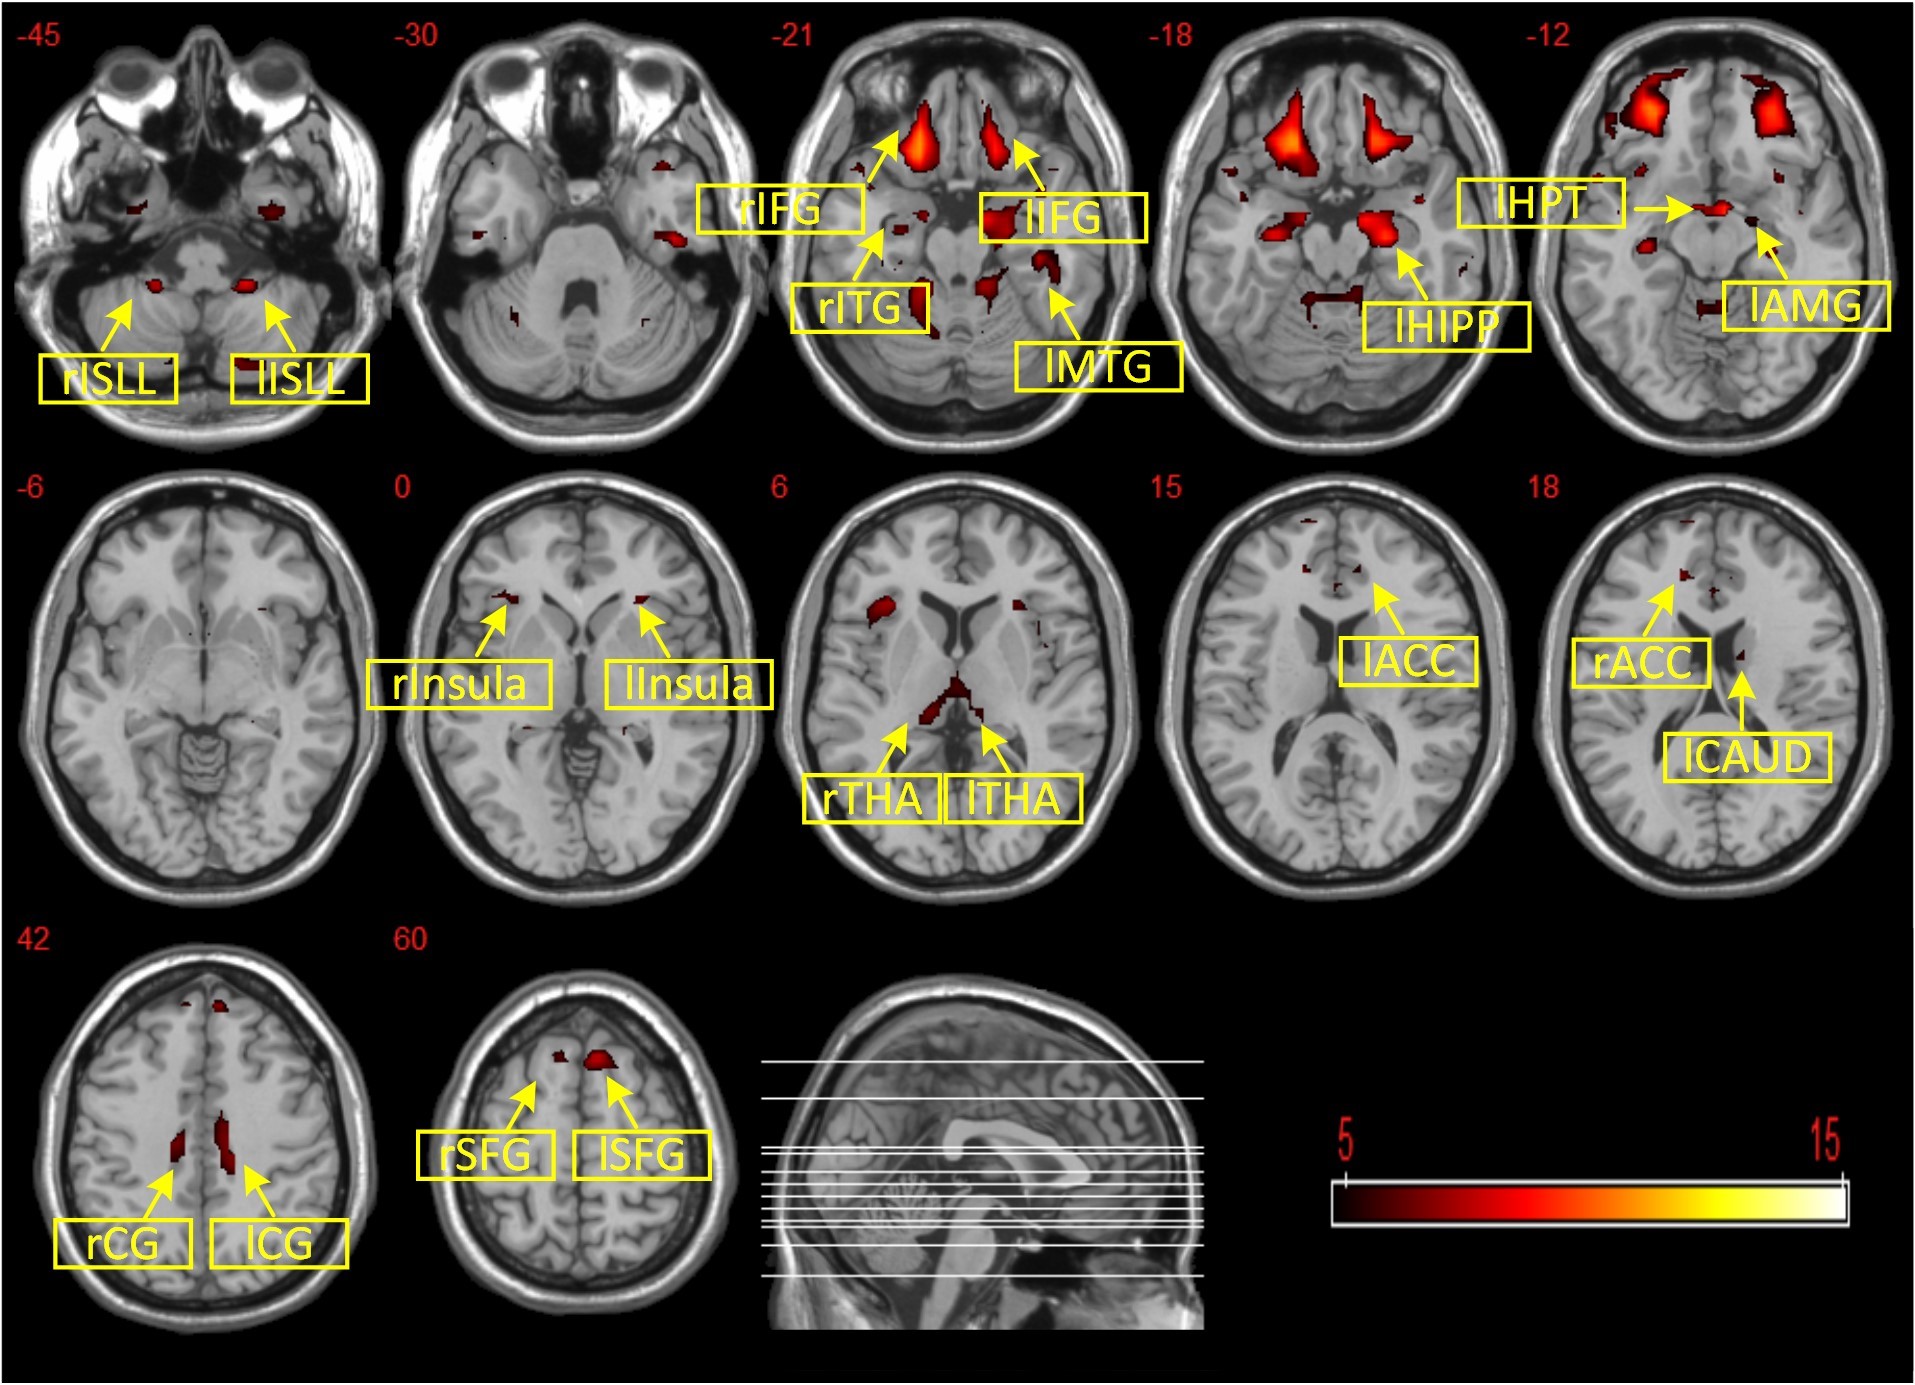
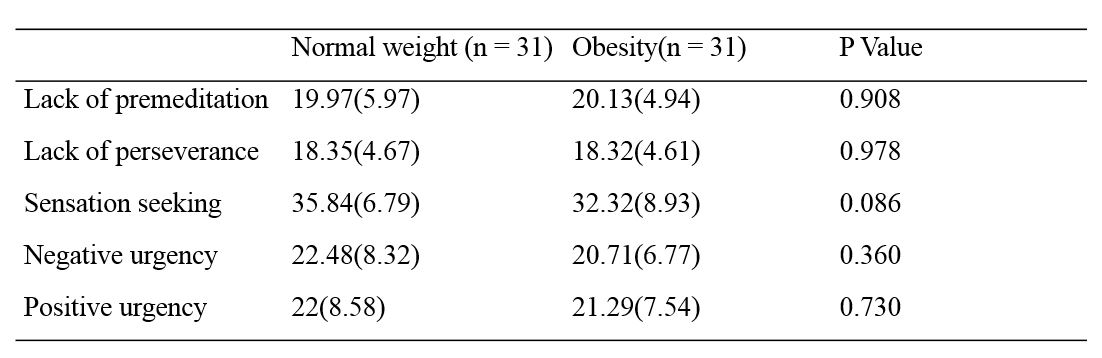
A total of 62 subjects completed the UPPS-P Impulsive Behavior Scale were selected in this study including 31 obesity adults (mean BMI= 33.35, SD= 4.86) and 31 healthy controls with normal weight (mean BMI= 22.35, SD = 1.74). All T1-weighted images acquired on a 3T MR scanner were pre-processed and analyzed using statistical parametric mapping 8 (SPM8) (http: //www.fil.ion.ucl. ac.uk/spm). Structure images of each subject were first spatially normalized to the standard T1 Montreal Neurological Institute template and segmented into gray matter (GM), white matter (WM) and cerebrospinal fluid (CSF) using the tissue classification algorithm in SPM8. Secondly, the segmented partitions were subsequently normalized to their respective standard templates. Then, images were smoothed with a 3-D Gaussian filter of 8 mm3 full width at half maximum (FWHM) to increase signal to noise ratio. Finally, two groups of subjects, the normal weight (BMI < 25) and the obese (BMI > 30), were assessed for the GM volume values. The voxel-wise two-sample t-tests (FDR corrected) were performed to compare the group differences in GM volumes.Results
Discussion
In this study, the difference in brain structure between obese and normal weight individuals were examined, and the relationship between the neuroanatomical changes and impulsivity traits were explored. Imaging analysis found a significant group difference in the brain regions modulating impulsivity such as left hippocampus, bilateral middle cingulate cortex, bilateral ACC, left insula and left amygdala, bilateral OFC. In addition, the changes in GM volumes in the right OFC, bilateral insula right hippocampus and left amygdala were mostly associated to sensation seeking. Specifically, the obese group had augmented GM volumes in the insula, but lower GM volumes in the OFC than the normal weight controls. Previous studies have demonstrated that the anterior and mid-insula cortex are involved in processing the smell, taste, texture, viscosity and fat content of foods [3]. The finding of an increased left hippocampal volume in obese adolescents is consistent with previous studies [4]. Hippocampus is important for memories of foods or the rewarding consequences of eating in the processing of appetite-related motivational signals.Conclusion
In conclusion, the current study explored possible structural alternations in obese subjects as compared to normal weight controls, and examined the link between impulsivity (as measured by UPPS-P) and the altered regional GM volumes. This study demonstrates an apparent association between high sensitivity to food cues in adult obesity and the neural degradation of brain structures important for food processing.Acknowledgements
NoneReferences
[4] Widya, R. L. et al. Increased amygdalar and hippocampal volumes in elderly obese individuals with or at risk of cardiovascular disease. Am J Clin Nutr 93, 1190-1195, doi:10.3945/ajcn.110.006304 (2011).
Figures