2562
Tract Based Whole Brain White Matter Analysis using Diffusion Basis Spectrum Imaging in Multiple Sclerosis1Radiology, Washington University in Saint Louis, Saint Louis, MO, United States, 2Neurology, Washington University in Saint Louis, Saint Louis, MO, United States
Synopsis
Axon injury and loss, demyelination, and inflammation are the primary pathologies in multiple sclerosis (MS). However, the roles that these individual pathological processes play in MS progression are still ill defined. To investigate whole brain white matter (WM) changes, diffusion tensor imaging (DTI) and diffusion basis spectrum imaging (DBSI) were analyzed on Tract Based Spatial Statistics (TBSS) skeleton template. Both whole brain voxel-based group analysis and regional correlation analysis at the corpus callosum supported that DBSI metrics were able to quantitatively assess the white matter alterations. DBSI could be useful for quantitatively monitoring MS patient treatment and assessing neuroprotective therapies.
Introduction
Multiple sclerosis (MS) is characterized by inflammatory demyelination and irreversible axonal injury leading in many cases to permanent neurological disabilities. However the roles that these individual pathological processes play in MS progression are still unclear. To investigate whole brain WM changes with particular focus on axons, we compared primary progressive (PPMS) and secondary progressive (SPMS) patients to healthy controls (HC) using DBSI. DBSI can quantitatively distinguish isotropic from anisotropic diffusion.1,2 The multiple isotropic and anisotropic diffusion components distinguished by DBSI within WM quantitatively represent cells (restricted isotropic) and edema/tissue loss (non-restricted isotropic), and axon fibers (anisotropic content). TBSS is a commonly used approach to whole-brain WM analysis because of its use of a reliable WM skeleton template to avoid registration errors. Here, we applied DBSI analysis on a TBSS skeleton for comparisons between groups, and correlated DBSI results within the corpus callosum to clinical test scores.3Methods
Human Subjects
Procedures involving human subjects were all approved by the Institutional Review Board of Washington University. Every subject provided informed consent before their participation in the study. Sixteen PPMS, sixteen SPMS patients and eleven normal controls were included.
Clinical measures
All 32 MS patients and the 11 controls completed extensive clinical tests including: Symbol Digit Modalities Test (SDMT), 9-Hole Peg Test (9-HPT), Timed 25-Foot Walk (T25FW), and two second and three second Paced Auditory Serial Addition Test (PASAT2 and PASAT3).
DBSI
All subjects underwent diffusion weighted MRI at 3.0T using a multi-b value diffusion weighting scheme (Trio; Siemens, Erlangen, Germany). Diffusion-weighted images (DWIs) were collected with a 99 directions multi-b value diffusion scheme by single-shot spin-echo echo planar imaging sequence with the following key parameters: voxel size = 2×2×2 mm3; Maximum b-value = 1500 s/mm2; acquisition time = 15 minutes. DTI and DBSI were computed using the in-house software developed using Matlab.
TBSS
Whole brain voxel-wise analysis of DTI and DBSI data were carried out based on TBSS, part of FSL. DTI and DBSI indices were projected onto this skeleton for statistical analyses. Nonparametric permutation tests were used for voxel-wise statistical analysis of the skeletons between healthy controls and MS patients. The significance threshold for group differences was set at p < 0.05. Thresholding was corrected for multiple comparisons across voxels by using the threshold-free cluster-enhancement option of the tool RANDOMIZE in FSL.
Data analysis
Standard Regions of Interest (ROI) of the corpus callosum for each participant were selected based on the Johns Hopkins University (JHU) MNI template White Matter Parcellation Map (WMPM). Quantitative measurements of diffusion metrics were compared between groups and also correlated to clinical measures.
Results
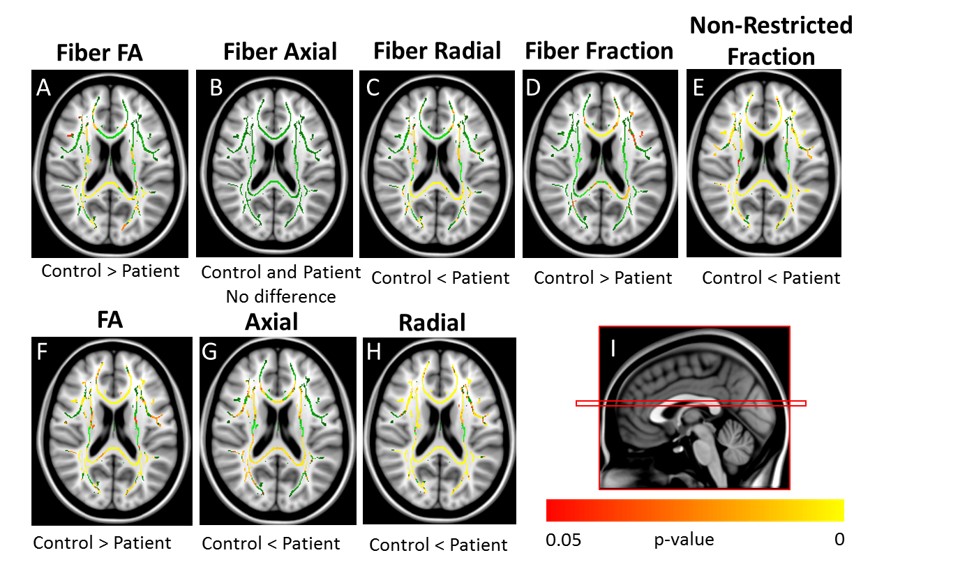
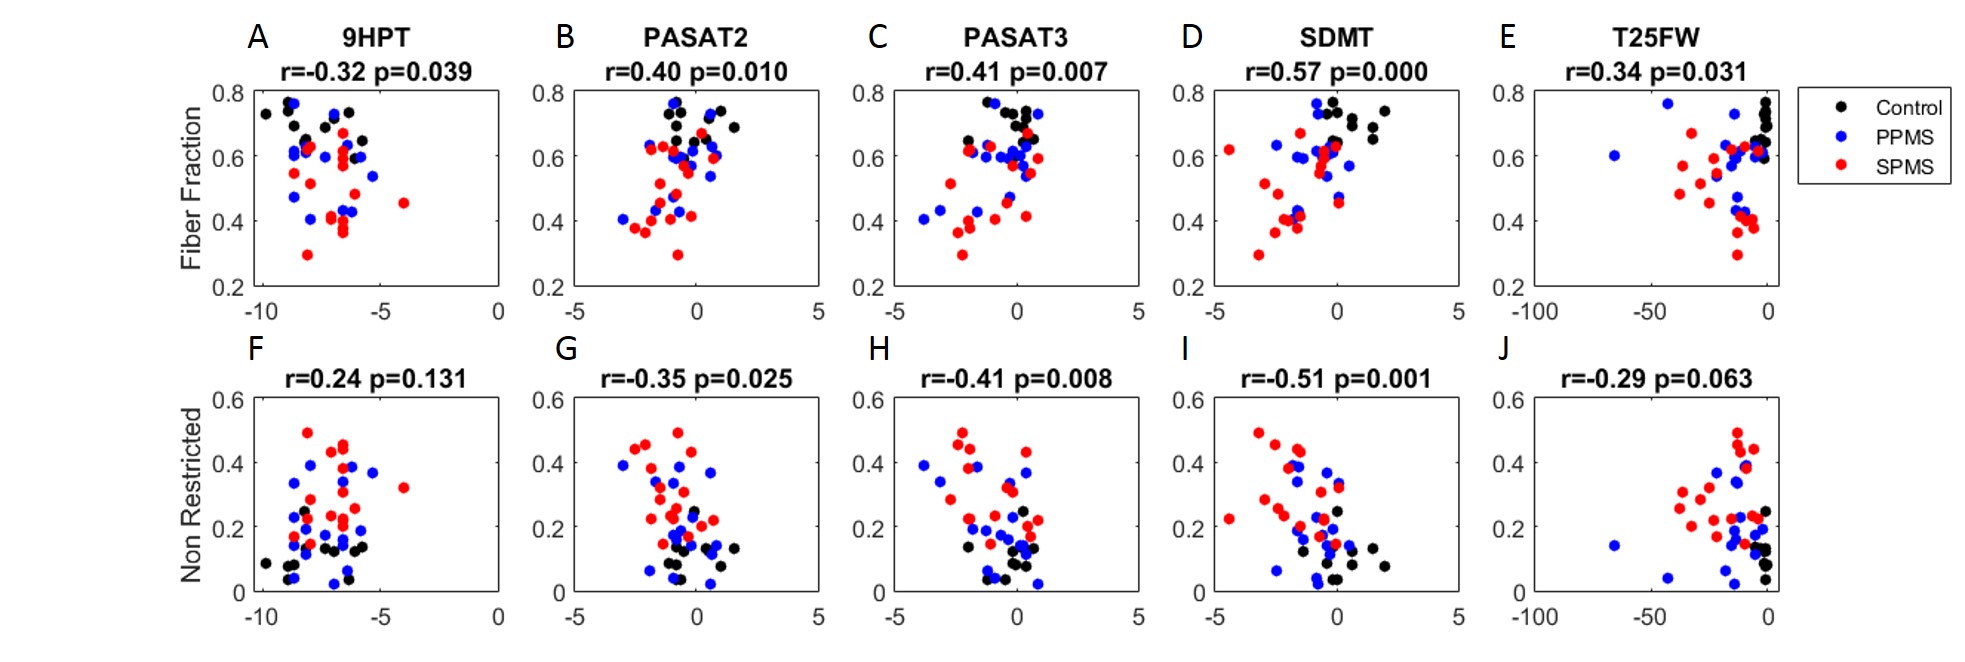
Voxel-based DTI and DBSI metrics based on TBSS found abnormal diffusion changes in widespread WM regions in MS patients (Fig 1). DTI revealed increased AD and increased RD in whole-brain WM in MS patients compared with controls. Using DBSI, increased non-restricted isotropic fraction was observed, as was reduction in fiber fraction, both of which suggested axonal loss, especially within the corpus callosum. DBSI also showed increased RD, suggesting demyelination, in many WM regions. Regional statistical analysis of DBSI from all groups at corpus callosum confirmed these observations (Fig 2). Correlations between clinical tests and diffusion metrics in the region of corpus callosum were assessed (Fig 3). Reduced fiber fraction and increased non-restricted isotropic fraction each correlated well with worse clinical measures. These results are consistent with the known functional anatomy of the corpus callosum.Conclusions
TBSS-based DBSI was applied to assess whole-brain WM tract integrity in PPMS and SPMS patients in comparison to healthy controls. DBSI suggested that axonal loss, along with edema/tissue loss in both PPMS and SPMS patients, confounded results obtained using DTI. The correlations of DBSI fiber fraction and non-restricted isotropic fraction of the corpus callosum with clinical tests suggest that DBSI may be useful for quantitatively monitoring the CNS pathology of individual MS patients and also might be useful in assessing potential neuroprotective or neuroreparative therapies in clinical trials.Acknowledgements
Supported by the NIH P01 NS059560.References
[1] Wang, Y., et al., Differentiation and quantification of inflammation, demyelination and axon injury or loss in multiple sclerosis. Brain, 2015. 138(Pt 5): p. 1223-38.
[2] Wang, Y., et al., Quantification of increased cellularity during inflammatory demyelination. Brain, 2011. 134(Pt 12): p. 3590-601.
[3] Smith, S.M., et al., Tract-based spatial statistics: voxelwise analysis of multi-subject diffusion data. Neuroimage 31.4 (2006): 1487-1505.
Figures