2561
Ultra-High B Diffusion Imaging of Cervical Spinal Cord in Multiple Sclerosis1Utah Center for Advanced Imaging Research, University of Utah, salt lake city, UT, United States, 2Department of Physics and Astronomy, University of Utah, salt lake city, UT, United States, 3Department of Radiology and Imaging Sciences, University of Utah, salt lake city, UT, United States, 4Department of Neurology, University of Utah
Synopsis
Diffusion tensor imaging (DTI) is considered as a biomarker to quantitatively evaluate the pathology in the cervical spinal cord (CSC) in MS patients. However, DTI parameters, including axial and radial diffusivities, and fractional anisotropy (FA), provides signal behavior of the water diffusion at a specific diffusion weighting. Using a ultra-high B DWI on a CSC specimen and Monte-Carlo Simulation indicate that we can learn much more insights about the CSC pathology by analyzing the signal-b curve at b > 4000 s/mm2. In this presentation, we will show unique signal behaviors of UHB-rDWI in acute and chronic legions in MS CSC.
Introduction
To improve imaging of the cervical spinal cord (CSC) and to provide quantitation of spinal cord injury we have developed novel MRI acquisition techniques, using diffusion MRI (ultra-high-B diffusion MRI: UHB-rDWI) imaging. In this project, we applied these techniques to normal controls and Multiple Sclerosis (MS) patients with new cervical cord lesions and demonstrate the importance of this imaging for quantitation of combined demyelination and axonal injury in the acute lesions of MS. Monte Carlo Simulation and preliminary testing demonstrated the capability of UHB-rDWI to detect demyelination and axonal leakage (injury) [1].Methods
After approval from local institutional review board and informed consent, normal control subjects and Relapsing/Remitting MS patients underwent UHb-rDWI experiment three times in the interval of 7 months on a Siemens 3T MRI system (Trio, Siemens Medical Solutions, Erlangen, Germany). Firstly, T2-weighted images were acquired for planning the UHb-rDWI experiment. Then axial high-b diffusion images were acquired using 2D Single Shot Diffusion-Weighted Stimulated EPI with Reduced FOV (2D ss-DWSTEPI-rFOV) sequence [2] and 8 channel array coil [3]. The imaging parameters were TR/TE=3 s/64 ms, FOV read/phase=128/44 mm, 6 min 19 sec scan time, 6 averages, 21 slices, 1x1x4 mm3 voxel dimension, and linearly spaced 7 b-values (12 ms gradient duration and 38 mT/m amplitude) ranging from 573 to 7348 s/mm2 along the left-right direction corresponding to the 7 mixing times, TMs (time interval between two 90° RF pulses) ranging from 9 to 465 ms. An additional bo image without diffusion gradient was obtained for each TM for correcting T1 decay during TM. Images of normal spinal cord and abnormal spinal cord with active lesions were obtained with a homemade coil designed for imaging of the cervical spinal cord[2] utilizing the ultrahigh-B DWI (UHB-rDWI)[3]. Normal control subjects and Relapsing/Remitting MS patients were recruited for this investigation approved by the University of Utah IRB.Results
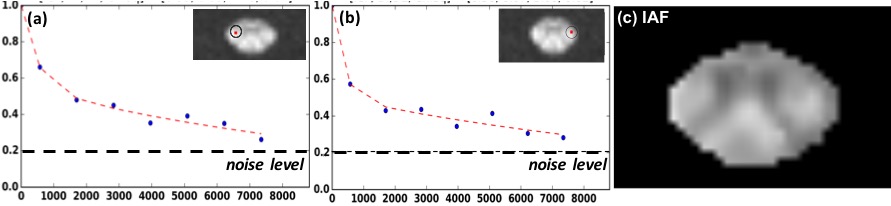
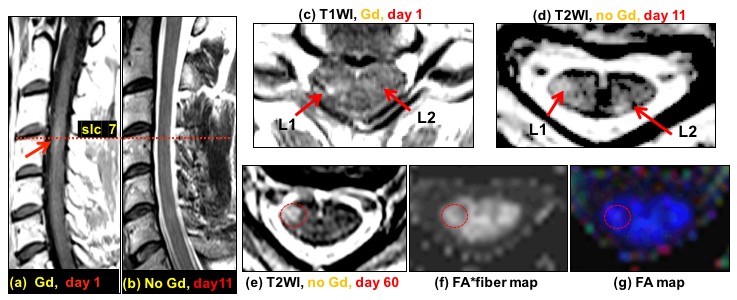
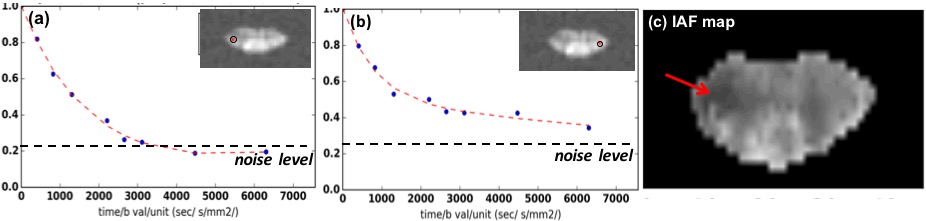
UHB-rDWI signal in WM in normal human CSC (Figure 1): the signal intensities are plotted for each pixel with different b values up to bmax = 7,338 s/mm2. These findings were consistent in two separate studies. An MS patient was imaged four times within 7 months after an acute attack with an active lesion involving the corticospinal tract in the CSC. The imaging protocol for different days were as followed: clinical MRI with Gd on day 1, research MRI with HighB-rDWI on day 11, 60, and 200. This example patient is a 48 yr. old male with CDMS not on immunotherapy and new onset of right lower extremity paraesthesias and right leg weakness associated with unsteady ambulation. He was given methylprednisolone 1000 mg IV each day for 3 days after the first research UHB-rDWI study (after day 11), and the symptoms were resolving with improved strength and ambulation at time of 60 day MRI exam. At day 200, the patient had returned to baseline. Results of UHB-rDWI are illustrated in Fig. 3.Conclusion
UHB-rDWI of the normal control was consistent in both corticospinal tracts on two successive scans. In the MS patient the corticospinal tract affected by the active lesion revealed a marked decrease in signal intensities over the range of b values up to 6500 s/mm2. The signal intensities in the contralateral unaffected corticospinal tract were similar to those in the corticopinal tracts in the normal control. These values in the MS patient did not change on serial observations at days 11,60 and 200 post-relapse. The results of the serial UHB-rDWI were discordant with the recovery of the MS patient. However, the findings with UHB-rDWI are most consistent with persistent demyelination and perhaps residual axonal injury (dysfunction).Acknowledgements
This work is supported by Cumming Foundation Grant, VA Merit Review Grant, NMSS Research Grant (RG 5233-A-2).References
[1] Nabraj Sapkota et al., Characterization of spinal cord white matter by suppressing signal from hindered space. A Monte Carlo simulation and an ex vivo ultrahigh-b diffusion-weighted imaging study, Journal of Magnetic Resonance, Volume 272, November 2016, Pages 53-59.
[2] Nabraj Sapkota et al., Eight-channel decoupled array for cervical spinal cord imaging at 3T: six-channel posterior and two-channel anterior array coil, Concepts in Magnetic Resonance Part B: Magnetic Resonance Engineering, Volume 46, Number 2, 1 April 2016, pp. 90-99(10)
[3] Nabraj Sapkota et al., Two-dimensional single-shot diffusion-weighted stimulated EPI with reduced FOV for ultrahigh-b radial diffusion-weighted imaging of spinal cord, Magnetic Resonance in Medicine, 2016 Jun 14
Figures