2560
Measures of tissue coherency in T2-weighted MRI for myelin and axonal pathology: A MRI-histology correlative study in multiple sclerosis1Biomedical Engineering Program, University of Calgary, Calgary, AB, Canada, 2Departments of Neurology and Clinical Neurosciences, University of Calgary, AB, Canada
Synopsis
Measurement of tissue coherency has been largely relying on advanced MRI. Here we presented a coherency-assessing method based on standard T2-weighted MRI. Postmortem brain samples from multiple sclerosis (MS) patients were used to validate our method. It was based on Fourier transform power spectrum, from which dominant tissue-aligning directions and angular entropy were calculated. Tissue coherency in histology was quantified using structure tensor analysis. We found that both MRI and histology coherency differentiated MS lesions from NAWM, and that MRI coherency correlated significantly with histological results. These findings suggest the potential of T2-weighted MRI in characterizing advanced tissue pathology
Purpose
Measures of tissue coherency have shown promise in several neurological disorders such as multiple sclerosis (MS). However, most studies have been focusing on advanced MRI, which are not typically included in clinical imaging.1 In this study, we aimed to show the potential of an image post-processing method for assessing tissue coherency using standard T2-weighted MRI. This was done by measuring both MS lesions and non-lesion areas, and by quantitative validation using correspondent histological images.Methods
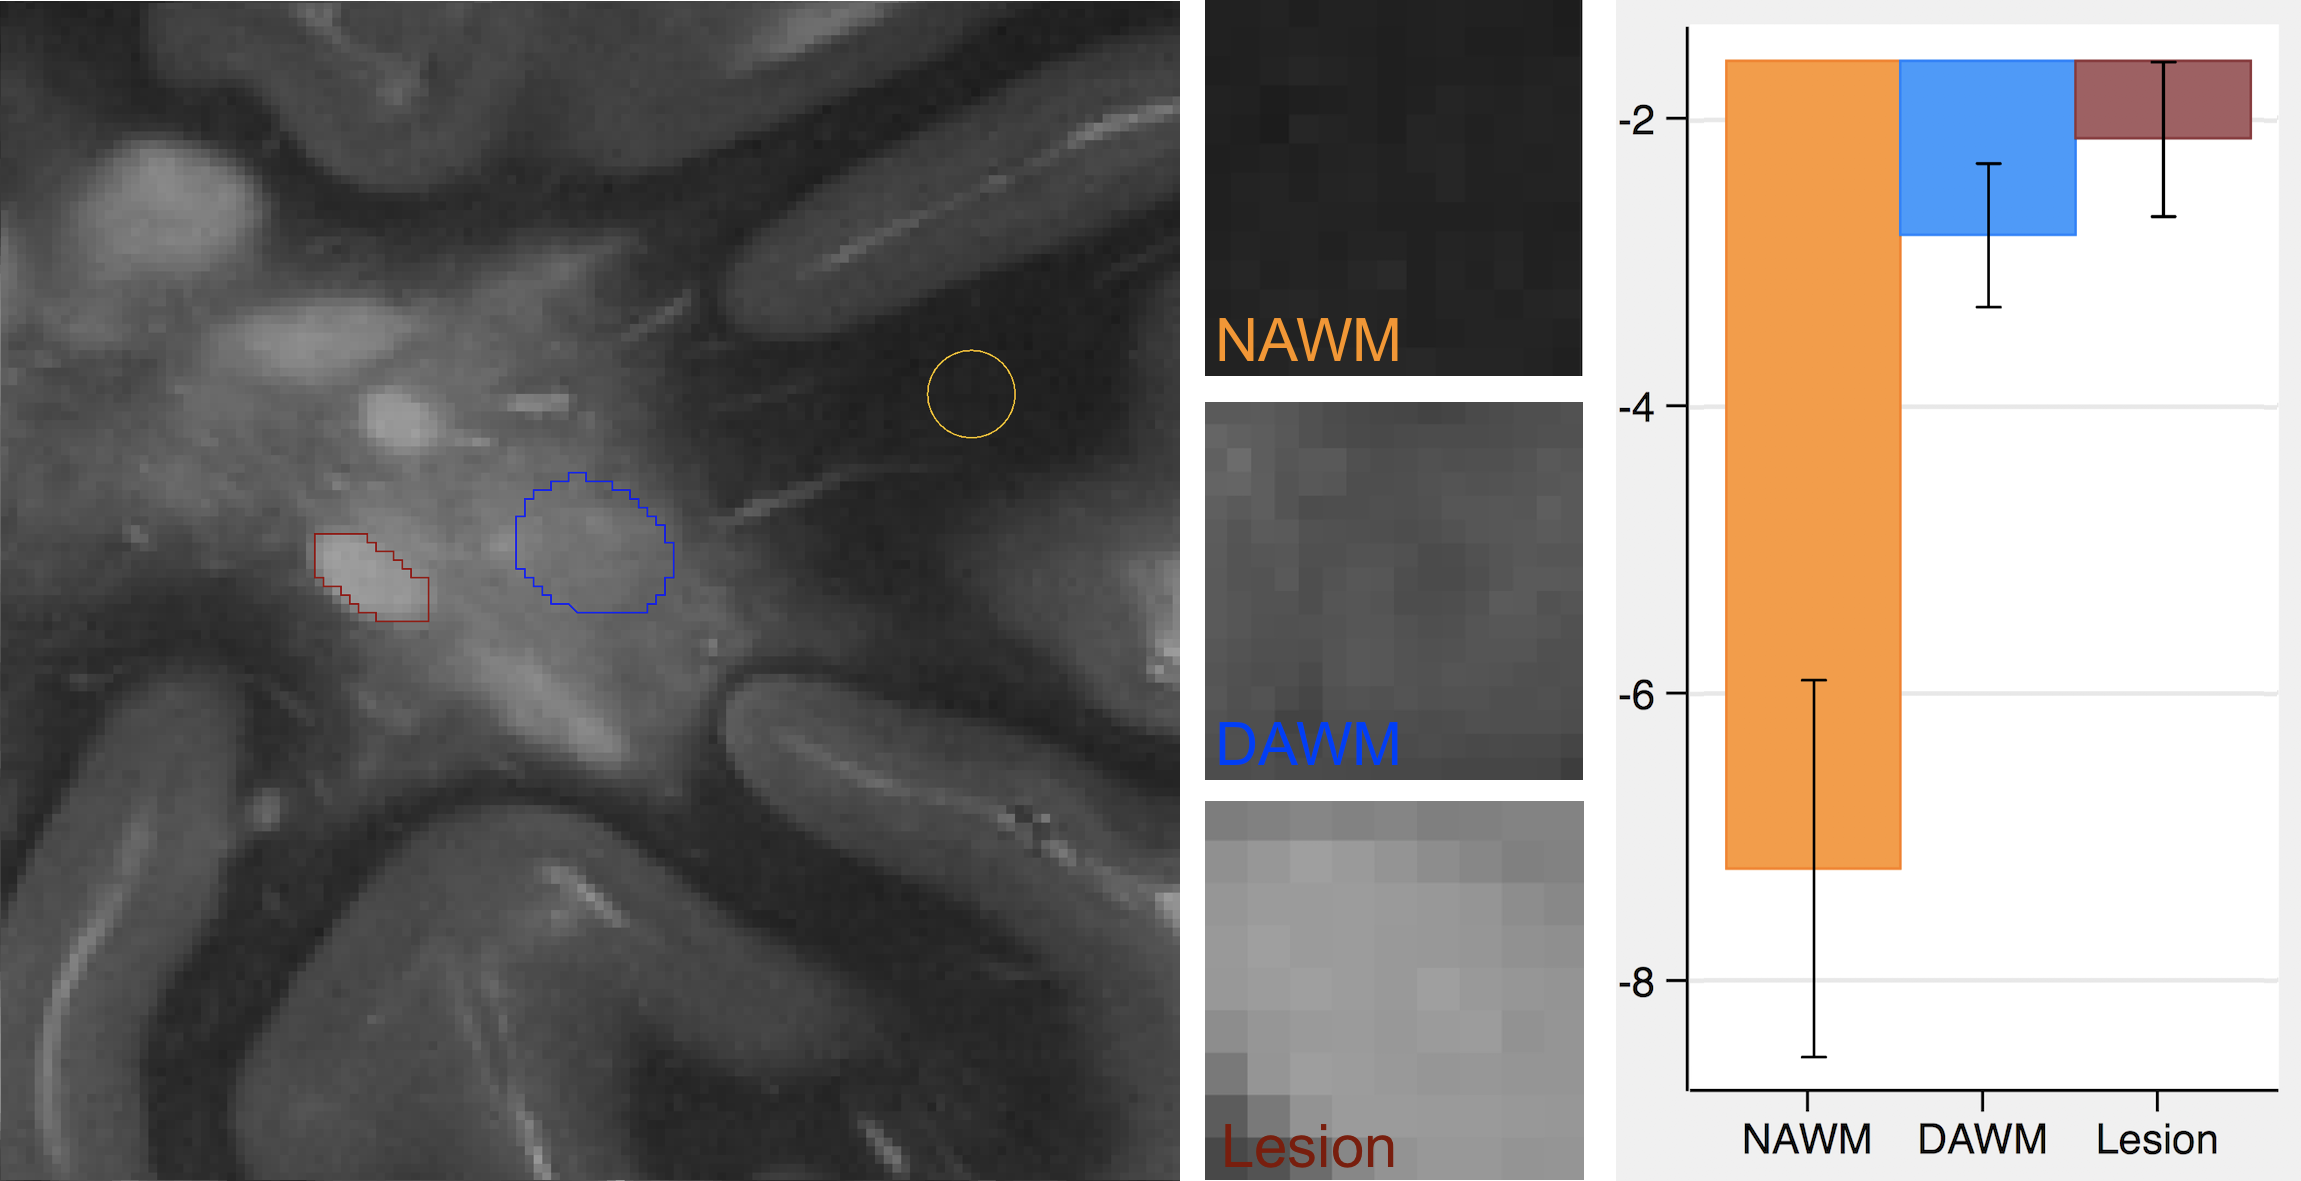
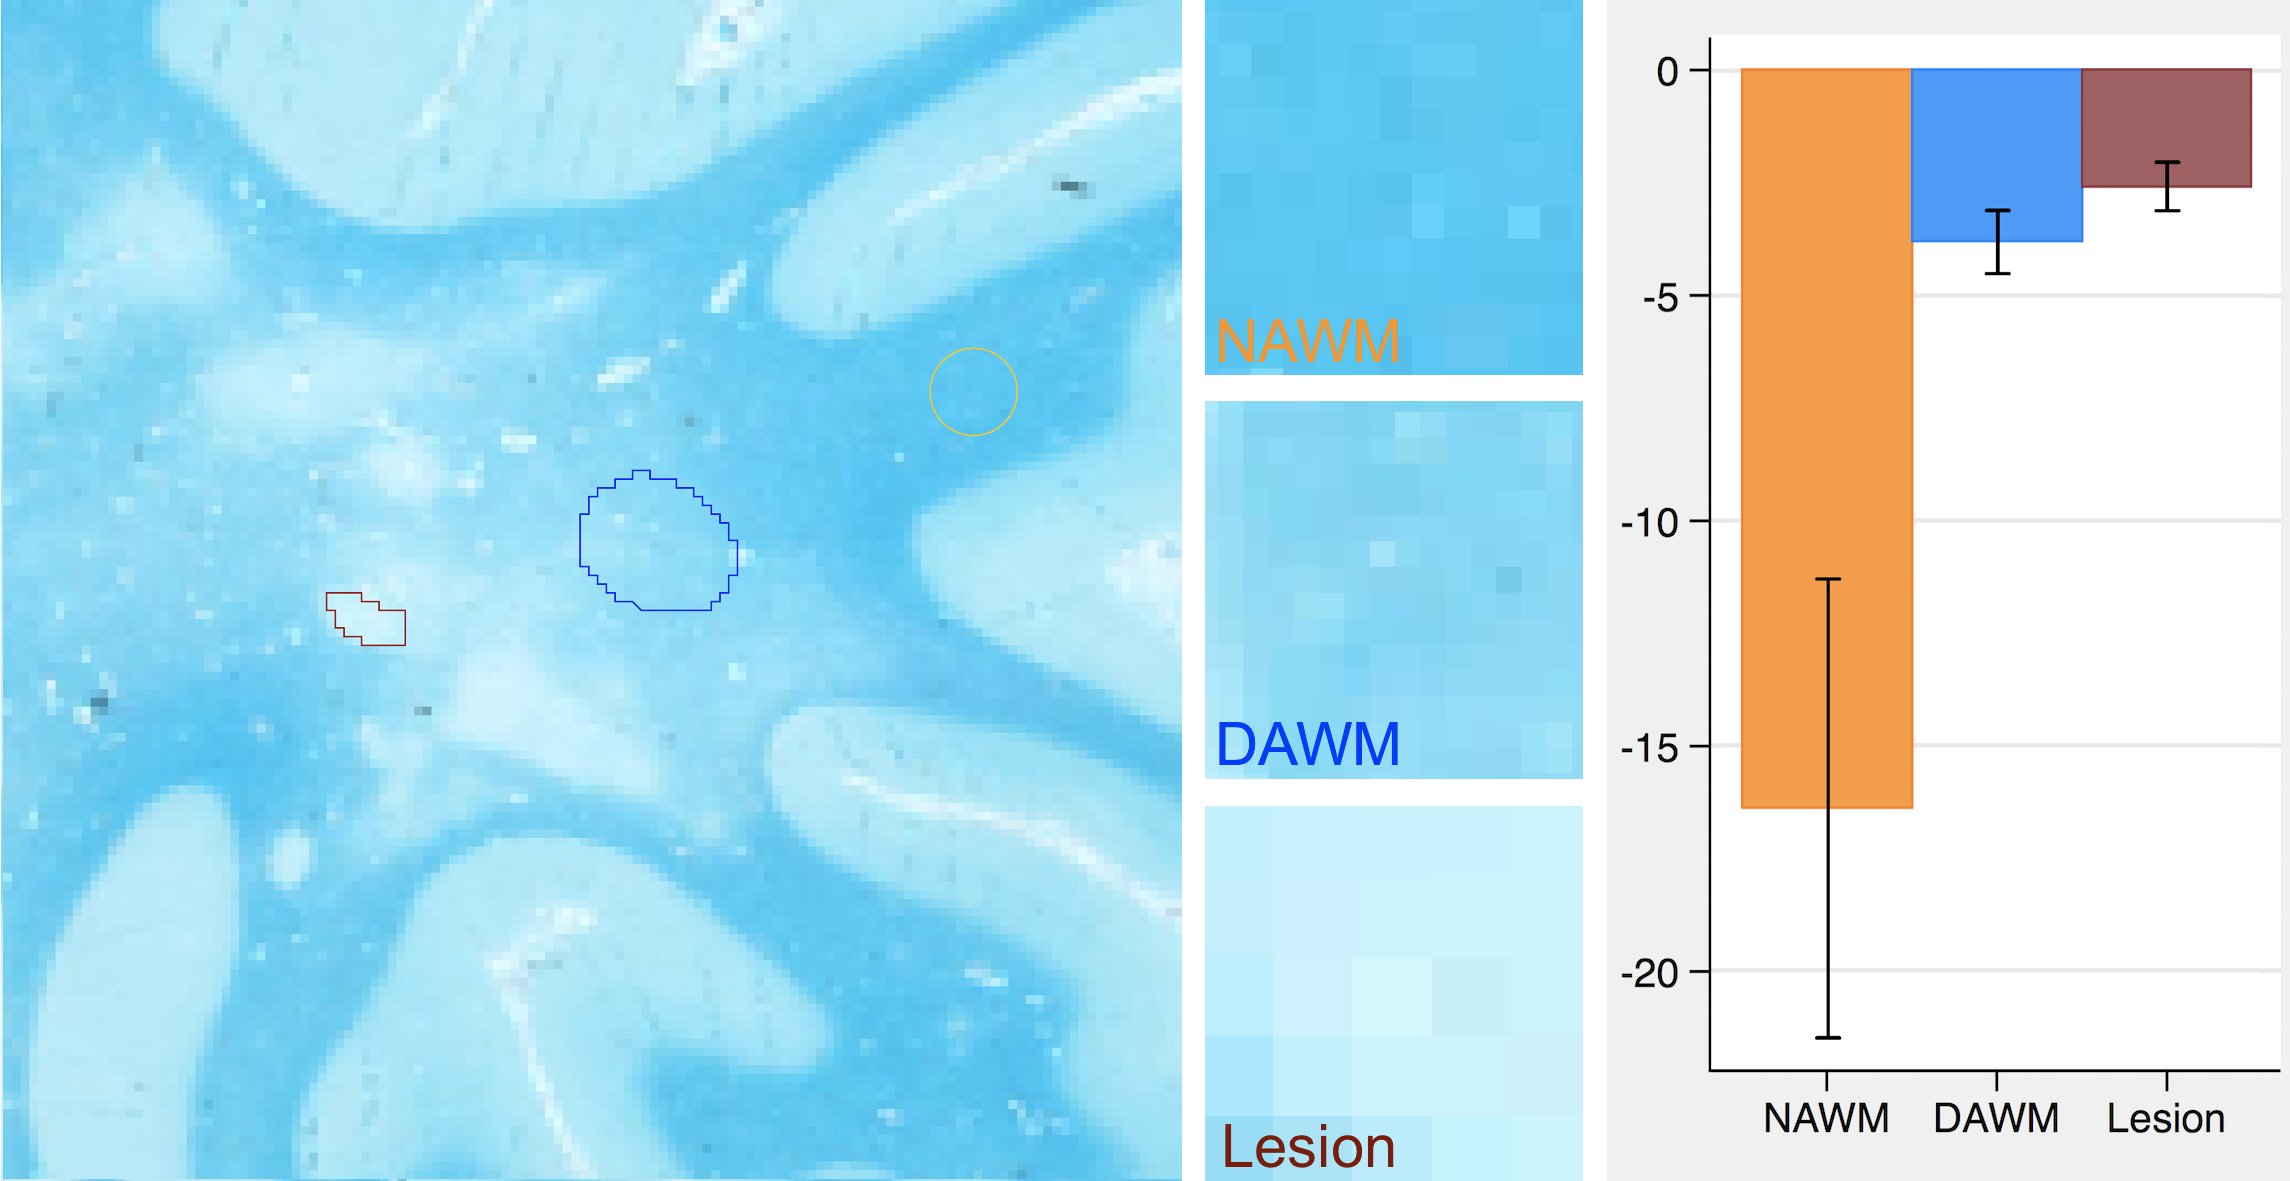
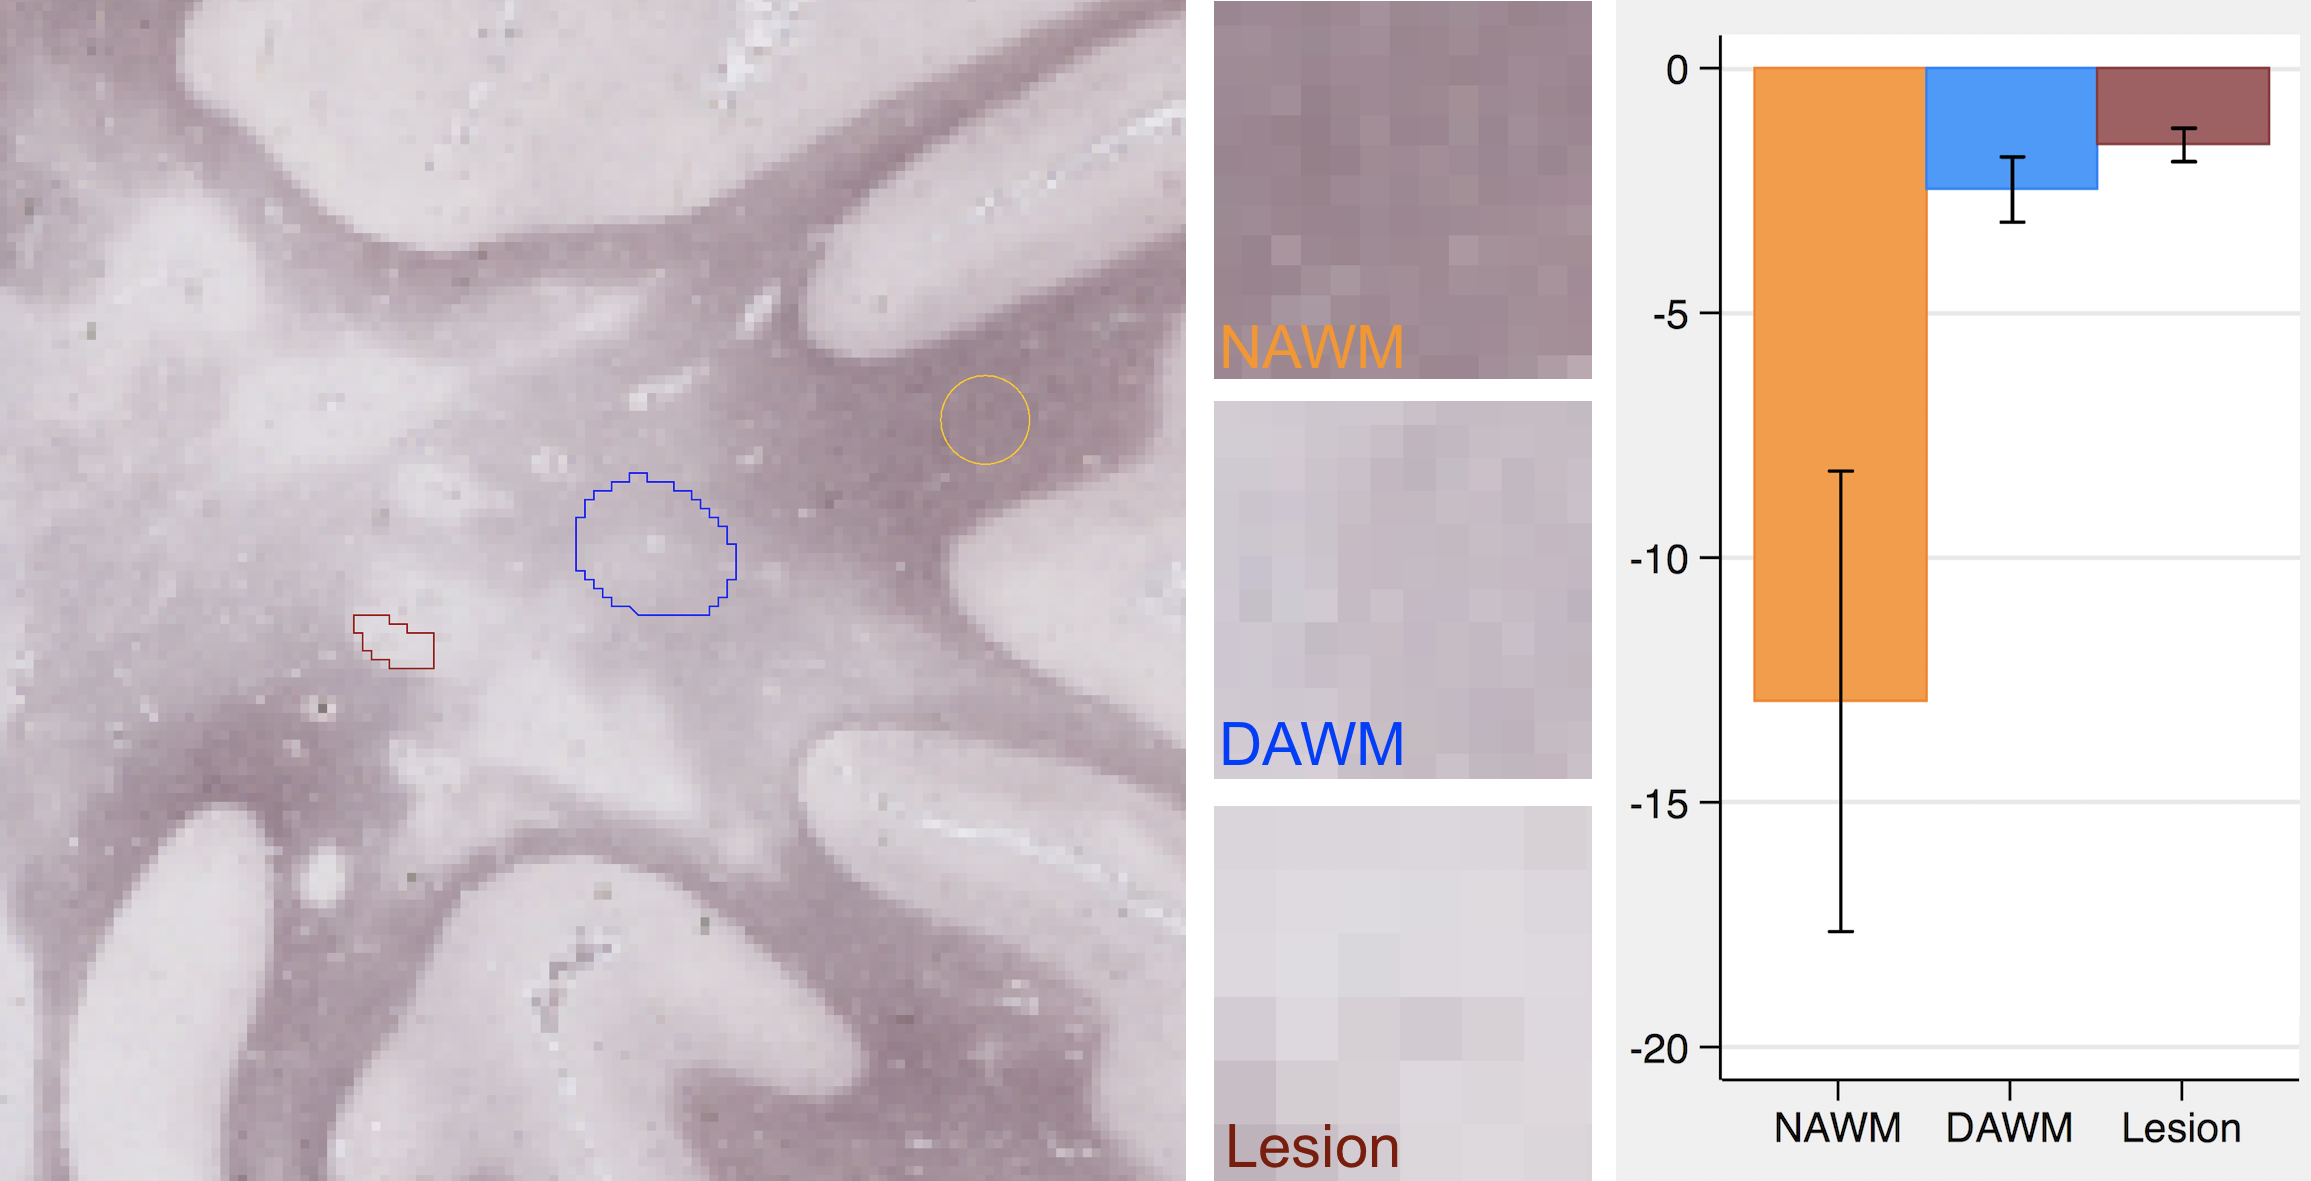
T2-weighted MR images were obtained from 10 post-mortem brain samples scanned at a 7T scanner (TE/TR = 7/1500 ms; matrix size = 256x256; and slice thickness = 1 mm). We examined 3 tissue types: focal MS lesions, diffusely abnormal white matter (DAWM), and normal appearing white matter (NAWM). Regions of interest (ROIs) were firstly identified in MR images and then were confirmed by histology. The size of ROIs ranged from 7x5 to 27x47 voxels (Figures 1-3). To calculate tissue coherency in MRI, we used a Fourier transform power spectrum-based method as shown previously.2 Briefly, this method included Fourier transform of a ROI, power spectra computation, normalization, thresholding (80-100 percentile), and polar conversion. In this way, a unique orientation distribution profile was generated per ROI, from which the dominant aligning direction of the ROI was identified, which corresponded to the highest peak in the distribution; then, angular entropy of the ROI was calculated using the equation: ε = -Σ pθ * {log pθ}, where pθ referred to the probability of the alignment strength at a certain angle θ.3 Following MRI, corresponding brain samples were prepared for histology. Series of 10-µm-thick sections were cut and stained by luxol fast blue for myelin, and by Bielschowsky for axons. The coherency of these stained histological images was quantified using a newly established method in the literature named structure tensor analysis.4 Structure tensor metrics including coherency, orientation and energy were initially derived from the high-resolution, co-registered histological images, and then were downsized to 256x256 to match the dimension of MRI. Angular entropy in histology was calculated using the same equation as that used in MRI. Outcomes were assessed using a statistical package Stata, with p£0.05 as significance.Results
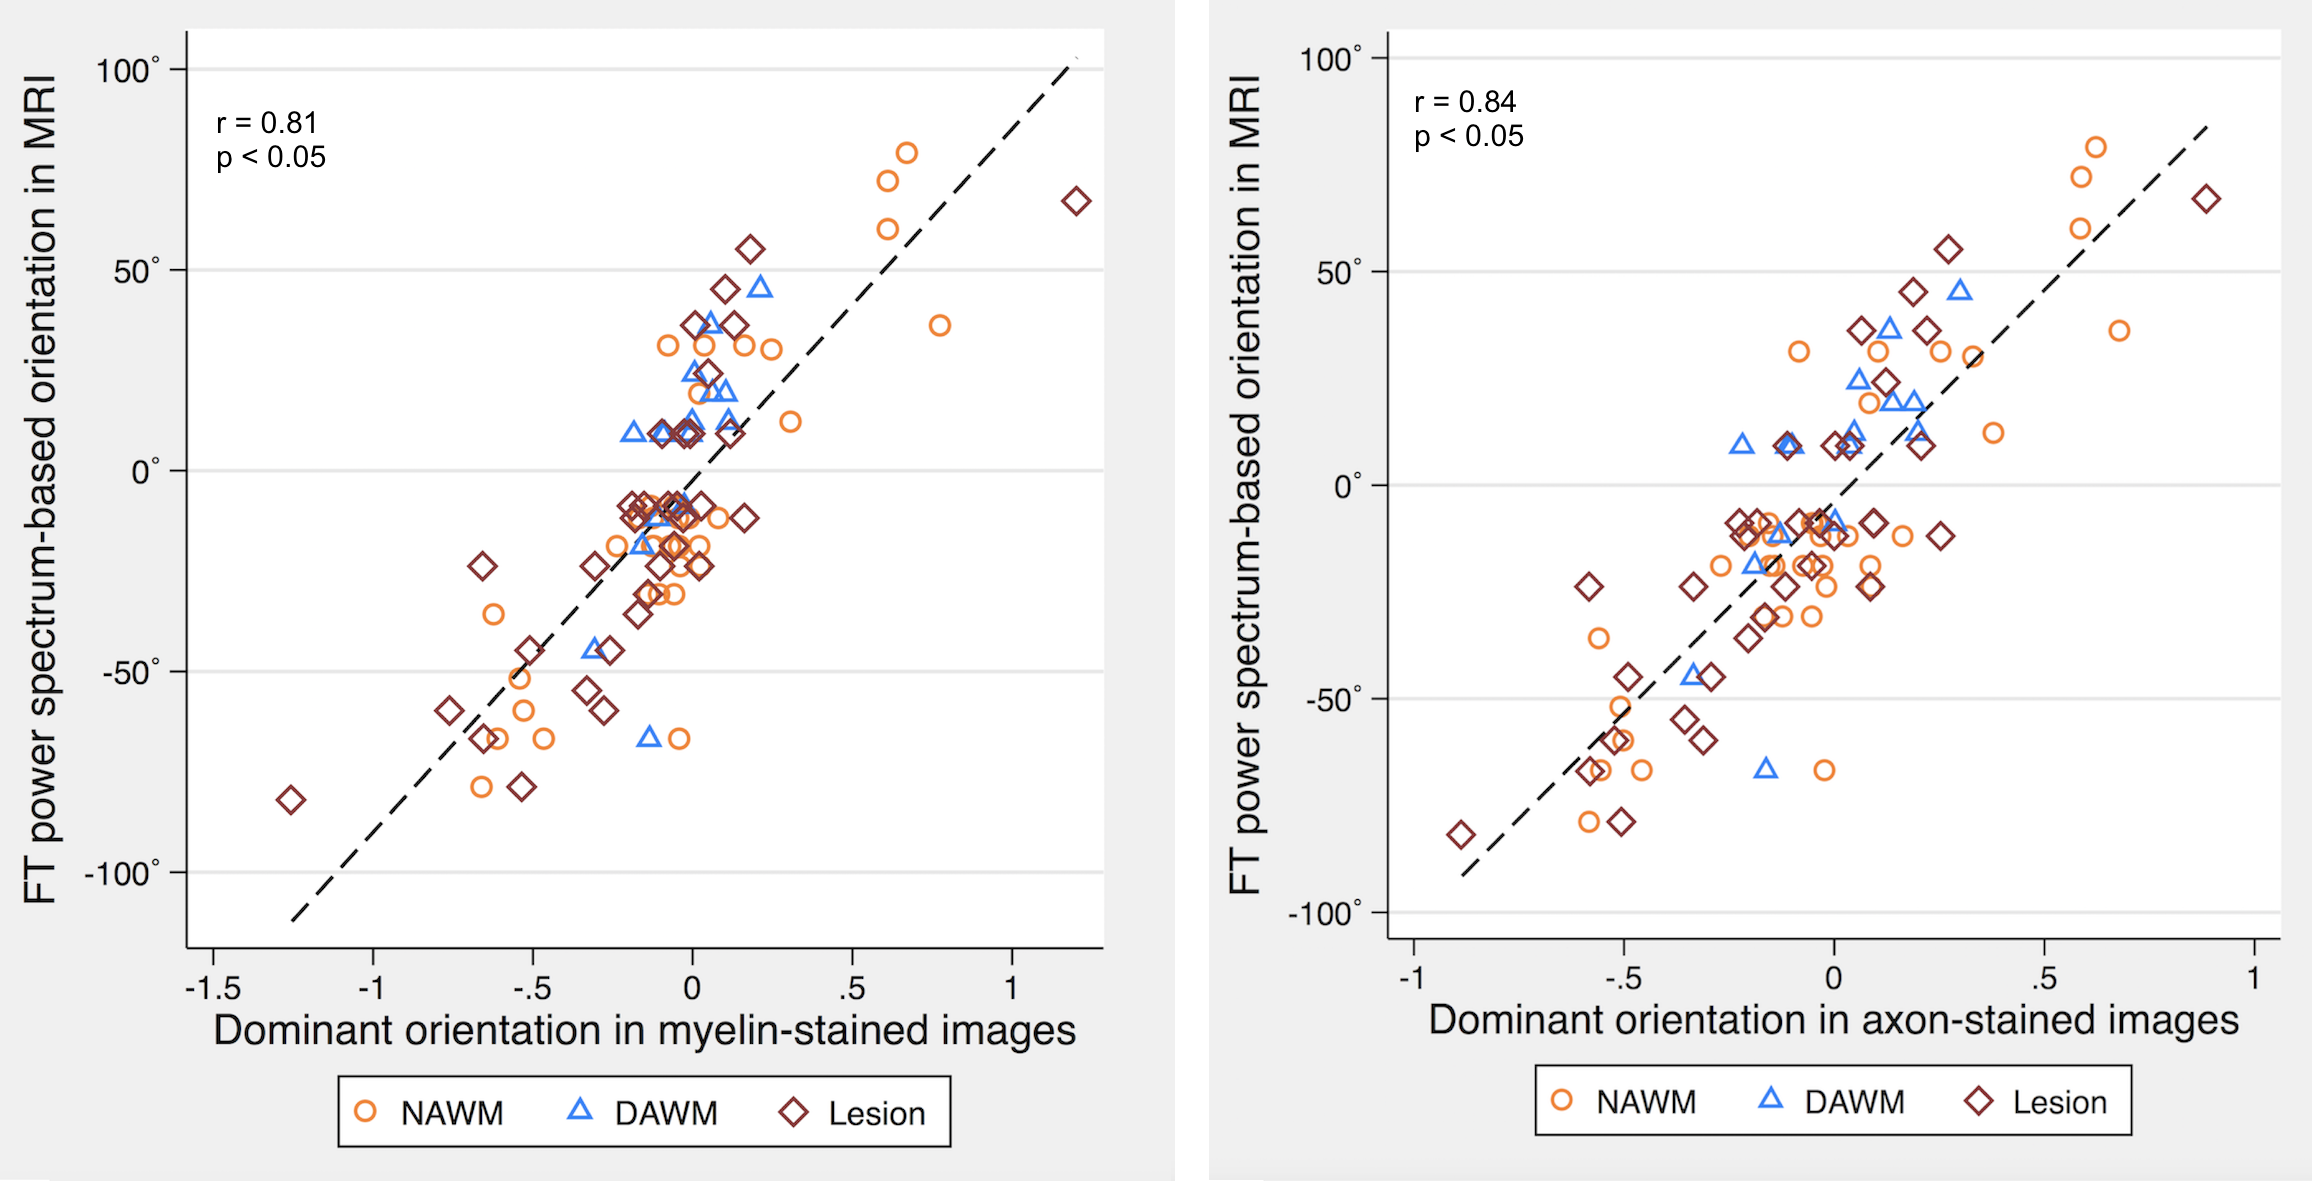
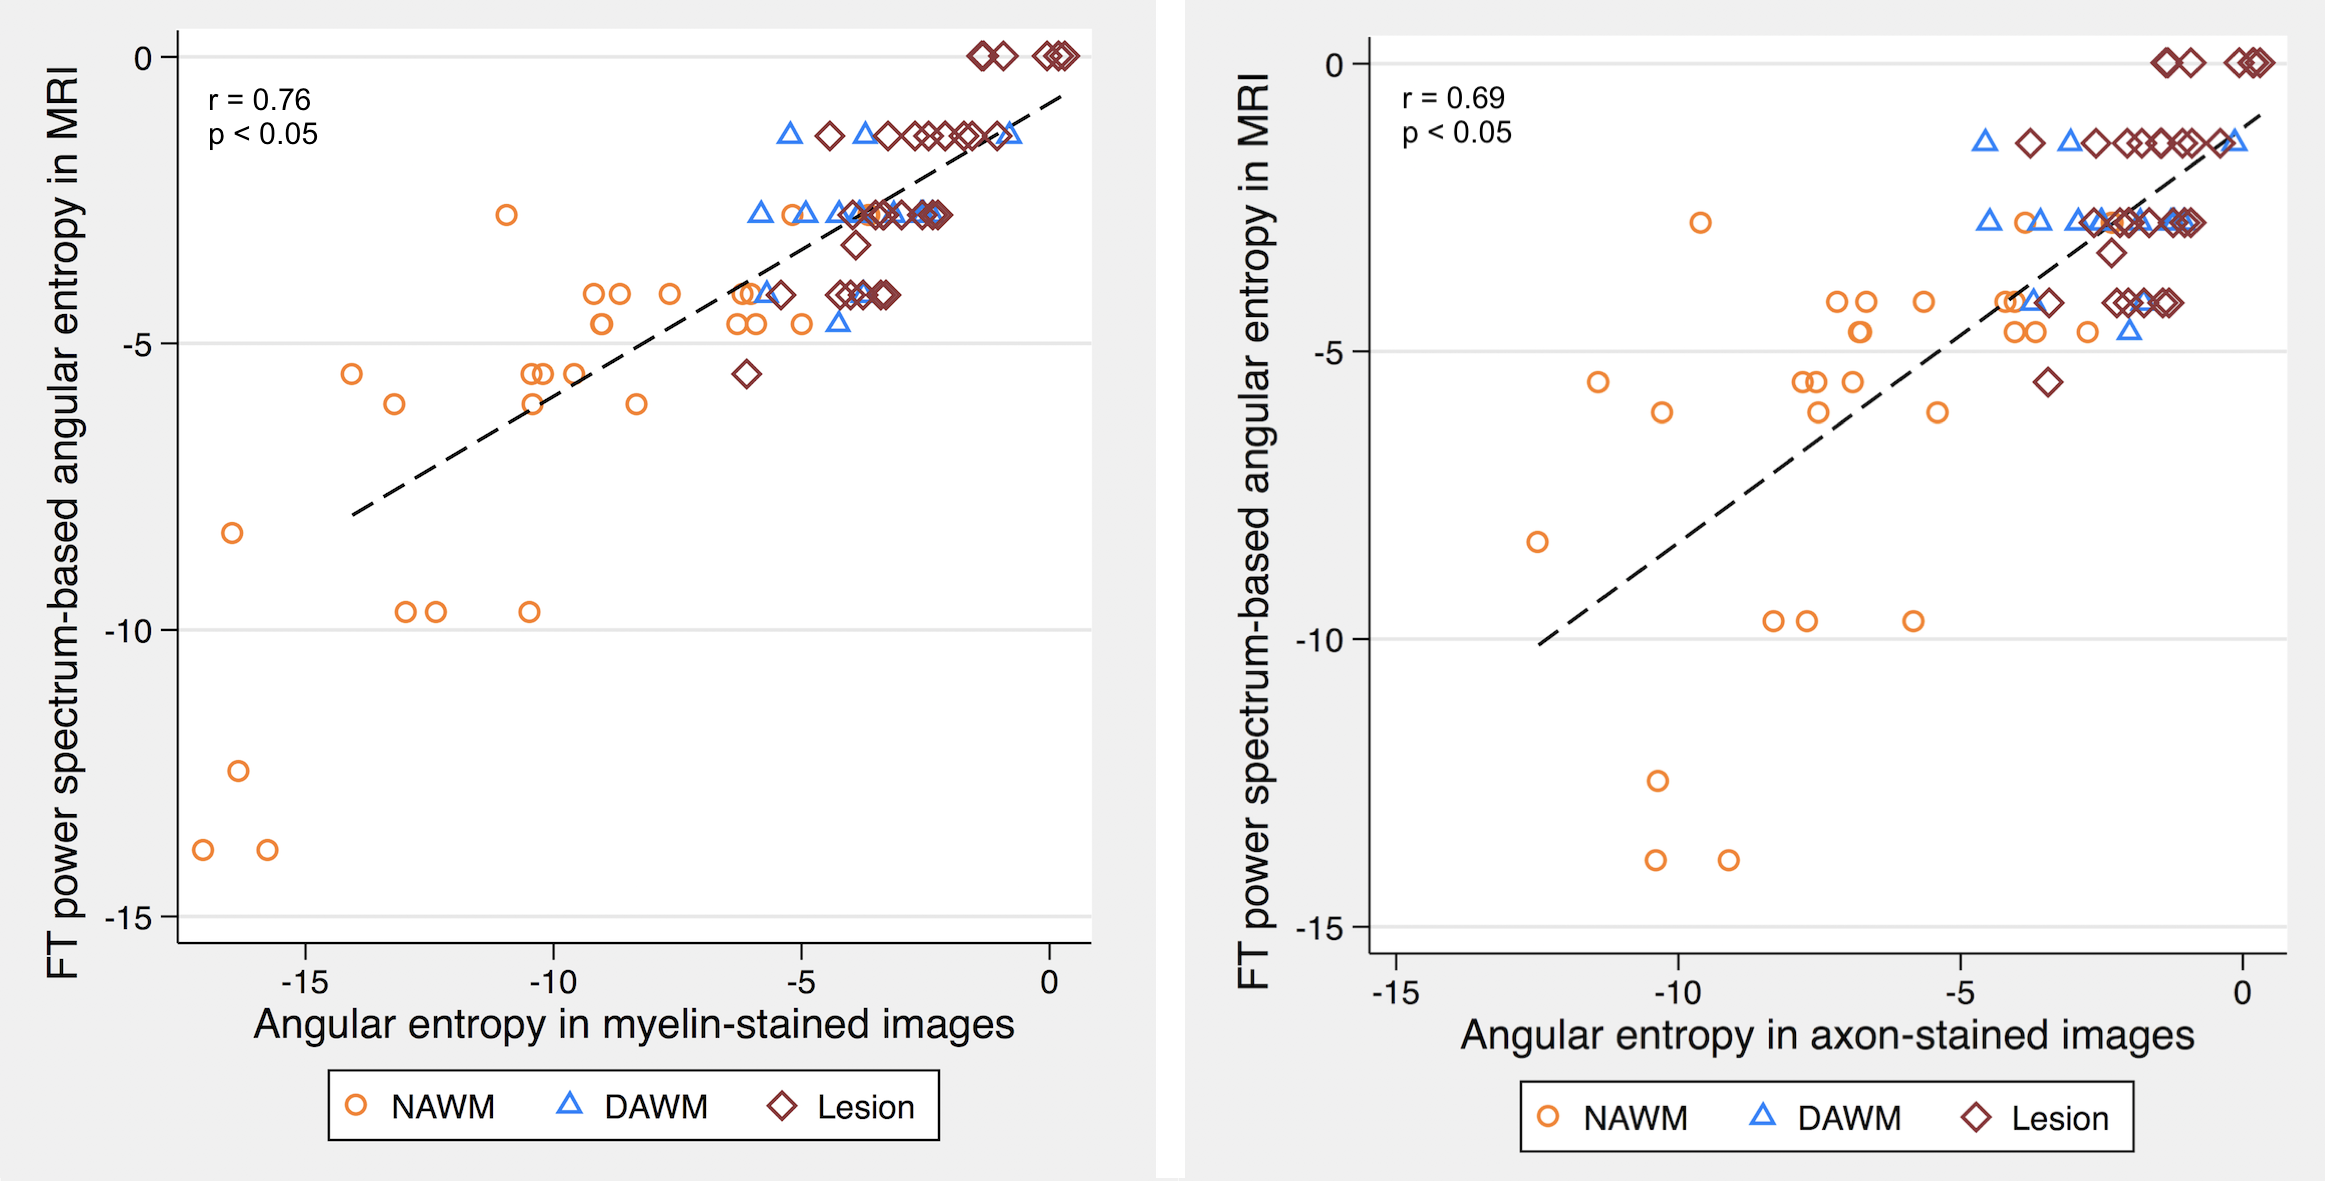
A total of 88 ROIs were examined, 34 from lesions, 16 from DAWM, and 38 from NAWM. Based on mixed effect modelling, we found that angular entropy derived from either MRI or histology was significantly higher in lesions than in the NAWM (p<0.05). Similar to focal lesions, the angular entropy of DAWM appeared to be higher than NAWM but did not reach significance (Figures 1-3). Regarding tissue alignment, there were significant correlations between MRI and histology-derived results, for images either stained for myelin (r=0.81; p<0.05 for dominant orientation and r=0.76, p<0.05 for angular entropy) or axons (r=0.84; p<0.05 for dominant orientation and r=0.69; p<0.05 for angular entropy) (Figures 4 and 5). The correlation between other structure tensor outcomes derived from histology and MRI-based tissue coherency was not significant.Discussion
In this study, we show that tissue coherency measured in T2-weighted MRI reflects the integrity of myelin and axons in MS patients as confirmed in histology. Differences in myelin and axonal pathology is well appreciated in MS patients, not only between tissue types, but also between individual lesions.5 Characterizing subclinical tissue pathology has been an ongoing challenge in both clinical trials and daily practice. Previously, angular entropy based on Fourier transform power spectrum has shown the ability to detect subtle changes in the corpus callosum of the brain.2 With histological validation in the present study, we further show that assessing tissue alignment and entropy using T2-weighted MRI may be a promising method for assessing the severity of demyelination and axonal loss, in either focal or diffuse pathology of MS patients.Conclusion
Our findings suggest that it is possible to obtain advanced measurement of tissue pathology using standard MR images in clinical studies. With further confirmation in a large sample size, this method may lead to improved disease monitoring, treatment, and new treatment discovery. This will help both patients with MS and those with similar disorders.Acknowledgements
We acknowledge the funding support from MS Society of Canada for this project and the scholarship support (S Sharma) from the University of Calgary and NSERC I3T CREATE.References
1. Bakshi R, Thompson AJ, Rocca MA, et al. MRI in multiple sclerosis: current status and future prospects. Lancet Neurol. 2008; 7:615-625. 2. Sharma S, Zhang Y. Power spectrum detects corpus callosum directionality using T2-weighted MRI secondary progressive MR patients and controls. Singapore: ISMRM 24th Annual meeting and exhibition; 07-13 May 2016. 3. Bayan C, Levitt JM, Miller E, et al. Fully automated, quantitative, noninvasive assessment of collagen fiber content and organization in thick collagen gels. J Appl phys. 2009; 105(10):102042. 4. Budde MD Frank JA. Examining brain microstructure using structure tensor analysis of histological sections. NeuroImage. 2012; 63:1-10. 5. Wang Y, Sun P, Wang Q, et al. Differentiation and quantification of inflammation, demyelination and axon injury or loss in multiple sclerosis. Brain. 2015; 138:1223-38.Figures