2558
mcDESPOT-derived tissue parameters in the brainstem and corpus callosum of MS and NMOSD patients with cervical cord lesions1Department of Medicine, University of British Columbia, Vancouver, BC, Canada, 2Neuroimaging, Institute of Psychiatry, Psychology & Neuroscience, King's College London, London, United Kingdom, 3Nuffield Department of Clinical Neurosciences, University of Oxford, Oxford, United Kingdom, 4Department of Radiology, University of British Columbia, Vancouver, BC, Canada
Synopsis
Neuromyelitis optica spectrum disorder (NMOSD) and multiple sclerosis (MS) are demyelinating central nervous system disorders that may present with some overlapping clinical symptoms but differ pathophysiologically. We used tissue-specific quantitative measures, produced by mcDESPOT, to characterize tissue pathology in MS and NMOSD groups compared to healthy controls. We observed decreased myelin water fraction, increased T2 of intra/extracellular water, increased cerebrospinal volume fraction, and increased myelin water residence time in the brainstem and corpus callosum of MS and NMOSD subjects, compared to controls. These sensitive advanced MRI measures could provide an improved understanding of MS and NMOSD pathogenesis.
Introduction
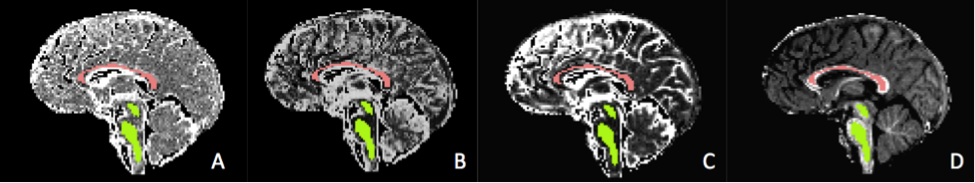
Neuromyelitis optica spectrum disorder (NMOSD) is a rare, neuro-inflammatory disorder that primarily affects the optic nerves and spinal cord1,2. NMOSD was previously classified as a subtype of multiple sclerosis (MS); however, recent studies have suggested that NMOSD is clinically and pathophysiologically distinct from MS1,2. MS is known to feature widespread diffuse demyelination in the brain and spinal cord, but not in NMOSD2. However, evidences of diffuse damage in certain NMOSD brain regions were found. The brainstem, which is structurally continuous with the spinal cord, is known to be affected in both MS and NMOSD1,3. Brainstem damage may be associated with Wallerian degeneration resulting in atrophy and demyelination distal to the axonal transection or damaged neuron in the spinal cord4,5,6. In the corpus callosum (CC), which is not directly connected to the spinal cord, diffuse tissue changes are typically expected only in MS2,7,8. However, some studies have suggested extensive white matter damage to the CC in NMOSD, demonstrated by reduced fractional anisotropy (fiber directionality, axonal degeneration) and increased mean or radial diffusivity (amount of water diffusion, demyelination)1,4. While metrics derived from diffusion tensor imaging can be informative, reflecting broad tissue changes in brain, they lack biological specificity9. Multicomponent relaxation MRI aims to provide more specific measures of tissue damage, including demyelination9. Thus, we aimed to study the underlying pathology in the brainstem and CC of MS and NMOSD patients with cervical cord lesions, using tissue-specific metrics obtained using multi-component driven equilibrium single pulse observation of T1/T2 (mcDESPOT)10. We investigated the following parameters: myelin water fraction (MWF), myelin water residence time (τM), T2 of intra/extracellular water (IET2) and cerebrospinal fluid volume fraction (Vcsf) (Figure 1). These measures provide information about myelin content, myelin thickness, inflammation, and atrophy, respectively.Methods
mcDESPOT10 data was acquired in 9 relapsing remitting MS patients (median age=42 years (range 28-62); disease duration=54 months (26-156); median EDSS=2 (1-5)), 7 anti-aquaporin-4-seropositive NMOSD patients (median age=48 years (27-76); disease duration=69 months (24-186); EDSS=4 (2-7.5)), and 13 age-matched healthy controls (median age=49 years (26-76)), using a Siemens 3T scanner with 1.7x1.7x1.7mm voxels at baseline and at 12 months. All MS and NMOSD subjects had evidence of one or more cervical cord lesions. Brainstem and CC regions of interest (ROIs) were manually drawn on 3 slices per scan. Images were registered with FSL-FLIRT. Median (±standard deviation) MWF, τM, IET2, and Vcsf values were calculated in each ROI. Student’s t-tests were used to compare cohorts.Results
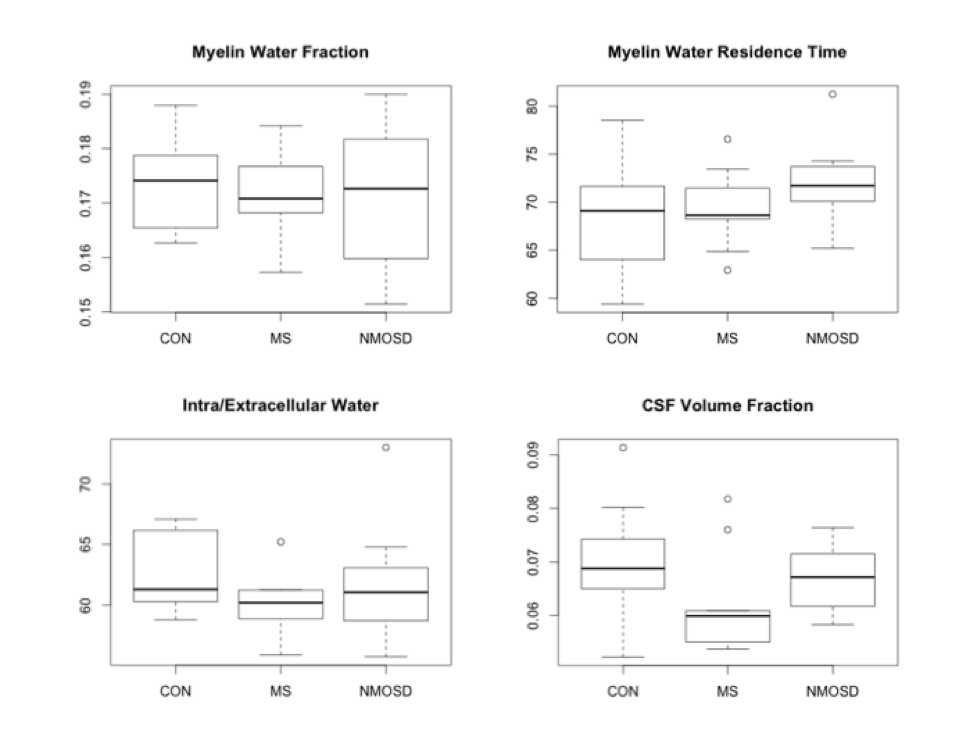
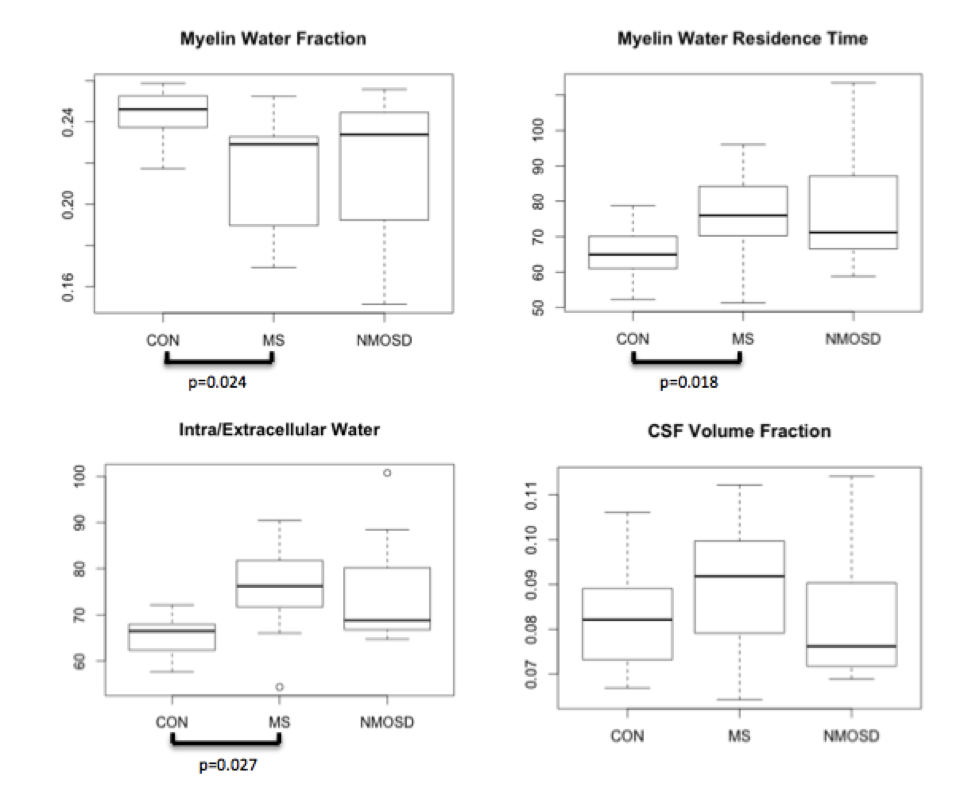
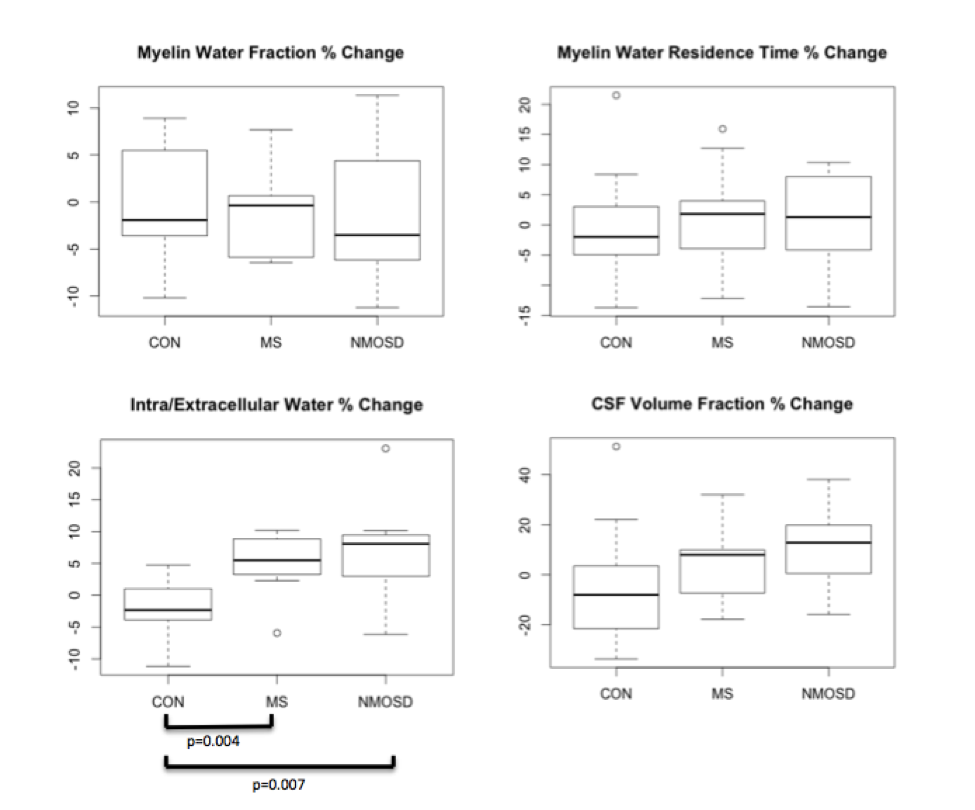
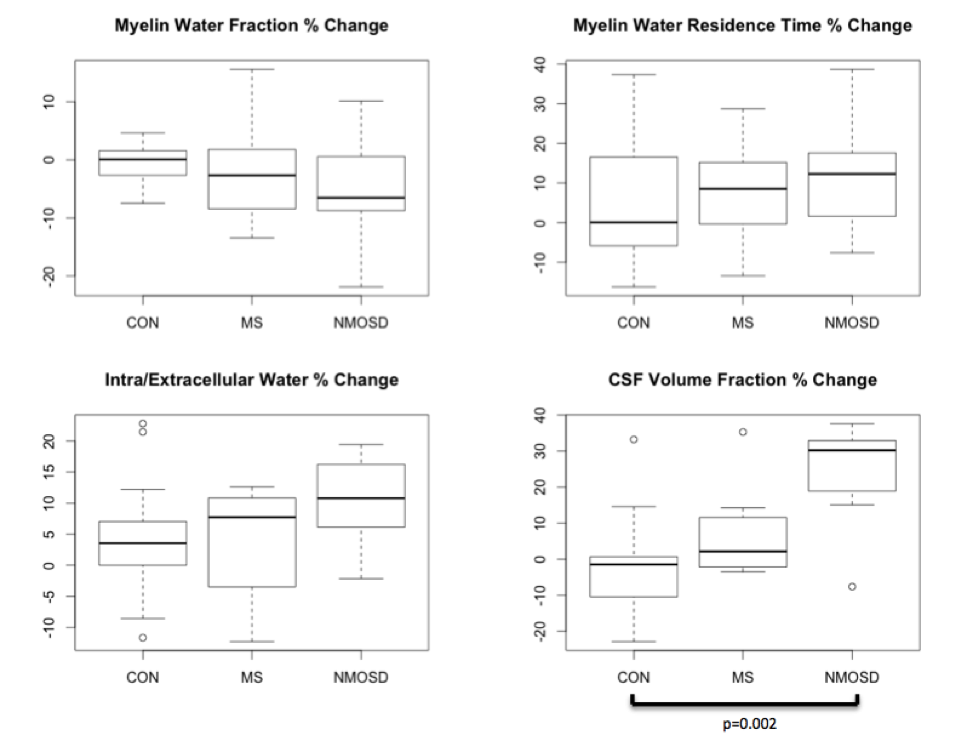
BASELINE (Figures 2,3): MWF was lower in MS and NMOSD compared to controls in both ROIs but only significantly in the CC for MS (0.23±0.03) compared to controls (0.25±0.01) (p=0.02). τM was longer in the CC for both MS and NMOSD compared to controls with a significant difference between MS (76.0±12.8ms) and controls (64.9±7.3ms) (p=0.02). IET2 was only significantly different in the CC between MS (76.3±10.7ms) and controls (66.4±4.1ms) (p=0.03). LONGITUDINAL (Figures 4,5): Over one year, there was a trend towards decreasing MWF and increasing τM in both the CC and brainstem of both MS and NMOSD but the changes were not significant. IET2 increased in MS and NMOSD in the brainstem [MS (5.50±4.99) vs. Controls (-2.31±4.88) (p=0.004), NMO (8.06±8.94) vs. Controls (p=0.007)]. A similar trend was found in Vcsf; however, a significant difference (p=0.002) was only seen in NMOSD brainstem compared to controls.Discussion
As expected, cross-sectional results suggested decreased myelin content in the brainstem and CC of both MS and NMOSD cohorts, compared to controls. Additionally, tissues with long T2 times, such as CSF, could indicate more water in pathologic tissues due to inflammation or edema produced during nerve degeneration. These results are supported by our longitudinal finding of greater increases in IET2 and Vcsf in both the CC and brainstem in both MS and NMOSD over one year, compared to controls. Furthermore, the longer residence times at baseline and over one year are intriguing. This may be due to preferential loss of small axons with thinner myelin, resulting in a larger average myelin thickness within the voxels of interest. These MRI features are compatible with previous reports of extensive white matter damage in MS and NMOSD1,4.Conclusion
Our findings of signal alterations to mcDESPOT-derived parameters in the brainstem and CC of MS and NMOSD cohorts are consistent with previous pathological findings in these diseases. The decreased MWF, increased IET2 and increased Vcsf may represent lower myelin content and increased inflammation/edema due to tissue damage. These quantitative advanced MRI measures could provide improved understanding of pathophysiological changes, and insight into efficacy of treatment and disease progression.Acknowledgements
We express our thanks to the participants involved in this study and Emil Ljungberg for providing valuable feedback.References
1. Kim W, Kim S, Kim, H. New insights into neuromyelitis optica. J Clin Neurol. 2011;7(3):115-127.
2. Matthews L, Kolind S, Brazier A, et al. Imaging surrogates of disease activity in neuromyelitis optica allow distinction from multiple sclerosis. PLoS ONE. 2015;10(9):e0137715.
3. El-Sourgy L, Ahmad N, El-Rakhawy M, et al. Applications of MR fiber tractography imaging in multiple sclerosis. EJRNM. 2015;46(2):449-454
4. Rueda Lopes F, Doring T, Martins C, et al. The role of demyelination in neuromyelitis optica damage: Diffusion-tensor MR imaging study. Radiology. 2012;263(1): 235-242.
5. De Simone T, Regna-Gladin C, Carriero M et al. Wallerian degeneration of the pontocerebellar fibers. ANJR. 2005;26:1062-1065.
6. Inoue Y, Matsumura Y, Fukuda T, et al. MR imaging of Wallerian degeneration in the brainstem. ANJR. 1990;11:897-902.
7. Yu CS, Lin FC, Li KC, et al. Diffusion tensor imaging in the assessment of normal appearing brain tissue damage in relapsing neuromyelitis optica. AJNR. 2006;27:1009-1015.
8. Ozturk A, Smith S, Gordon-Lipkin E, et al. MRI of the corpus callosum in multiple sclerosis: Association with disability. Mult Scler. 2010;16(2):166.
9. Qiu A, Mori, S and Miller M. Diffusion tensor imaging for understanding brain development in early life. Annu Rev Psychol. 2015;66:853-876.
10. Kolind S and Deoni S. Rapid three-dimensional multicomponent relaxation imaging of the cervical spinal cord. MRM. 2010;65(3):551-556.
Figures