2554
Quantitative Assessment of Limbic System Damage in Multiple Sclerosis1Radiology, Washington University in St. Louis, St. Louis, MO, United States, 2Neurology, Washington University in St. Louis, St. Louis, MO, United States
Synopsis
The limbic system plays an important role in the emotion- and memory-related brain functions. In this study, we measured R2* and the volumes of the key elements of the limbic system and used them to detect abnormalities in the limbic system in multiple sclerosis (MS). The results showed significant differences between Secondary Progressive MS (SPMS) and healthy group. R2* of amygdala, thalamus, insula, lateral orbitofrontal and isthmus cingulate significantly correlate with clinical cognitive tests in female SPMS. Our results also showed that R2*-defined tissue alterations in the hippocampus and entorhinal cortex could identify depression behavior in MS patients.
Purpose
To use quantitative tissue specific R2* measurements to quantitatively assess tissue damage of the limbic system in Multiple Sclerosis (MS) and compare the results with volumetric measurements.Methods
MRI scans were collected from 32 Relapsing-Remitting (RR), 16 Primary-Progressive (PP), and 32 Secondary-Progressive (SP) MS patients, as well as 26 healthy-controls (HC). All studies were approved by the local IRB. All subjects provided informed consent. All MRI scans were collected using a 3T SIEMENS scanner equipped with a 32-channel phased array head coil. High resolution (voxel size: $$$1\times 1\times 2mm^{3}$$$) Gradient Echo Plural Contrast Imaging (GEPCI)1-3 datasets were acquired using a 3D multi-gradient-echo sequence. R2* maps were calculated using a mono-exponential model. MPRAGE images (voxel size: $$$1\times 1\times 1mm^{3}$$$) were collected for segmentation using “FreeSurfer”. R2* median values were calculated in each brain regions, as described previously4. In this study, we are specifically interested in the limbic system, which includes hippocampus, amygdala, thalamus and the limbic cortex. Volumes of each brain structure were obtained from “FreeSurfer” segmentations and were normalized to skull size using “sienax” tool in “FSL” to get normalized volume (NV).
Expanded Disability Status Scale (EDSS), Timed 25-Foot Walk (25FTW), 9-Hole Peg Test (9HPT), Paced Auditory Serial Addition Test (PASAT) and Symbol Digit Modalities Test (SDMT) were performed on each MS patient. Beck Depression Inventory (BDI) scores were collected from 29 MS patients. All testing was performed on the same day as MRI, by experience examiners without knowledge of the imaging results.
Statistical analysis were done in the statistical program R. ANCOVA for repeated measures with Bonferroni correction and participants’ age as additional covariate were used to compare group differences. Partial correlation controlled for participants’ age was examined between R2*, NV and clinical scores. False Discovery Rate (FDR) was used to correct for multiple comparisons in the group comparison and correlation analysis. All p-values smaller than 0.05 were considered as statistical significant.
Results
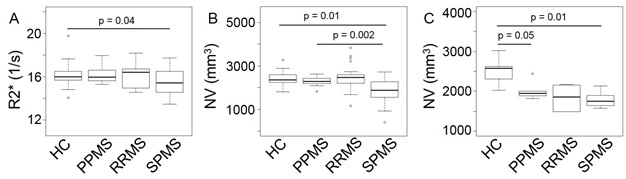
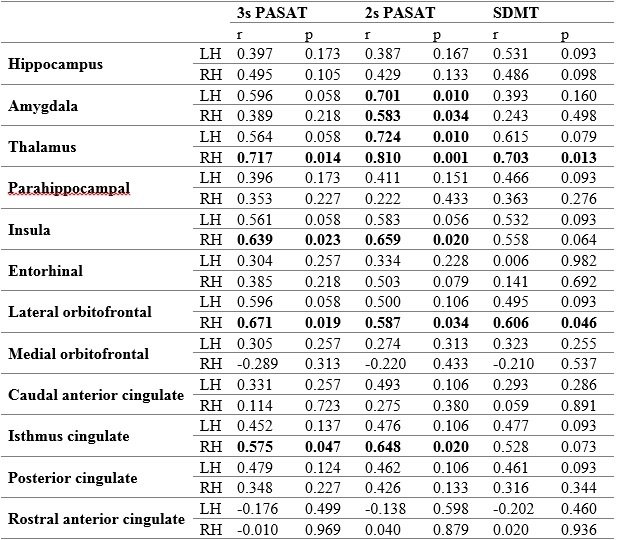
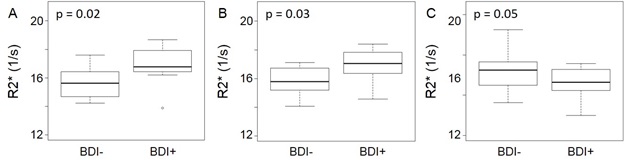
Group comparison results are shown in Fig.1. Correlations between R2*, NV and clinical scores were examined. The majority of significant correlations were found between R2* and clinical cognitive tests (PASAT & SDMT) in female SPMS patients, as shown in Table.1. Before applying multiple comparison correction, the results showed that patients with depression problems had higher R2* in the hippocampus of both hemispheres and lower R2* in the right entorhinal region, respectively. No significant differences were found for volumetric measurements. However, no significant differences were observed for either R2* or NV after applying multiple comparison correction.Discussion
Atrophy of the limbic system has been observed in MS5,6. Interestingly, both male RRMS and SPMS groups but not PPMS showed smaller left amygdala. Since SPMS were advanced from RRMS, this result indicates that atrophy might happen at the early stage. Lack of differences between PPMS and HC cohort is probably due to relatively small number of patient in PPMS cohort. It could be also related to that PPMS has a different clinical course which is the know tendency of PPMS patients to have more lesions in the spinal cord than in the brain. In this study, we found significant correlations of R2* with clinical scores in the limbic system. It is well known that the limbic system is involved in emotion learning and memory related functions and plays an important role in sound recognition. This study showed that R2* of female SPMS patients significantly correlated with 2s-PASAT, but not with 3s-PASAT, in amygdala. This could be due to that 2s-PASAT is more difficult than 3s-PASAT, which can easily stimulate patients’ emotional behavior and affect 2s-PASAT results. On the contrary, no significant correlations were found for volumetric measurements, indicating that R2* might provide sensitive complementary information to volumetric measurements. On the other hand, majorities of correlations were only found for progressive patients, indicating observable impairments of the limbic system only happens in the severe disease course. By comparing MS patients with (BDI+) and without (BDI-) depression, we found that BDI+ patients had higher R2* in hippocampus and lower R2* in right entorhinal area. The entorhinal cortex was thought to play an important role in many depression disorders7,8. BDI+ patients had higher R2* in hippocampus, this might be due to iron deposition in this region.Conclusion
Our finding showed that tissue specific R2* measurements could be used to detect and measure abnormalities in the limbic system in MS. The results showed significant group differences between MS subtypes. R2* significantly correlates with clinical cognitive tests. Our results also showed that R2*-defined tissue alterations in the hippocampus and entorhinal cortex could identify depression behavior in MS patients.Acknowledgements
The studies were funded by grants from the National MS Society and Conrad N. Hilton Foundation. Jie Wen was a postdoctoral fellow of the National MS Society (August 2014 to July 2016).References
1. Yablonskiy DA. Gradient echo plural contrast imaging (GEPCI) - New fast magnetic resonance imaging technique for simultaneous acquisition of T2, T1 (or spin density) and T2*-weighted images. Radiology. 2000;217:204-204.
2. Sati P, Cross AH, Luo J, Hildebolt CF, Yablonskiy DA. In vivo quantitative evaluation of brain tissue damage in multiple sclerosis using gradient echo plural contrast imaging technique. NeuroImage. 2010;51(3):1089-1097.
3. Luo J, Jagadeesan BD, Cross AH, Yablonskiy DA. Gradient echo plural contrast imaging--signal model and derived contrasts: T2*, T1, phase, SWI, T1f, FST2*and T2*-SWI. NeuroImage. 2012;60(2):1073-1082.
4. Wen J, Cross AH, Yablonskiy DA. On the role of physiological fluctuations in quantitative gradient echo MRI: implications for GEPCI, QSM, and SWI. Magnetic resonance in medicine. 2015;73(1):195-203.
5. Audoin B, Zaaraoui W, Reuter F, et al. Atrophy mainly affects the limbic system and the deep grey matter at the first stage of multiple sclerosis. J Neurol Neurosur Ps. 2010;81(6):690-695.
6. Benedict RH, Ramasamy D, Munschauer F, Weinstock-Guttman B, Zivadinov R. Memory impairment in multiple sclerosis: correlation with deep grey matter and mesial temporal atrophy. Journal of neurology, neurosurgery, and psychiatry. 2009;80(2):201-206.
7. Gerritsen L, Comijs HC, van der Graaf Y, Knoops AJG, Penninx BWJH, Geerlings MI. Depression, Hypothalamic Pituitary Adrenal Axis, and Hippocampal and Entorhinal Cortex Volumes-The SMART Medea Study. Biol Psychiat. 2011;70(4):373-380.
8. Furtado CP, Maller JJ, Fitzgerald PB. A magnetic resonance imaging study of the entorhinal cortex in treatment-resistant depression. Psychiat Res-Neuroim. 2008;163(2):133-142.
Figures