2550
Functional MRI detects a novel cerebral venous haemodynamic signal that is disrupted in early multiple sclerosis1Department of Anatomy and Neuroscience, University of Melbourne, Parkville, Australia
Synopsis
Here we report a novel haemodynamic signal using BOLD-weighted fMRI that is restricted to the internal cerebral veins and identifiable in all subjects assessed to date. This signal is oscillatory with peak power at 0.054 Hz. In early MS patients, venous power was diminished compared to controls. Venous power was inversely correlated with T2 lesion volume but not brain atrophy. These results indicate that neuroinflammation is associated with altered venous haemodynamics that could be attributable to venous structural damage previously reported in MS. This novel venous signal should also be investigated more broadly in cerebrovascular disease.
Introduction
The internal cerebral veins are located within the brain’s white matter and are a common entry point for infiltrating peripheral immune cells in the early stages of multiple sclerosis (MS). High resolution susceptibility weighted MRI has been used to identify altered density1-3 and calibre4 of the cerebral veins in people with MS. The aim of this study was to characterise the haemodynamics of these veins using function MRI, and to determine whether early MS is associated with altered venous haemodynamics.Methods
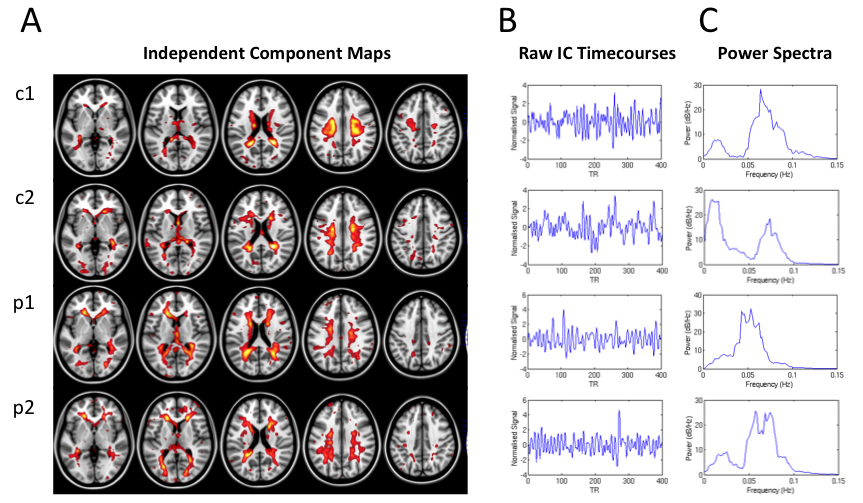
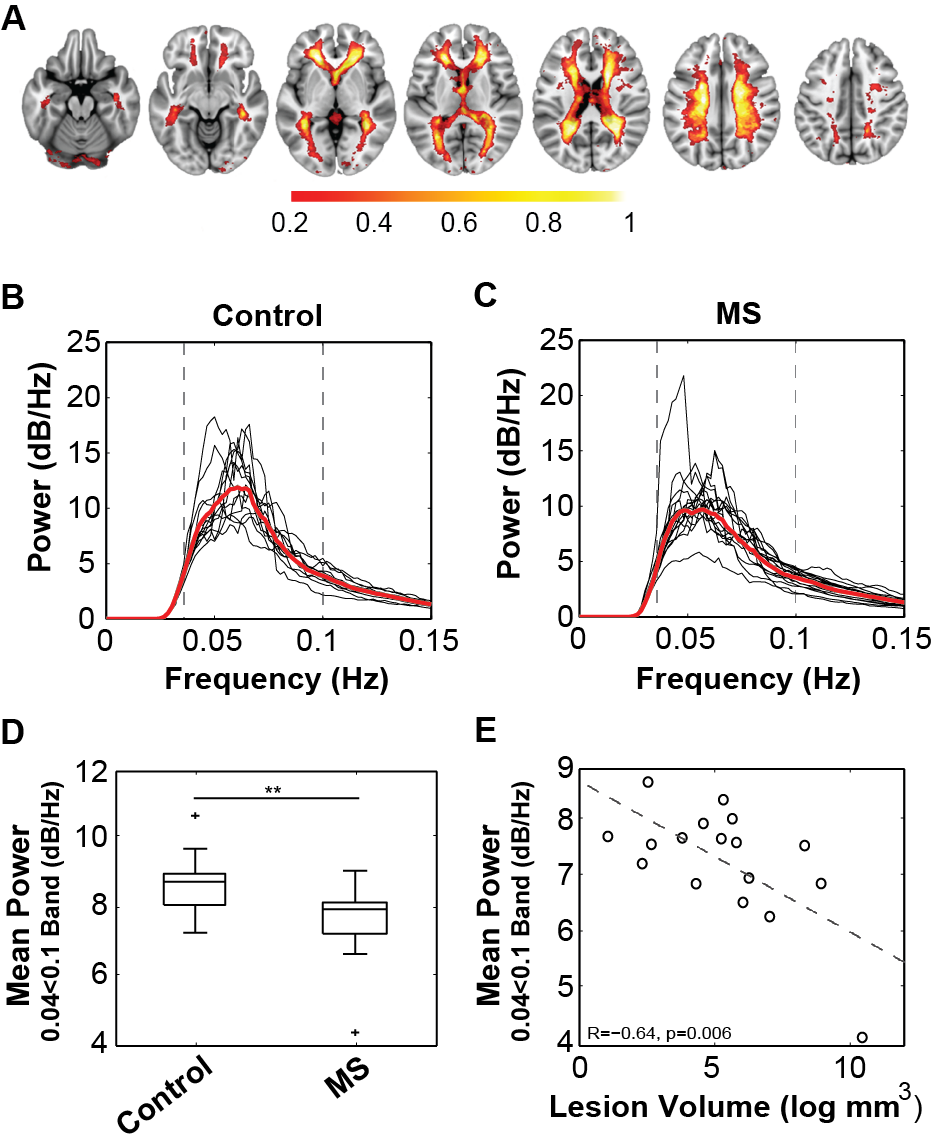
18 patients with MS diagnosed based on the 2010 McDonald criteria and 14 healthy control participants were recruited and imaged using a Siemens Trio 3T MRI system. All subjects were imaged using a BOLD-weighted EPI sequence (TR/TE = 1400/33ms; FA = 85°; resolution 2.5mm isotropic; axial acquisition; 440 volumes), as well as a 3D double inversion recovery image for lesion identification, and a 3D T1-weighted image for spatial registrations. BOLD-weighted MRI scans were processed using FSL MELODIC spatial-ICA software5. The venous component from the resulting IC maps was manually identified for each subject based on two distinct anatomical features: (a) within the white matter, and (b) in close proximity to the lateral ventricles. This component was identified in all subjects (Fig. 1). Each subject’s venous IC map was nonlinearly transformed to standard space using Advanced Normalisation Tools (ANTs)6. To generate a standard space atlas of the cerebral veins, each subject’s standard space venous IC map was thresholded (Z > 2.3), binarised and averaged across all subjects to obtain a map where each voxel value represented the proportion of subjects where that voxel was within the venous IC map (Fig. 2A). The venous probability map was used to calculate the weighted-average power-spectrum for all brain voxels’ fMRI timecouses (high pass filtered <0.035 Hz) for each subject using nonparametric multi-taper spectral decomposition7 implemented in the MATLAB® Signal Processing Toolbox. Voxels within T2 lesions in patients were omitted from further analysis to prevent bias from altered mean T2* signal. Average BOLD signal power within a conservatively judged peak region (0.04 to 0.1 Hz) was compared between patients and control subjects using a Student’s t-test. Pearson’s correlation analyses were performed between average power and logarithmically transformed lesion volume, BPF, GMF and WMF.
Results
Spectral decomposition of the VC time-course in each subject revealed a highly consistent peak frequency across all subjects (mean±SD=0.054±0.009 Hz) (Fig. 1C) that did not differ in frequency or spatial extent between groups. Average power in the 0.04 to 0.1 Hz peak frequency range was significantly lower in MS patients (6.70±0.94 dB/Hz) than controls (7.64±0.71 dB/Hz, P=0.006) (Fig. 2B-D). Variation in the mean power in this band in patients correlated significantly with T2 lesion volume (R=-0.64, P=0.006) (Fig. 2E), but not with non-inflammatory markers of brain injury including brain parenchymal (R = 0.22) grey matter (R = 0.31) or white matter (R = 0.33) fractions.Discussion
In this study we identified a novel haemodynamic signal using BOLD-weighted fMRI within the internal cerebral veins. This signal was characterised by a highly phasic oscillation with peak power around 0.06 Hz. In patients with early MS, the power of this signal was diminished and the degree of power loss was associated with the degree of neuroinflammatory lesion burden. Structural damage1-4 and reduced perfusion8 of the cerebral veins has previously been identified in MS cohorts and could be substrates of altered BOLD signal dynamics observed here.Conclusion
These results indicate that MS is associated with dysfunction of the cerebral veins that initiates early in the disease. The novel venous haemodynamic signal reported here could be a marker of cerebrovascular health that should also be investigated more broadly.Acknowledgements
S Kolbe is supported by a Peter Doherty NHMRC Fellowship APP1054147.
S Gajamange is supported by a MSRA Posgraduate Scholarship.
J Cleary is supported by a University of Melbourne McKenzie Research Fellowship.
References
1. Sinnecker T, Bozin I, Dorr J, et al. Periventricular venous density in multiple sclerosis is inversely associated with T2 lesion count: a 7 Tesla MRI study. Multiple sclerosis. 2013 Mar;19(3):316-25.
2. Zivadinov R, Poloni GU, Marr K, et al. Decreased brain venous vasculature visibility on susceptibility-weighted imaging venography in patients with multiple sclerosis is related to chronic cerebrospinal venous insufficiency. BMC Neurology. 2011;11:128.
3. Ge Y, Zohrabian VM, Osa EO, et al. Diminished visibility of cerebral venous vasculature in multiple sclerosis by susceptibility-weighted imaging at 3.0 Tesla. Journal of magnetic resonance imaging : JMRI. 2009 May;29(5):1190-4.
4. Gaitan MI, de Alwis MP, Sati P, Nair G, Reich DS. Multiple sclerosis shrinks intralesional, and enlarges extralesional, brain parenchymal veins. Neurology. 2013 Jan 8;80(2):145-51.
5. Beckmann CF, Smith SA. Probabilistic independent component analysis for functional magnetic resonance imaging. IEEE Trans Med Imaging. 2004 Feb;23(2):137-52.
6. Avants BB, Tustison NJ, Stauffer M, Song G, Wu B, Gee JC. The Insight ToolKit image registration framework. Frontiers in Neuroinformatics. 2014;8:44.
7. Thomson DJ. Spectrum Estimation and Harmonic Analysis (IEEE Proc). 1982;70(9):1055-96.
8. Varga AW, Johnson G, Babb JS, Herbert J, Grossman RI, Inglese M. White matter hemodynamic abnormalities precede sub-cortical gray matter changes in multiple sclerosis. J Neurol Sci. 2009 Jul 15;282(1-2):28-33.
Figures