2549
Rapid, high-resolution imaging of the central veins in multiple sclerosis at 1.5T, 3T, and 7T1Translational Neuroradiology Section, NINDS, National Institutes of Health, Bethesda, MD, United States, 2Siemens Medical Solutions, HC NAM USA DI MR COLLAB, Bethesda, MD, United States, 3InatiAnalytics, Potomac, MD, United States, 4Siemens Medical Solutions, HC NAM USA DI MR COLLAB NE, Boston, MA, United States
Synopsis
The central vein sign (CVS) detected by magnetic resonance imaging (MRI) may aid with the diagnosis of multiple sclerosis (MS). The ability to detect central veins in the brain at any magnetic field strengths would open the pathway for future large-scale research studies, and potentially routine clinical use, of the CVS for MS diagnosis. In this study, a fast high-isotropic-resolution, whole-brain T2*-weighted segmented echo-planar-imaging acquisition was implemented at 1.5T, 3T and 7T. Central veins inside multiple sclerosis lesions were detected at all three different field strengths.
Introduction
Recent research investigating various neurological conditions has accumulated evidence that the central vein sign (CVS) detected by magnetic resonance imaging (MRI) may have the ability to accurately differentiate multiple sclerosis (MS) from its mimics1. However, an imaging strategy, which would allow detection of the CVS at any magnetic field strengths in a clinically compatible time, is still lacking.Methods
A fast (< 6 min), high-isotropic-resolution, whole-brain T2*-weighted segmented echo-planar-imaging (EPI) prototype sequence was implemented with approximate SNR-matched protocols at 1.5T, 3T and 7T (MAGNETOM Aera, Siemens, Erlangen, Germany; 1.5T, voxel size = 0.75 mm3, TR = 64 ms, TE = 37 ms, FA = 10 deg, EPI factor = 15), (MAGNETOM Skyra, Siemens, Erlangen, Germany; 3T, voxel size = 0.65 mm3, TR = 64 ms, TE = 35 ms, FA = 10 deg, EPI factor = 15) and on a 7T research system (Siemens, Erlangen, Germany; voxel size = 0.5 mm3, TR = 52 ms, TE = 23 ms, FA = 10 deg, EPI factor = 15]. Three subjects (one healthy volunteer and two MS patients) were scanned on the 3 different MRI scanners. At both 1.5T and 3T, T2* acquisition for the MS patients was performed during the injection of gadolinium-based contrast agent (Gadavist, Bayer HealthCare Pharmaceuticals Inc., Whippany, NJ). At 7T, only native images were acquired.Results
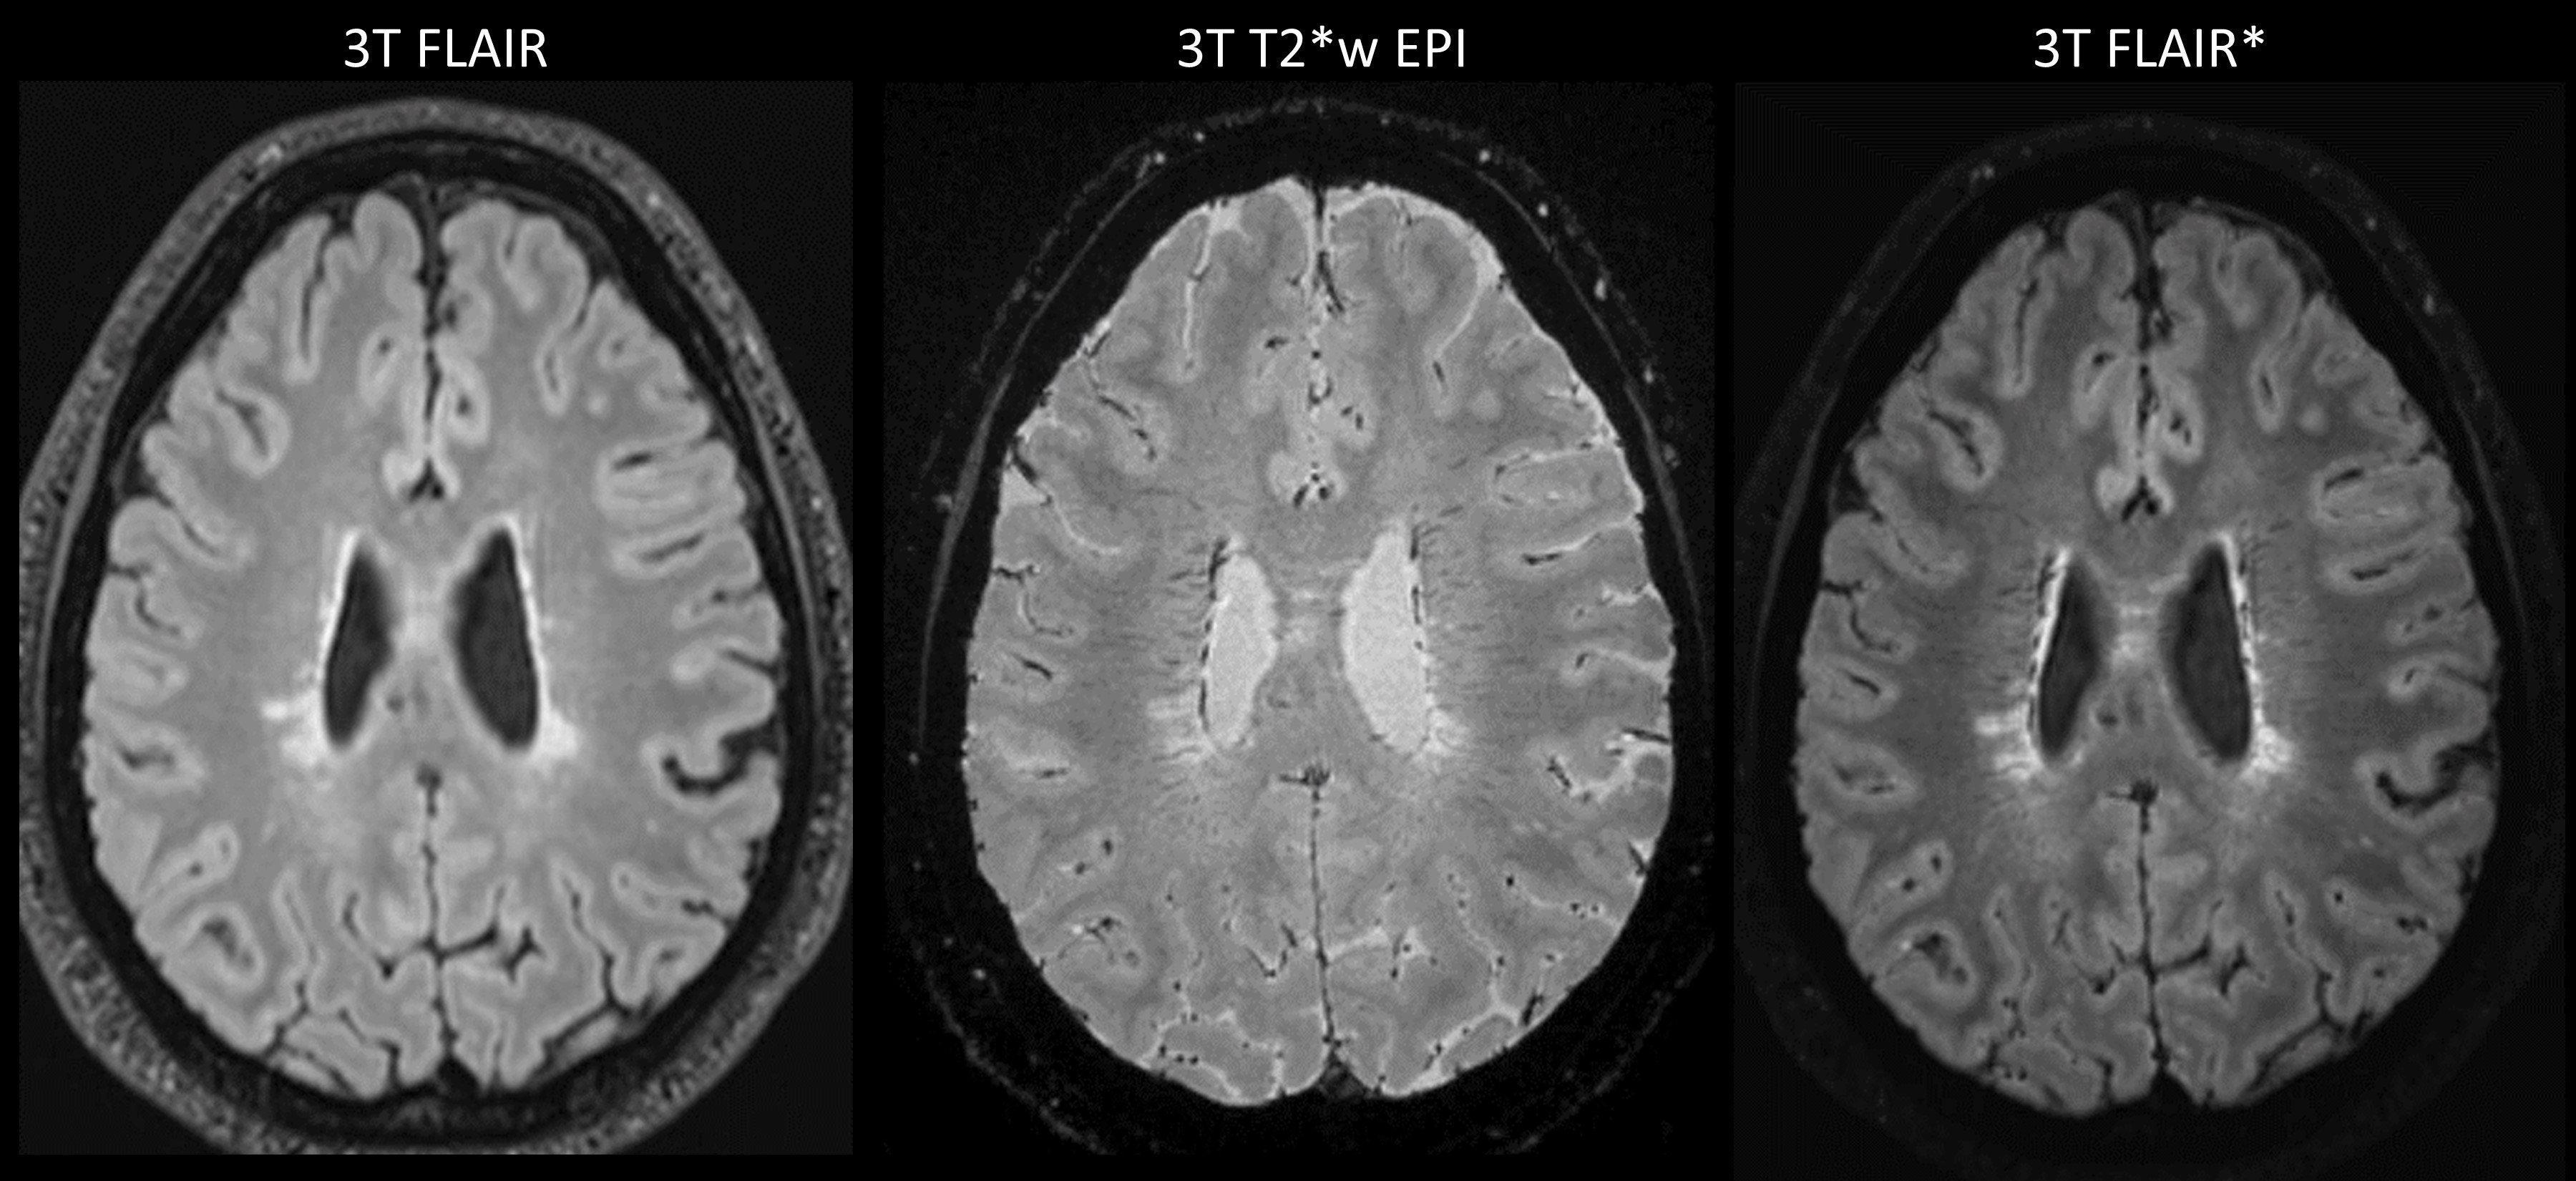
High-quality T2*-weighted brain images were obtained at 3 different magnetic field strengths in all subjects (Figure 1). Unlike standard FLAIR contrast, T2*-weighted contrast displays the central vein inside MS lesions (Figure 2), and can be combined to produce FLAIR* images2. The use of isotropic voxel dimensions for the T2* acquisition enabled the multi-planar reconstruction of the images, allowing straightforward detection of the central vein regardless of its orientation in the brain (Figure 3). In this pilot study, a total of 5 focal MS lesions (diameter > 3 mm) with a central vein were detected on all 3 T2*-w scans (1.5T, 3T and 7T) in the MS patients. However, the increase in image resolution and improved T2*-weighting at 7T allowed to readily detect the central vein without the use of contrast agent (Figure 3).Discussion/Conclusion
This pilot study demonstrates the feasibility of
imaging central veins in MS brains at 1.5T, 3T and 7T, in a clinically compatible
time using a strategy based on segmented EPI. This approach opens the pathway
for establishing a standardized MRI acquisition for future large-scale research
studies, and potentially routine clinical use, of the CVS for MS diagnosis.Acknowledgements
This research was supported in part by the Intramural Research Program of the National Institute of Neurological Disorders and Stroke.References
1. Sati P, Oh J, Constable RT, et al. The central vein sign and its clinical evaluation for the diagnosis of multiple sclerosis: a consensus statement from the North American Imaging in Multiple Sclerosis Cooperative. Nature Reviews Neurology (in press).
2. Sati P, George IC, Shea CD, et al. FLAIR*: a combined MR contrast technique for visualizing white matter lesions and parenchymal veins. Radiology 265, 926–932 (2012).
Figures