2544
Cortical Surface Magnetization Transfer Ratio Decreases in Multiple Sclerosis are Age and Region DependentDavid A. Rudko1, Josefina Maranzano1, Douglas L. Arnold1, and Sridar Narayanan1
1McConnell Brain Imaging Centre, Montreal Neurological Institute and Hospital, McGill University, Montreal, QC, Canada
Synopsis
Cortical pathology may be a substrate of worsening clinical symptoms in MS patients. However, the rate at which cortical pathology develops and the brain locations affected are not well known. The goal of this study was to evaluate longitudinal, age-related reductions in cortical surface magnetization transfer ratio (csMTR) of MS patients. Such reductions may be sensitive to sub-pial demyelination occurring over time.
Introduction
It is now widely recognized that
standard MR imaging of multiple sclerosis (MS) can visualize only a fraction of
the disease burden in cortical gray matter (cGM). In particular, conventional
MRI applied at the clinically
accessible MRI field strengths of 1.5 or 3 Tesla (T) cannot adequately detect
the cortical gray matter pathology observed in postmortem studies, even though
cGM pathology is believed to play a significant role in both cognitive
dysfunction and worsening clinical symptoms1-3. In this study, we
address these issues using multi-surface, longitudinal measurements of
magnetization transfer ratio (MTR) at the clinically-accessible MRI field
strength of 3 T.Methods:
25 MS patients and 12 controls, recruited from the MS Clinic of the Montreal Neurological Institute, were imaged using anatomical and magnetization transfer imaging with 3 T MRI. To evaluate longitudinal changes in csMTR, 18 patients and 10 controls were imaged at baseline and at a two-year time point. Cortical surface meshes were generated on the inner, middle and outer cortex (Fig. 1). csMTR values were then smoothed onto these surfaces using 10 mm full width half-maximum geodesic smoothing kernel. Subsequently, vertex-wise statistical analysis of csMTR differences between MS patients and controls was carried out using a general linear mixed-effects model at the group level. The mixed-effects model included fixed effects terms for both age and group (either MS or controls), as well as a random subject-specific effects term that induced equal correlations between observations of the same subject. The Desikan-Killiany cortical surface atlas was then used to perform longitudinal, mixed model analysis at the ROI level examining: (i) group-level, age-related decline in csMTR of MS patients relative to controls and (ii) age-adjusted group mean differences in csMTR between MS patients and controls. As an added nuance, survival curve models of csMTR on each cortical surface layer were constructed to explicitly compare the hemisphere-wide reduction of csMTR between the three cortical layers.Results:
The vertex level statistical analysis in Fig. 2 identifies that a larger percentage of outer cortical surface shows decreased csMTR compared to the inner surface (from 27.18% along the outer surface to 7.24 % along the inner surface). This finding is in keeping with recent parallel observations from 7 T MRI1. Figure 3 shows that csMTR of MS patients is significantly correlated with age in the posterior cingulate cortex along all cortical surface layers. By contrast, in Desikan-Killiany ROIs defining the rostral anterior cingulate, paracentral, posterior cingulate and supramarginal gyri and the precuneus, age-related csMTR decreases were found only along the outer/mid cortices. The aforementioned regions are involved in executive function and processing speed through thalamo-cortical circuits. Overall, in outer cortical ROIs defined by the Desikan-Killiany surface atlas, there was an average 0.092 csMTR units/yr decrease with age. By contrast, along the mid and inner cortices, the corresponding csMTR decreases were significantly smaller: 0.039 csMTR units/yr and 0.046 csMTR units/yr respectively. Fig 4 shows survival curve-style models of csMTR for the MS patient group in the left and right hemispheres independently. The green survival curves for the outer cortical layer identify that more vertices along this layer have larger csMTR reductions in the MS patient group. Based on Fig. 4, there are statistically significant differences (computed using a log-rank test) between the outer and inner survival curves at the level p < 0.05 in both the left and right hemispheres of MS patients. Such differences were not observed between the inner and mid surfaces or between the mid and outer surfaces.Discussion and Conclusions:
There is a critical need for fast, efficient quantitative MRI methods to track cortical pathology in MS at clinically-accessible field strengths of 1.5 and 3 T. Our results suggest that csMTR maps, particularly those created using the outer cortical boundary, are capable of identifying a subset of cortical pathology that has been identified in post-mortem immunohistochemistry4. Reductions of csMTR in MS patients increase with age (Fig. 3) and are most prevalent in the posterior cingulate cortex, as well as in nodes of the thalamo-cortical circuits along the mid and outer cortical boundaries. Our method shows promise for the sensitive detection of whole brain cortical pathology. As such, it may have utility in the assessment of novel neuroprotective therapies catered toward the biology of specific cortical molecular targets implicated in MS.Acknowledgements
We are especially grateful to all the study participants. The authors also wish to thank Ms. RozieArnaoutelis for her invaluable assistance in obtaining consents from and schedulingexaminations for both patients and controls. D.A.R was supported in part by an endMSPostdoctoral Fellowship from the Multiple Sclerosis Society of Canada. Additionally, the authorswish to acknowledge funding from CIHR MOP# 84367 for this studyReferences
(1) Mainero et al., 2015, (2) Nielsen et al. 2013, (3) Papadopoulou et al. 2013, (4) Howell et al., 2011.Figures
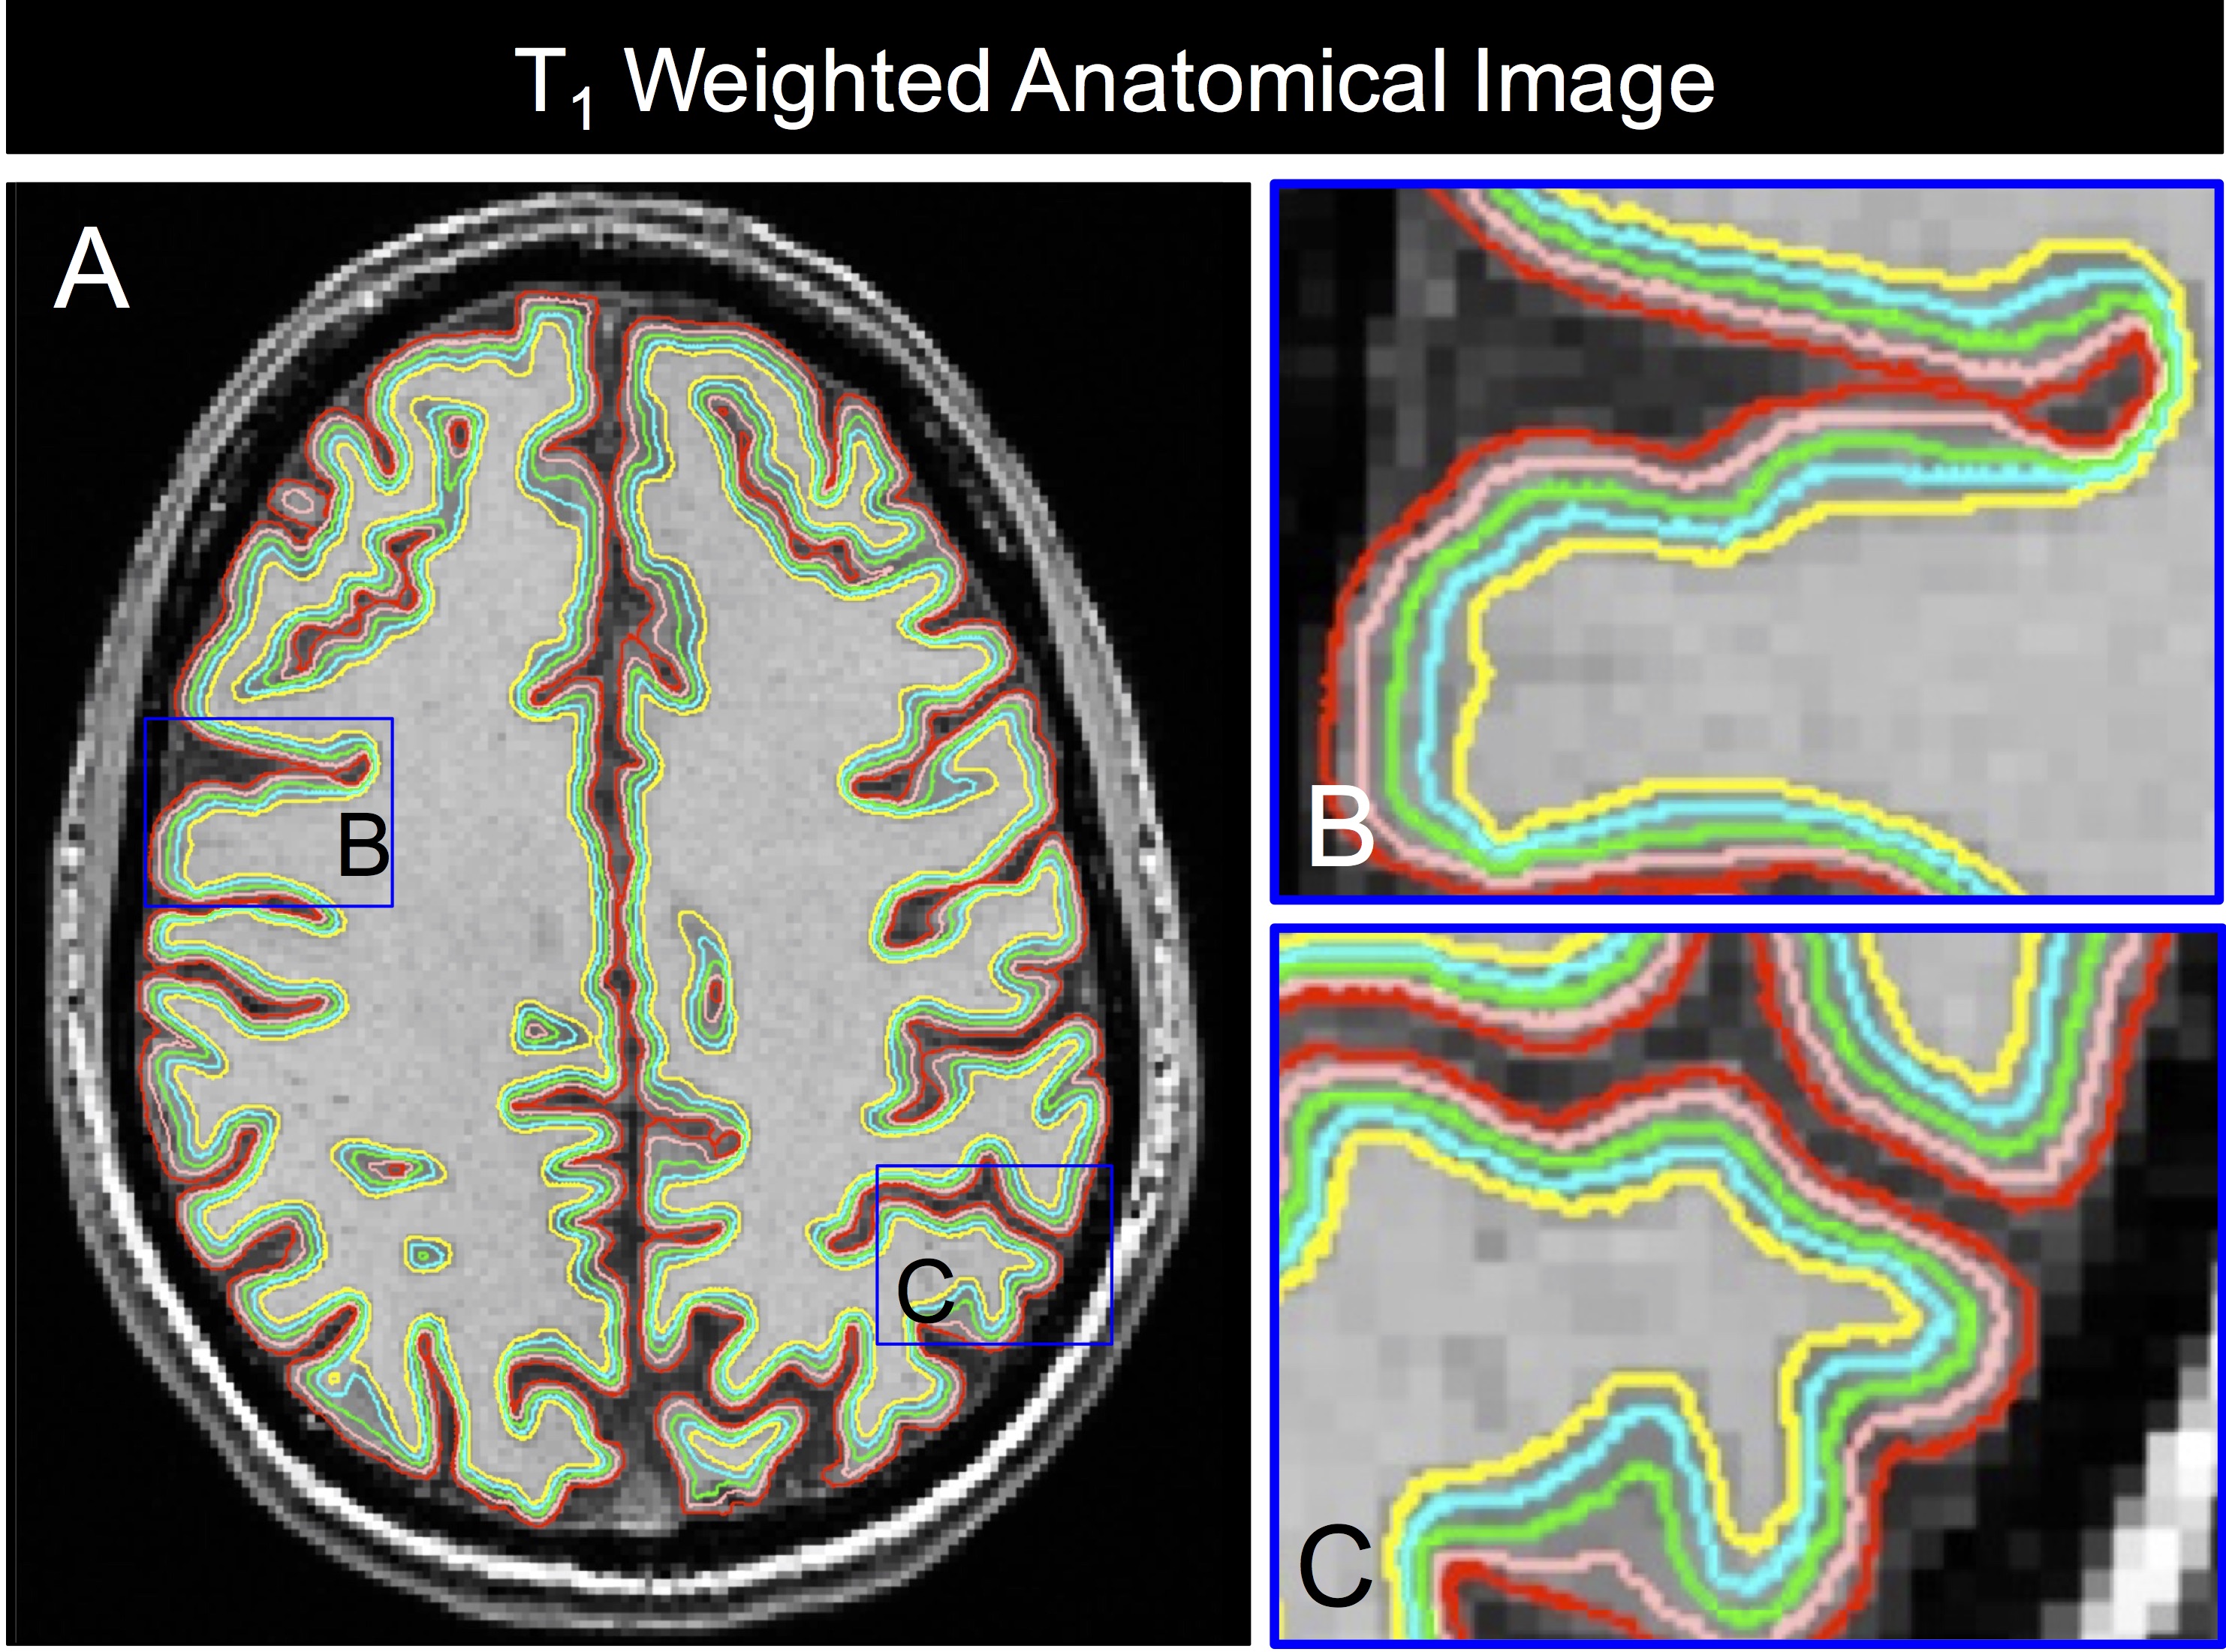
Figure 1: Cortical
surface segmentations of the inner (cyan), mid (light green) and outer (pink)
cortical surface layers applied for csMTR computation in our study.
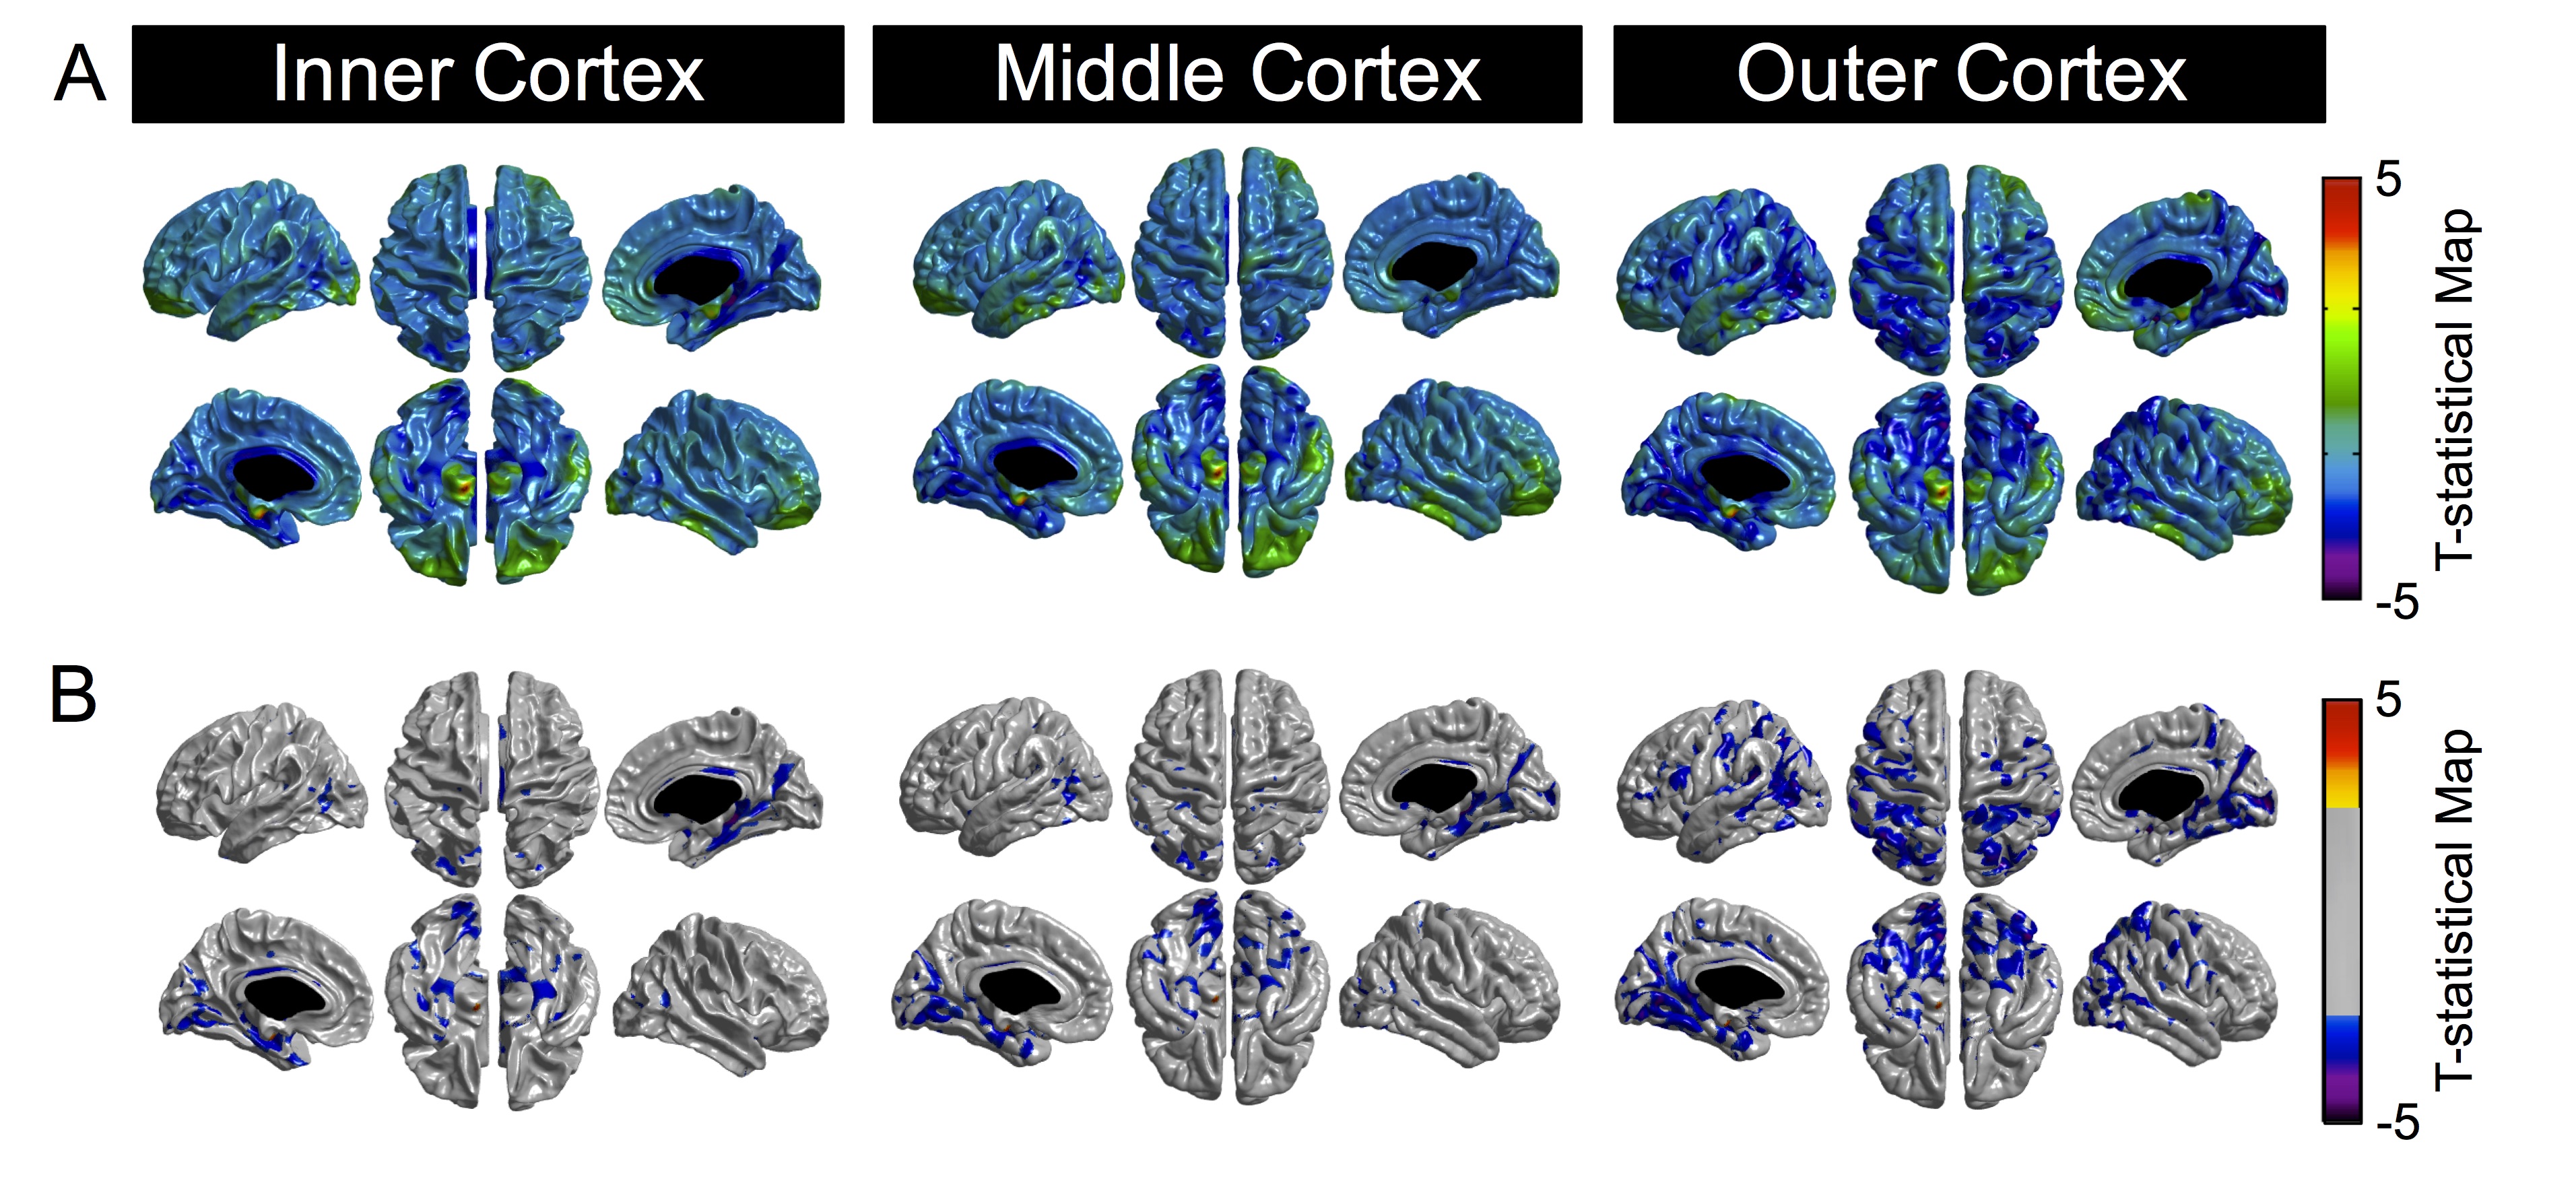
Figure 2: Group registered, t-statistical maps for inner, mid and outer
cortical surfaces displaying
regions of significant csMTR decrease in patients compared to
controls. All maps have been multiple comparisons-corrected using the false
discovery rate (FDR) technique with
q=0.05. The surface
maps in Fig. 2B have been thresholded to show only the relevant t-statistical
values above the FDR threshold. The inter-hemispheric cut has been masked-out
(blacked-out regions) to remove spurious MTR values from this region.
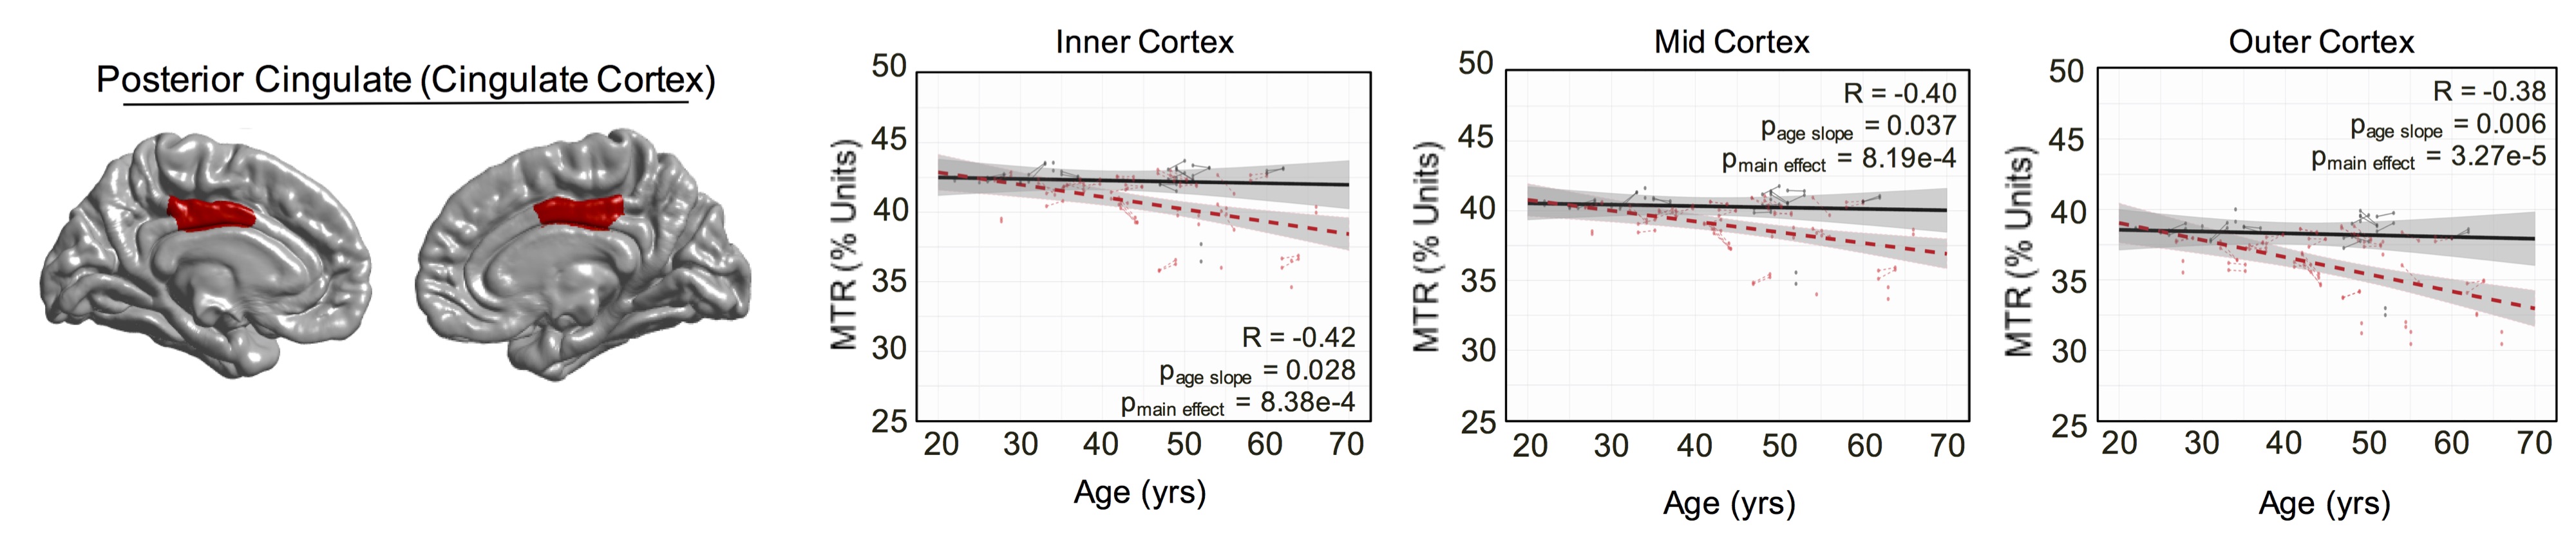
Figure 3: Age-related
Decreases in csMTR in the posterior cingulate cortex are significant along all
cortical surface layers.
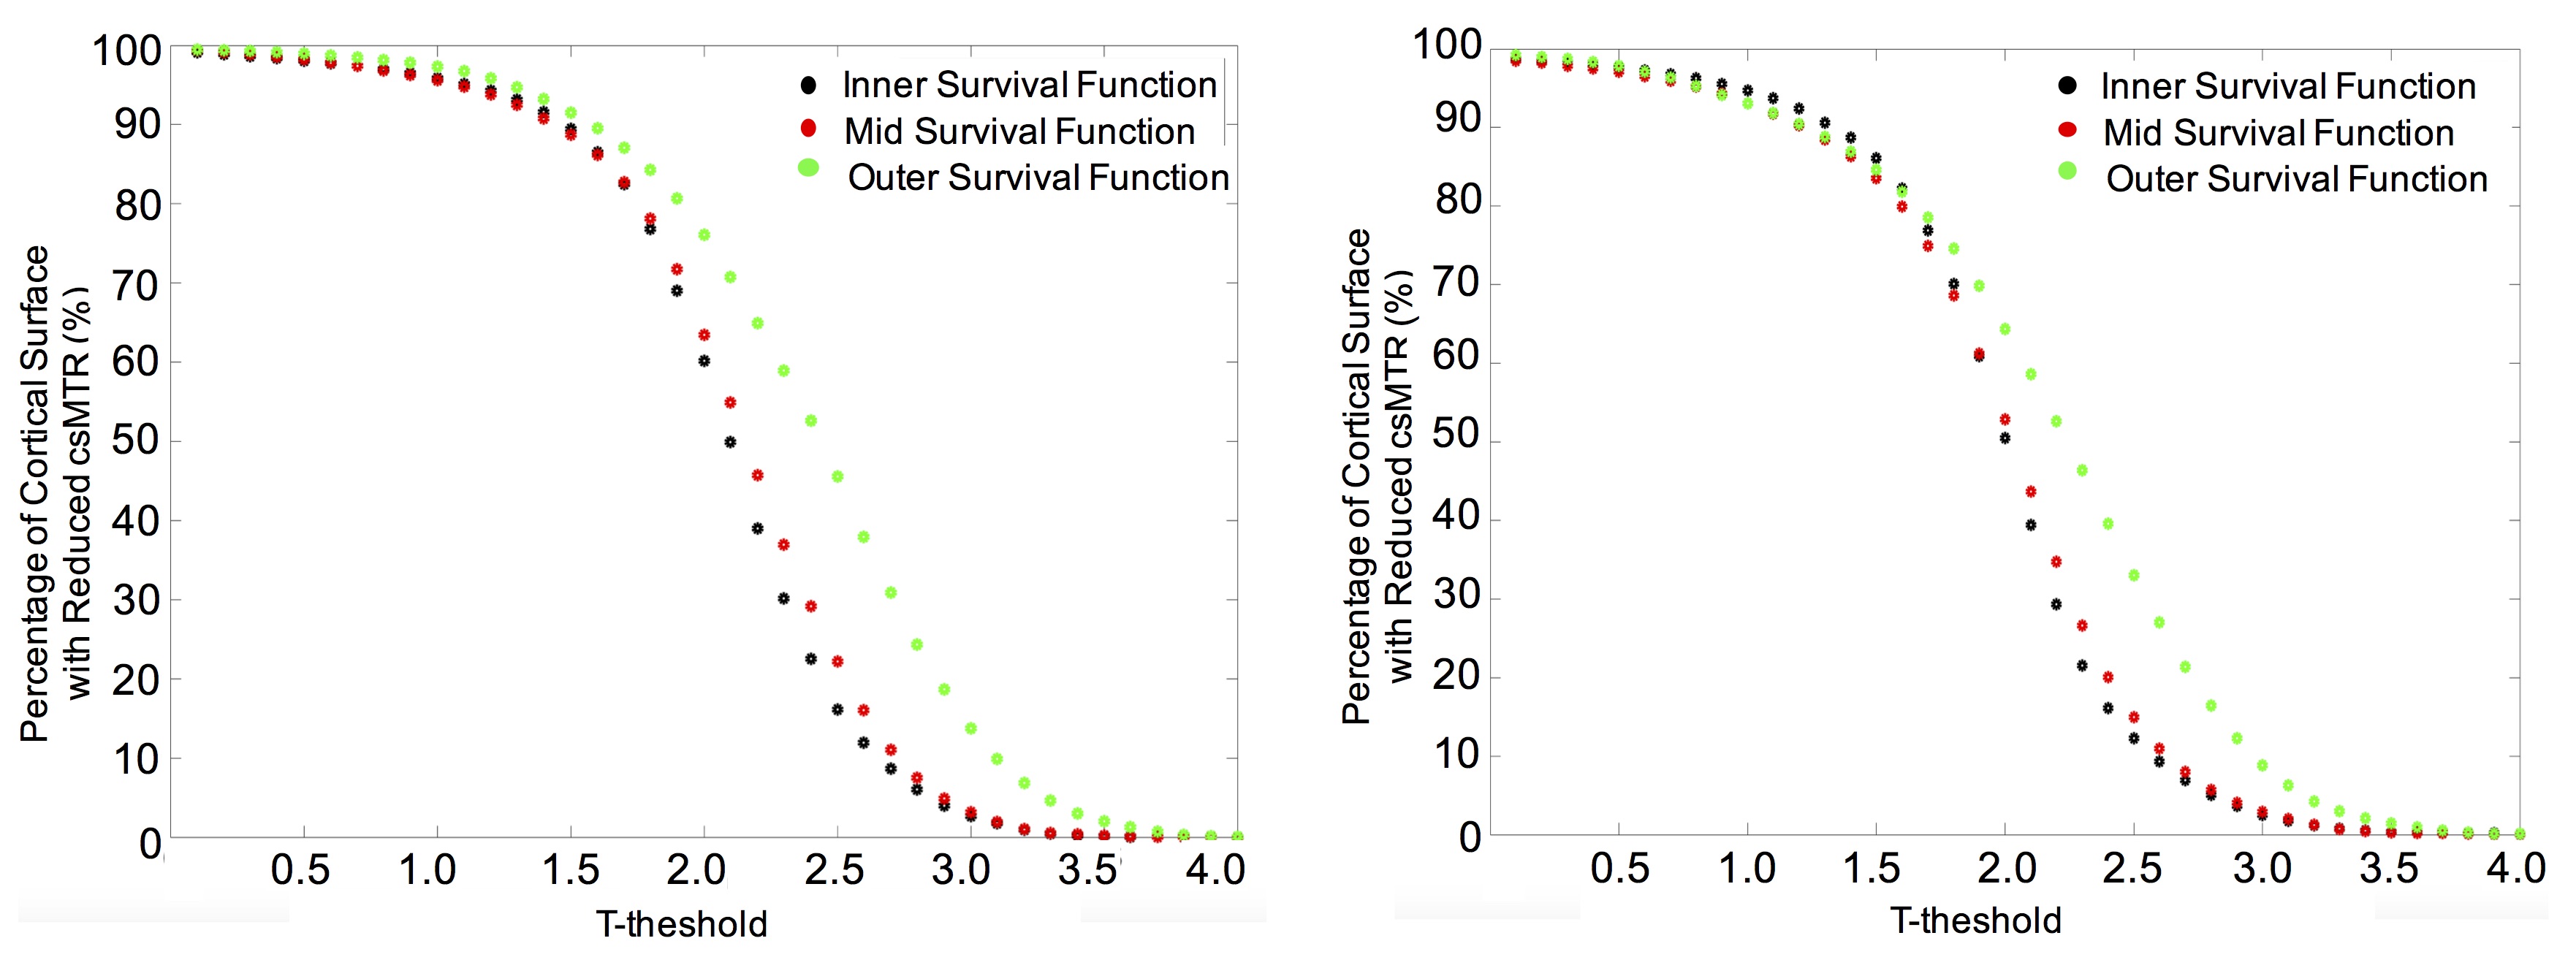
Figure 4: Survival
curve models of reduced csMTR for left and right hemispheres of MS
patients at the group level. The green survival curve for the outer cortical
layer identifies that more vertices along this layer have larger csMTR
reductions. There are statistically significant differences (computed using a
log-rank test) between the outer and inner survival curves at the level p <
0.05.