2543
Pushing the limits of synthetic MRI in the evaluation of patients with Multiple Sclerosis: how much can the acquisition time be reduced?1DASA, Rio de Janeiro, Brazil, 2Universidade Federal Fluminense, Rio de Janeiro, Brazil, 3GE Healthcare Brazil, Rio de Janeiro, Brazil, 4GE Healthcare Brazil, 5UFRJ, Rio de Janeiro, Brazil, 6DASA, Sao Paulo, Brazil
Synopsis
In synthetic MRI, the recently developed multi delay multi–echo fast spin echo sequence (MDME) with posterior mathematical fitting provide multiple image contrasts in a single sequence acquisition and lead to potential acquisition time reductions. In this study, both, a synthetic MRI and conventional post contrast acquisition protocol for the evaluation of patients with Multiple Sclerosis were compared. Significant acquisition time reduction were achieved with synthetic MRI without neglecting lesion count capabilities
Introduction
The conventional acquisition protocols in a daily routine of hospitals and clinics for the evaluation of patients with multiple sclerosis commonly include a broad spectrum of sequences with different image weightings. This leads to long acquisition times reducing this way patient comfort. Recently, a new synthetic MRI technique was developed, to create multiple image contrasts based on a single a multi delay multi–echo fast spin echo sequence (MDME), that provides reduction in scan times, increasing this way patients comfort and potential increase a clinical workflow. The purpose of this study was to compare our standard clinical acquisition protocol with a short synthetic MRI protocol based on MDME sequence in patients with multiple sclerosis for lesion detection purpose and scan time reduction.Methods
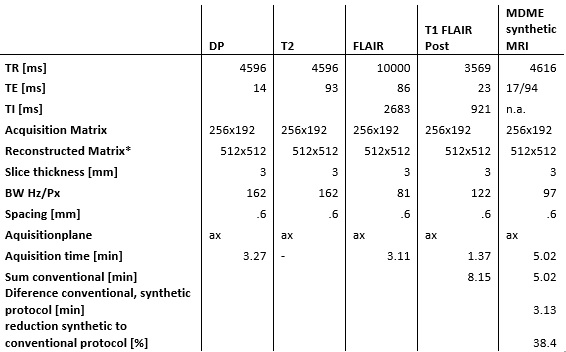
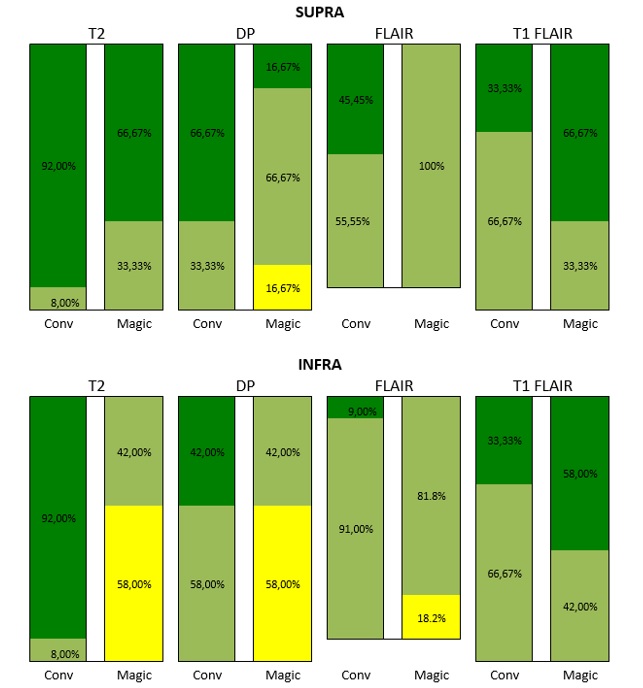
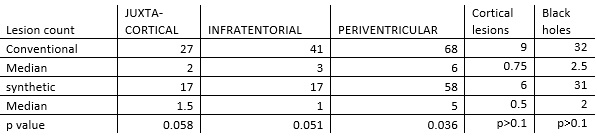
12 relapsing-remitting multiple sclerosis patients following the Mc Donald criteria1 with a wide range of disease duration and expanded disability status scale scores, underwent MRI at 1.5 T (Optima 450w, GE, USA). The acquisition protocol was divided into two steps: 1:a clinical routine acquisition protocol, including individual sequences (pre-contrast: T1 FLAIR ax, post contrast: FLAIR ax, T2 ax, DP ax, T1 FLAIR axial, Figure 1), 2:a single synthetic MRI (MDME FSE, Magic, GE, Milwaukee, USA) sequence included within the post contrast protocol in the axial plane with same resolution and slice position as conventional sequences (Figure 1). Raw images were post processed offline to produce T1w FLAIR, T2w, DPw and FLAIR images with selected TR, TE and TI to fit the conventional equivalent imaging weightings. An experienced Neuroradiologist (10 y) evaluated the exams offline in a random order in 2 sessions 1 week apart (first session:evaluation of conventional images, second session evaluation of synthetic images). To evaluate overall perceived image quality a 4 level scale was used (1:poor-artifacts limiting the lesion detection, 2:sufficient-artifacts not limiting the lesion detection, 3:good-low artifacts, and 4:excellent-comparable with conventional images) within 2 regions (infratentorial and supratentorial brain segments). The number of MS T2/FLAIR lesions (disease burden), the number of T1 post-contrast enhancing lesions (active disease) were counted in the following locations: periventricular, juxta-cortical (including U fibers lesions), cortical (considered when juxtacortical lesions involved the cortex) and infratentorial. Normality of distribution was tested using the Shapiro Wilk normality test. To evaluate differences in perceived image quality and lesion count of both protocols the Wilcoxon signed rank test was applied (significance level p<0.05).Results and Discussion
Results of radiological image assessment are represented in Figure 2. No image was rated as poor, all images were sufficent rated. DPw and T2w synthetic rating was significantly lower rated in the supratentorial compared to the infratentorial segment (DPw:median 2.5 versus 3.5, p=0.009, T2w:median 3 versus 4, p=0.042). Diffuse signal alteration in this region, probably related to anatomical confounding factors as increased number of fiber bundles in this region, might be the reason for this perception, and needs further analysis. Synthetic FLAIR images were rated to be lower within supratentorial and infratentorial segments, in 18 % were rated as sufficient quality, although pulsation artifacts were expected2. Lesion count was higher in conventional imaging compared to synthetic imaging, but they were no statistically significant differences in the juxta cortical, infratentorial and cortical lesion counts and black hole counts, unless for the periventricular region (median 6 versus 5, p<0.036),Figure 3. The higher lesion detection by the conventional method in the infratentorial region might be related to the higher proportion of sufficient image quality rating within DP and T2 sequence within the synthetic images (41 versus 17, respectively). The total scan time of the post contrast conventional sequences were 8.15min and synthetic MR sequence of 5.02 min. This correspond to approximately 40% reduction in post contrast acquisition time using synthetic MRI. Considering the time intervals between the conventional sequences could further increase this reduction. Strengths of this study: the reduced scan time in addition with the for diagnostic purposes recommended 3 mm slice thickness procotol, only with 4 mm slice thicnkess3 to the best of our knowledge. Limitations: no interrater reproducibility was evaluated, the small number of patients, that will be addressed in future studies together a longitudinal study for follow up applicability. Further root cause analysis of the diffuse signal alteration within DP and T2 images in the infratentorial segment needs to be addressed.Conclusion
There was significant reduction in acquisition time with synthetic MRI compared to conventional sequences with reduction in perceived image quality in synthetic images but without neglecting lesion detection capacity in most regions.Acknowledgements
No acknowledgement found.References
1. Polman CH, Reingold SC, Banwell B et al. Diagnostic criteria for Multiple sclerosis:2010 revisions for the McDonald criteria. Ann Neurol 2011; 69:292-302.
2. Warntjes JB, Leinhard OD, West J, et al Rapid magnetic resonance quantification on the brain? Optimization for clinical usage. Magn Reson Med 2008; 60:320-29.
3. Granberg T, Uppman M, Hashim F, et al. Clinical Feasibility of Synthetic MRI in Multiple Sclerosis: a diagnostic and volumetric validation study. Am J Neuroradiol 2016; 10.3174
Figures