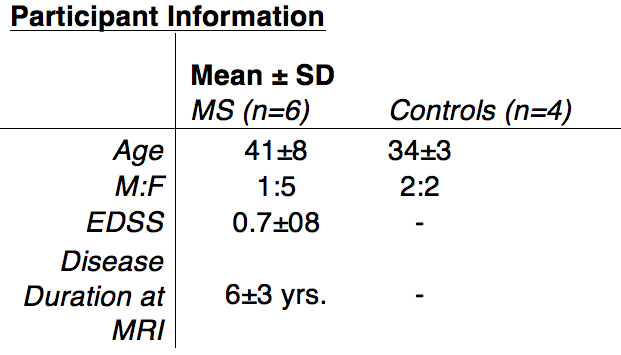
2542
Ultra High Field Regional Quantitative Susceptibility Mapping in Patients with Relapsing-Remitting Multiple Sclerosis: A Pilot Study1Melbourne Brain Centre Imaging Unit, Department of Anatomy and Neuroscience, University of Melbourne, Parkville, Australia, 2MS Research Group, Department of Anatomy and Neuroscience, University of Melbourne, Parkville, Australia
Synopsis
Multiple sclerosis (MS) is typically characterised by hyperintense T2 white matter lesions. However, the quantity and location of these may not correlate to a patient’s functional state or impending disease progression. Quantitative susceptibility mapping (QSM) is an emerging biomarker associated with tissue iron concentration and regions of demyelination in white matter. This pilot study examined both clinical and MRI parameter relationships to the QSM value over a number of brain regions in patients with mild (EDSS =or<2) relapsing and remitting MS.
Purpose and Background
Multiple sclerosis (MS) is an autoimmune, demyelinating inflammatory condition diagnosed radiologically by the presence of hyperintense white matter lesions on T2-weighted sequences(1). However, the quantity and location of these lesions often does not correlate to a patient’s functional state or give warning of disease progression. Quantitative susceptibility mapping (QSM) (2,3) is an emerging biomarker for a number of neurodegenerative diseases and an increasing susceptibility value, strongly associated with higher iron concentration (particularly in deep grey matter structures) (4,5) and regions of demyelination in white matter. We performed a pilot study to assess possible relationships in the QSM value to both clinical and other MRI parameters, in mild (Expanded Disability Status Scale, EDSS =or<2) relapsing and remitting MS patients. This may give us some insight into the effect size needed for more comprehensive QSM evaluations. Additionally, as the magnitude of the susceptibility value depends on main magnetic field strength, we hypothesised that 7T MRI could be more sensitive to regional differences in these patients with low disability scores.Methods
All imaging was conducted with approval of the University of Melbourne Human Research Ethics Committee. 10 age-matched subjects (4 healthy controls, 6 MS patients, age 33-56 yrs) were recruited for this study. Group characteristics are displayed in Table 1. MRI was conducted on a 7T research system (Siemens Healthcare, Erlangen, Germany), using a 32-channel receive/volume transmit head coil (Nova Medical, Wilmington MA, USA). 9-echo bipolar 3D gradient-echo images were acquired for QSM calculation (TEs/TR/FA:5-21ms/24ms/13°,0.75mm-iso). MP2RAGE comprising a structural image and T1 map (TE/TR/TIs/FAs:2.9ms/4.9s/0.7+2.7s/5+6°, 0.9mm-iso resolution), 2D FLAIR (TE/TR/TI:96ms/10s/2.6s, 0.3x0.3x4mm) were also acquired for lesion detection. Post-processing pipeline: All images were rigidly registered (niftyReg, TIG UCL)(6) to a bias-field corrected version of the 1st echo image used for QSM. MP2RAGE-UNIDEN anatomical volumes were then processed in Freesurfer (v6 dev. build July 2016)(7) using the -hires flag. QSM processing: After discarding even echoes in the GRE acquisition, phase unwrapping was performed with FUDGE(8), background phase removal using V-SHARP and final QSM calculation using iLSQR (both part of STI Suite, Duke University). Final values used the mean QSM data from all 5 echo maps. Regions from the Freesurfer ‘aseg’ segmentation volume was used to create regional volumes and measure quantitative T1 and QSM values.Results
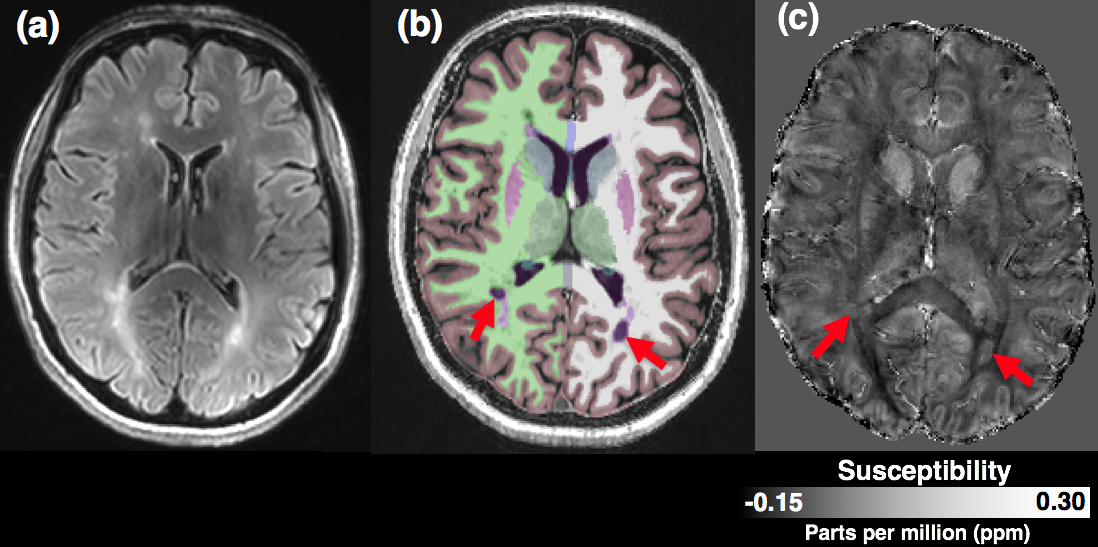
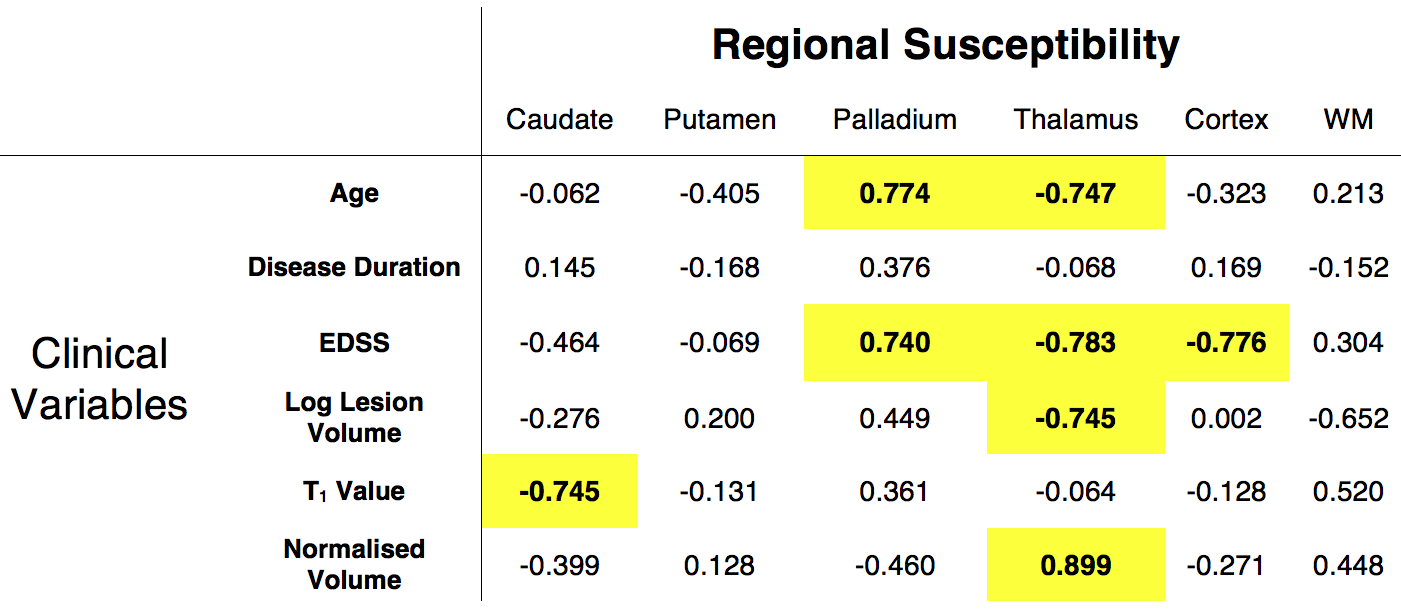
Automated Freesurfer segmentation fitted plausible brain anatomy from the 7T MP2RAGE structural image in all subjects. In particular, the deep grey matter structures (globus pallidus, putamen and caudate) corresponded well visually to regions of high susceptibility on QSM maps (representative subject in Figure 1). Despite low EDSS scores, lesion volume was found to vary across all 6 patients (range 66 to 9351mm3), in a non-Gaussian manner and was log transformed. Computing the correlation coefficient (R) of regional QSM values to clinical and MR parameters in the patient group, we found associations between age, EDSS, regional T1 value and TIV-normalised volume (summarised in table 2). The strongest associations were with QSM values in the thalamus and palladium.Discussion and Conclusion
This pilot study aimed to perform regional measurements of magnetic susceptibility in patients with relapsing-remitting MS using QSM at ultra high field. Despite the small number of patients studied, we observed strong correlations between QSM values in several subcortical grey matter structures and disease severity and demographic variables. We noted higher susceptibility associated with age and EDSS in the iron rich structure, the palladium, indicating iron deposition associated with neurodegeneration as has previously been reported(4,5). Additionally, we observed lower susceptibility in the thalamus that was associated with age, EDSS, lesion volume and thalamic volume. These changes could indicate differences in the ratio of grey and white matter in this cytoarchitecturally complex structure. This pilot work forms part of an ongoing study examining MRI correlates of motor and gait disturbances in MS and suggests that the QSM value may offer information into disease state.Acknowledgements
J.O.C. is supported by a University of Melbourne McKenzie Fellowship. S.C.K. is supported by the National Health and Medical Research Council. We thank Siemens Healthcare for technical assistance and access to the works-in-progress MRI sequences mentioned. The MBCIU 7T MRI system and A.N. are supported by the Australian National Imaging Facility (NIF). High-performance computing support provided by the Multi-modal Australian ScienceS Imaging and Visualisation Environment (MASSIVE).References
1. Rovira, À., Wattjes, M. P., Tintoré, M., Tur, C., Yousry, T. A., Sormani, M. P., et al. (2015). Evidence-based guidelines: MAGNIMS consensus guidelines on the use of MRI in multiple sclerosis-clinical implementation in the diagnostic process. Nature Reviews Neurology, 11(8), 471–482.
2. Haacke EM, Liu S, Buch S, Zheng W, Wu D, Ye Y. Quantitative susceptibility mapping: current status and future directions. Magn Reson Imaging. 2015 Jan;33(1):1-25.
3. Liu C, Wei H, Gong NJ, Cronin M, Dibb R, Decker K Quantitative Susceptibility Mapping: Contrast Mechanisms and Clinical Applications. Tomography. 2015 Sep;1(1):3-17.
4. Langkammer C, Liu T, Khalil M, Enzinger C, Jehna M, Fuchs S, Fazekas F, Wang Y, Ropele S. Quantitative susceptibility mapping in multiple sclerosis. Radiology 2013, 267(2), 551–9
5. Zivadinov R, Heininen-Brown M, Schirda CV et al. Abnormal subcortical deep-gray matter susceptibility-weighted imaging filtered phase measurements in patients with multiple sclerosis: a case-control study. NeuroImage 2012;59:331-339.
6. Modat M, et al. (http://cmictig.cs.ucl.ac.uk/component/content/article/software/niftyreg)
7. Fischl, B., van der Kouwe, A., Destrieux, C., Halgren, E., Segonne, F., Salat, D.H., Busa, E., Seidman, L.J., Goldstein, J., Kennedy, D., Caviness, V., Makris, N., Rosen, B., Dale, A.M., 2004b. Automatically parcellating the human cerebral cortex. Cereb Cortex 14, 11-22.
8. Ng A et al. Fast Unwrapping Using Discrete Gradient Evaluation (FUDGE): An Analytical Correction to the Laplacian-Based Phase Unwrapping Technique for Discrete Data. Proc ISMRM Singapore 2016 #27
Figures