2541
Reduced fibre density in the visual pathways of multiple sclerosis patients with optic neuritis1Department of Anatomy and Neuroscience, University of Melbourne, Melbourne, Australia, 2The Florey Institute of Neuroscience and Mental Health, Melbourne, Australia, 3Department of Radiology, Royal Melbourne Hospital, Melbourne, Australia, 4School of Psychological Sciences and Monash Institute of Cognitive and Clinical Neurosciences, Monash University, Melbourne, Australia, 5Department of Neurology, Royal Melbourne Hospital, Melbourne, Australia, 6The Florey Department of Neuroscience and Mental Health, University of Melbourne, Melbourne, Australia, 7Department of Medicine, University of Melbourne, Melbourne, Australia
Synopsis
Axonal degeneration is a key pathological driver of disability in multiple sclerosis (MS). Treatments aiming to reduce or reverse axonal degeneration in MS require sensitive and specific markers. Here we explore putative fibre-specific markers of axonal degeneration based on diffusion-weighted MRI metrics – fibre density and fibre bundle cross-section. MS patients with optic neuritis were compared to control subjects. We identified significant reductions to both fibre density and cross-section in the visual pathways of patients. These results indicate the pathological specificity of fibre density and cross-section measures in MS.
Introduction
Multiple sclerosis (MS) is the most common neurological disorder causing disability in young adults. It is characterised by the presence of inflammatory demyelinating lesions, which can lead to axonal degeneration. Treatments aiming to reduce or reverse axonal degeneration in MS require sensitive and specific markers.
Fixel-based analysis is such a method that can potentially provide sensitive and specific markers of axonal degeneration in MS. The advantage of fixel-based analysis lies in its ability to detect changes for each fibre element in a voxel (termed ‘fixel’), and its ability to detect white matter changes that manifest as differences in fibre density and macroscopic fibre bundle morphology1, 2. This is achieved by generating fibre orientation distributions (FODs) with spherical deconvolution techniques at each voxel3. Since the FOD’s amplitude is proportional to the intra-axonal diffusion signal at high diffusion weighting, a fixel-specific measure of fibre density (FD) can be derived. For each fixel, fibre cross-section (FC) is calculated from the deformable registration of the subject's FODs to the template1, 2.
Here we performed fixel-based analysis on a cohort of MS patients with a history of optic neuritis. We hypothesised a reduction in FD, FC, and a combined measure of fibre density and cross-section (FDC) within the visual pathways of patients compared to heathy controls.
Methods
Diffusion weighted scans were acquired for 17 patients with historical optic neuritis (disease duration: 4.48 ± 0.61 years) and 14 healthy controls (voxel size = 2.5x2.5x2.5mm3, b=3000s/mm2, 7 non-diffusion and 60 directions encoded scans).
For fixel-specific measures, a population-average FOD template was generated from subject specific FOD images obtained by single-shell 3-tissue constrained spherical deconvolution (SS3T-CSD), a novel method that accounts for non-white matter tissues4, 5. Each subject’s FOD image was then registered to the template, allowing for whole-brain fixel-based comparison between patients and controls. Measures of FD, FC, and FDC were generated2. Fixel-specific differences in FD, FC, and FDC measures were identified with connectivity-based fixel enhancement between MS and healthy controls (5000 permutations)6. All results were family wise error (FWER) corrected for multiple comparisons. All pre-processing steps, statistical analyses and visualisations were conducted with MRtrix3 (www.mrtrix.org).
Results
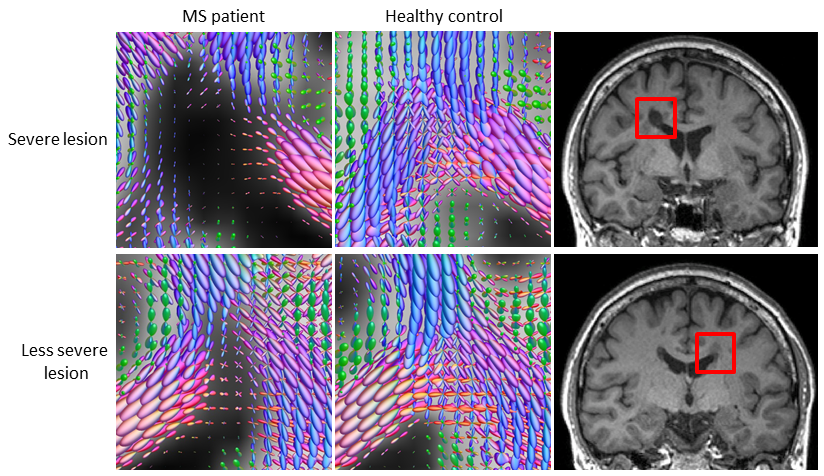
Qualitative visual assessment of the FODs within MS lesions revealed differences in the degree of axonal damage (as reflected in reduction of the FOD amplitude) between severe and less severe T1 hypointense lesions (Fig 1).
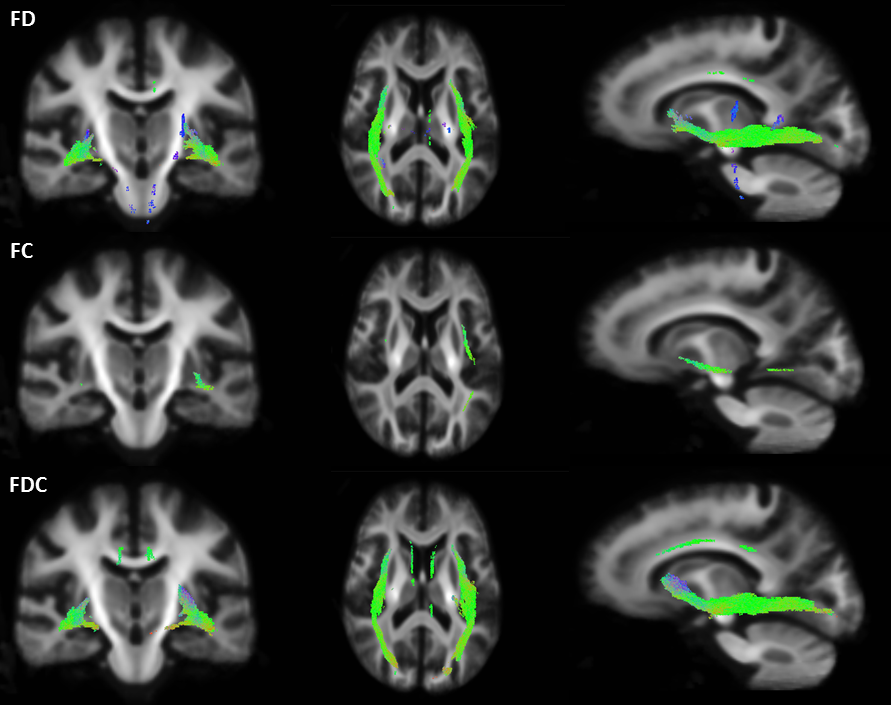
Statistical comparisons of fixel-specific measures (FD, FC, and FDC) between groups were performed at each fixel. Fig 2 shows significant reductions in FD, FC and FDC in MS patients compared to controls, largely in the inferior fronto-occipital fasciculus (FWER corrected p< 0.05). Note that far more extensive significant reductions are seen in FD than in FC, suggesting also that the observed FDC changes largely reflect differences in FD.
Discussion
In this study we have used a novel approach, fixel-based analysis to identify alterations in white matter micro- and macrostructure in MS patients with a history of optic neuritis. Significant reductions in FD, FC and FDC were observed within the visual pathway, potentially reflecting axonal degeneration. Differences in the magnitude of change in FD compared to FC at this early stage of the disease suggest that the change in axonal density and morphology do not occur concurrently, and a combined measure should be considered when measuring total axonal loss.
Conclusion
This study demonstrated the advantage of fixel-based analysis in detecting white matter changes that manifests as differences in fibre density and macroscopic fibre bundle morphology. We propose that these fixel-specific measures of axonal degeneration could be used in early therapeutic trials and to monitor disease progression.Acknowledgements
This research is supported by National Health and Medical Research Council APP1009757
S Gajamange is supported by a Multiple Sclerosis Research Australia Postgraduate Scholarship
S Kolbe is supported by a Peter Doherty National Health and Medical Research Council Fellowship APP1054147
References
1. Raffelt D, Tournier JD, Rose S, Ridgway GR, Henderson R, Crozier S, Salvado O, and Connelly A, Apparent Fibre Density: A novel measure for the analysis of diffusion-weighted magnetic resonance images. NeuroImage, 2012; 59(4):3976-3994.
2. Raffelt DA, Tournier JD, Smith RE, Vaughan DN, Jackson G, Ridgway GR, and Connelly A Investigating white matter fibre density and morphology using fixel-based analysis. Neuroimage, 2016. DOI: http://dx.doi.org/10.1016/j.neuroimage.2016.09.029.
3. Tournier JD, Calamante F, and Connelly A, Robust determination of the fibre orientation distribution in diffusion MRI: Non-negativity constrained super-resolved spherical deconvolution. NeuroImage, 2007; 35(4):1459-1472.
4. Dhollander T and Connelly A. A novel iterative approach to reap the benefits of multi-tissue CSD from just single-shell (+b=0) diffusion MRI data. Proc ISMRM 2016; 24:3010.
5. Dhollander T, Raffelt D, and Connelly A. Unsupervised 3-tissue response function estimation from single-shell or multi-shell diffusion MR data without a co-registered T1 image. Proc ISMRM Workshop on Breaking the Barriers of Diffusion MRI 2016:5.
6. Raffelt DA, Smith RE, Ridgway GR, Tournier JD, Vaughan DN, Rose S, Henderson R, and Connelly A, Connectivity-based fixel enhancement: Whole-brain statistical analysis of diffusion MRI measures in the presence of crossing fibres. Neuroimage, 2015; 117:40-55.
Figures