2539
Z-Score Approach to the Detection of Cortical Lesions in Multiple Sclerosis1Department of Radiology, University of Vermont, Burlington, VT, United States, 2Department of Neurological Sciences, University of Vermont, Burlington, VT, United States
Synopsis
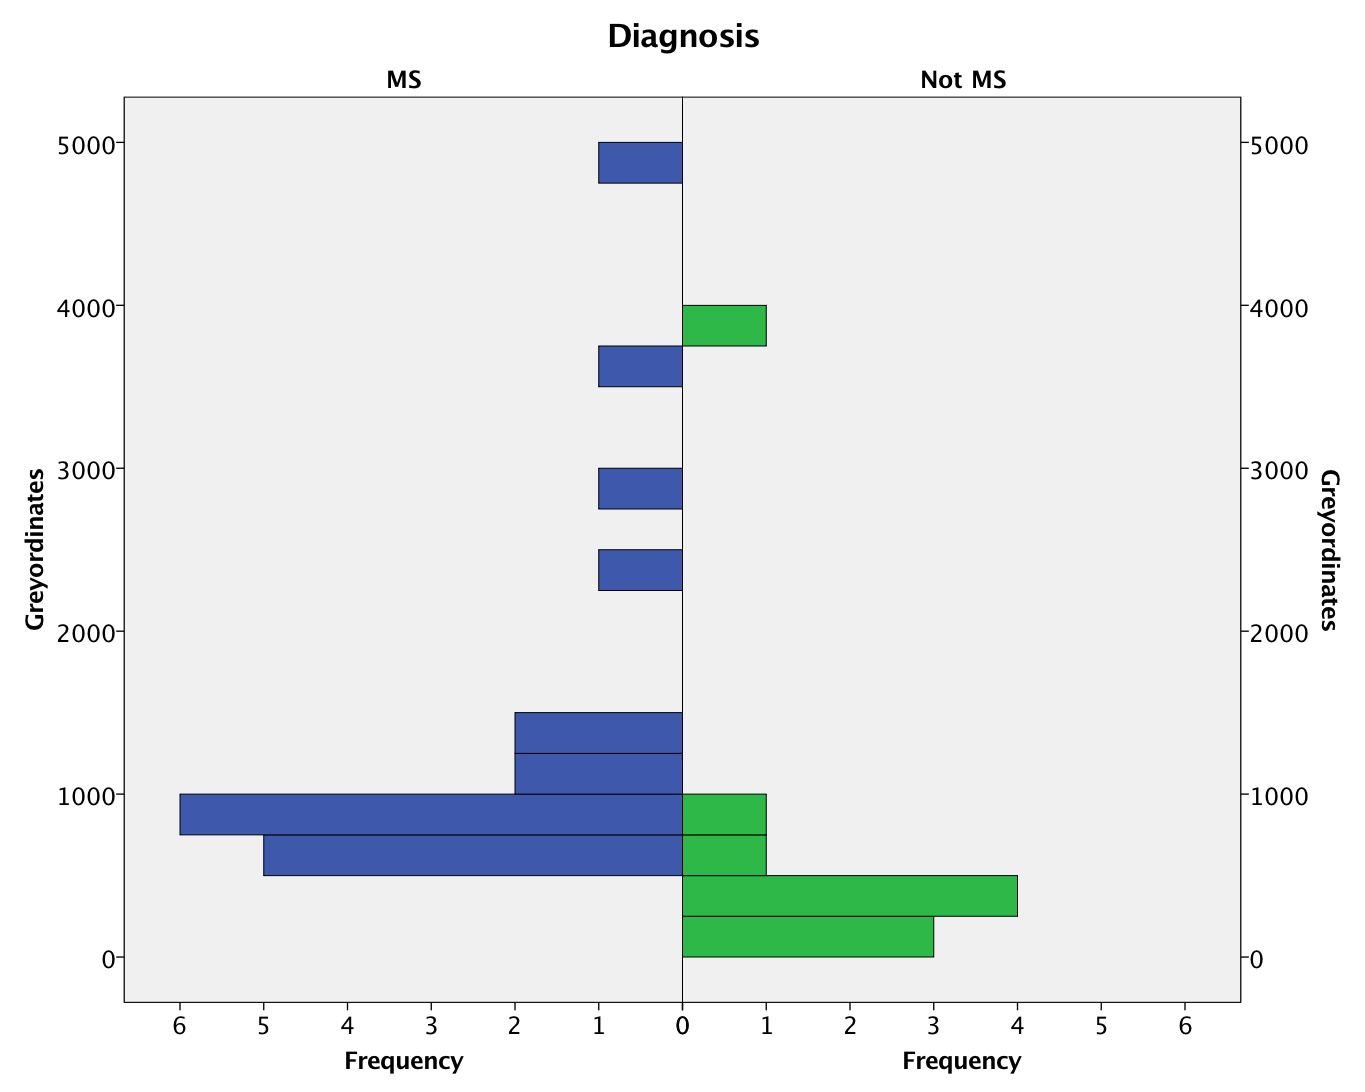
A new technique combining surface-based cortical myelin maps with Z-score methodology is developed to identify foci of cortical demyelination in patients with multiple sclerosis. The technique is found to discriminate (p=0.002) patients with MS (n=19) from patients with migraine (n=10), who often present with similar symptoms and white matter imaging findings. Regions of unusually low myelin content may correspond to lesions visible on the source T1-weighted and FLAIR images, but in other cases may be occult on either individual scan. The technique is clinically applicable, requiring only 3D T1 and FLAIR acquisitions that are already the standard of care in clinical neuroimaging.
Purpose
To combine recently developed cortical myelin mapping techniques(1) with a Z-score approach(2) to improve the sensitivity of 3T MRI for the detection of cortical lesions associated with multiple sclerosis (MS). Cortical lesions are known to occur frequently in MS, and are more strongly associated with disability than white matter lesions(3), yet many are not visible on conventional imaging(4). The development of techniques with increased sensitivity to cortical lesions would be useful to monitor disease progression and for the evaluation of therapeutic impacts on MS.Methods
Data was acquired from 20 patients with MS and a control group of 10 patients with migraine. 3D T1-weighted (0.8mm isotropic resolution) and FLAIR (1.0mm isotropic resolution) images were acquired using a Philips Achieva dStream MRI scanner with a 32-channel head coil. Cortical myelin maps were generated using the Human Connectome Project pipelines(5) (version 3.16.1). Each myelin map was converted to a Z-score based on the mean and standard deviation of all subjects except that individual (leave-one-out approach). Regions of unusually low cortical myelin content were defined based on a threshold Z<-3. The total number of cortical grayordinates beyond this threshold was used as a measure of disease burden. Differences between the MS and control groups were assessed using a nonparametric Mann-Whitney U-test (SPSS v24).Results
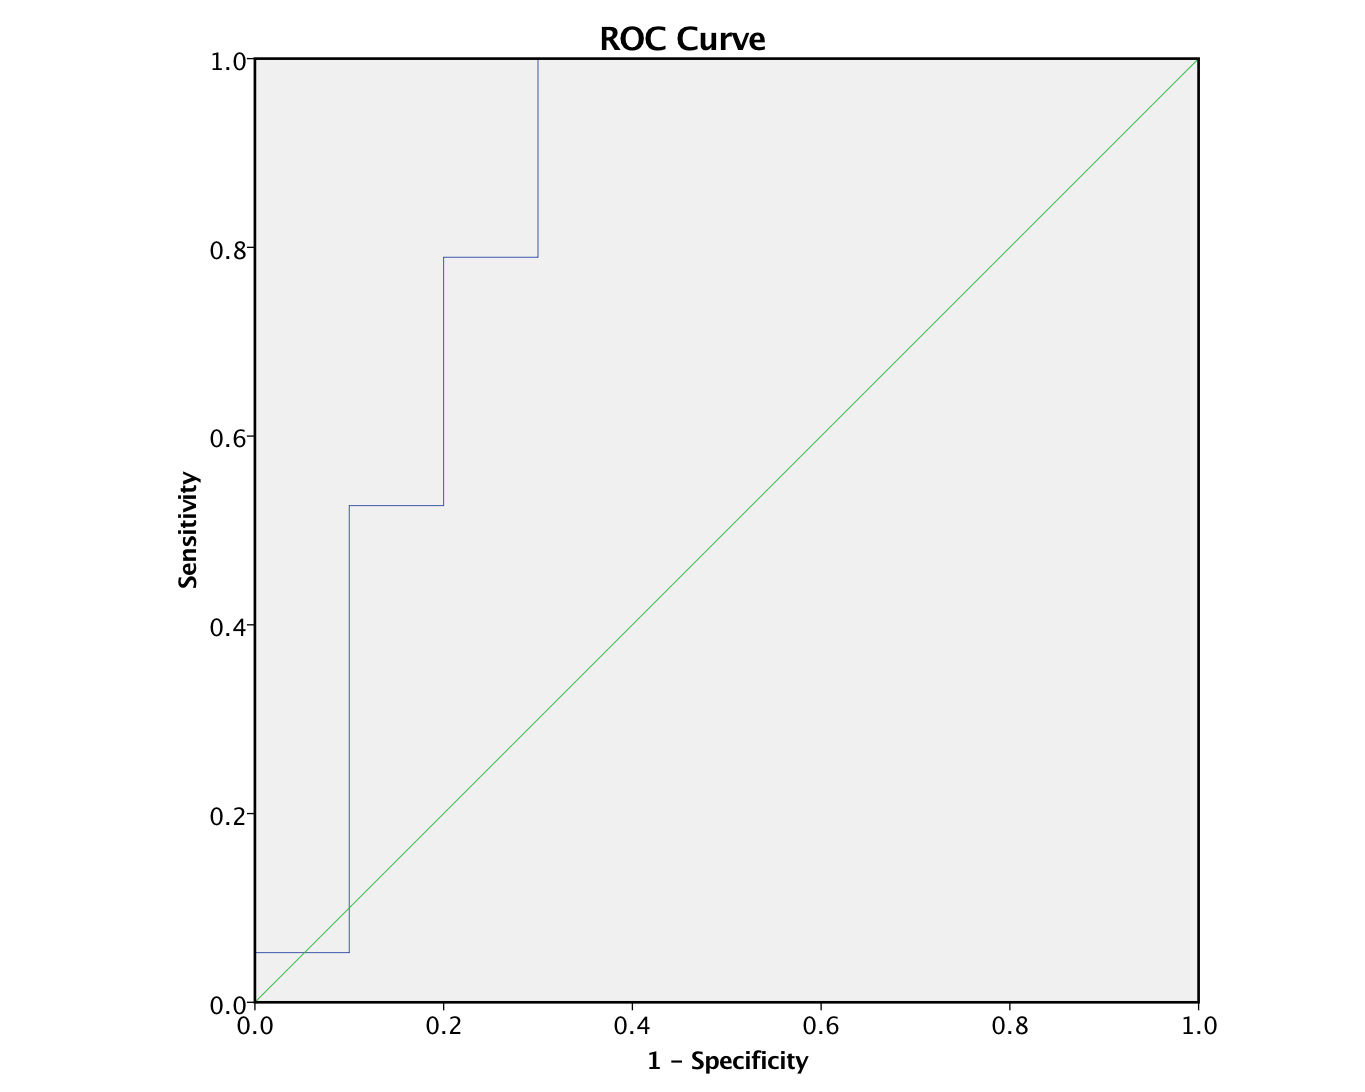
Quality control based on inspection of both the raw volumetic data, cortical segmentation, and myelin maps resulted in a single MS patient being excluded from the subsequent analysis. MS patients demonstrated a significantly larger number of regions of decreased cortical myelin compared to the control group (p=0.002, Figure 1). ROC analysis resulted in an AUC of 0.837, and both a sensitivity and specificity of 0.8 (Figure 2).Discussion
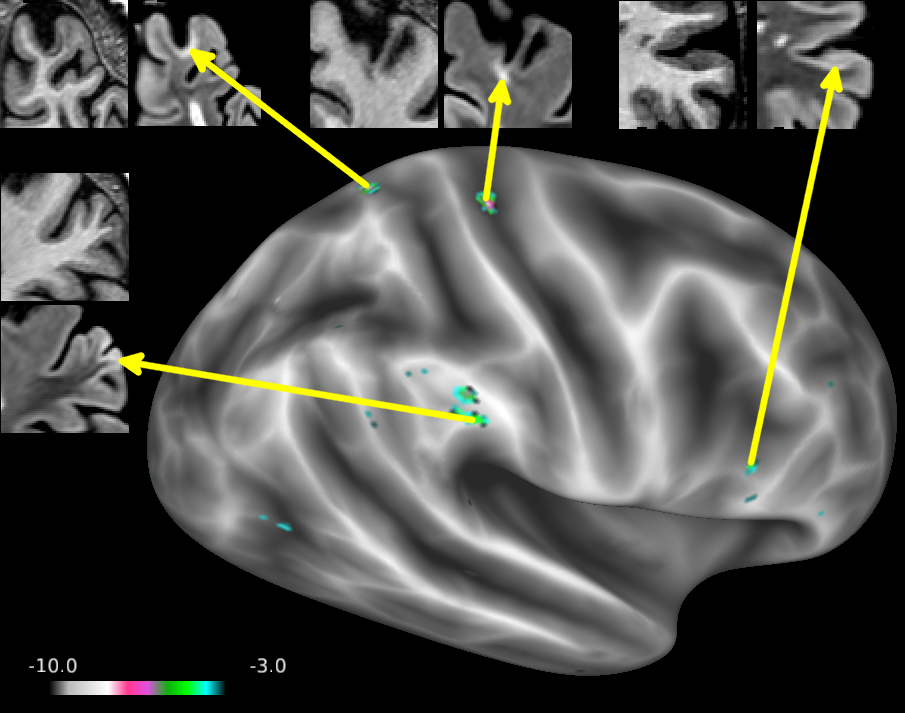
Some of the lesions identified using the Z-score approach could be prospectively identified on the source images, while others were more subtle (Figure 3). Many lesions were not identifiable on the source images, even in retrospect. Without a gold standard for comparison, it is unclear whether such lesions represent false positives, or result from increased sensitivity due to the grayordinate-wise comparison to the reference population. Future studies will use double inversion recovery (DIR) acquisitions, albeit with lower SNR, to compare these lesions. The use of high resolution high field MRI(3) or pathology may also provide a suitable reference. The use of a leave-one-out approach is not ideal in that the reference population includes MS patients with known cortical lesions, which would be expected to increase the standard deviation in the reference group. Patients with migraine were chosen as the control group because they share many of the same clinical symptoms and radiographic findings as may be seen in demyelinating disease, although the pathophysiology is likely to be different. The use of a larger, independent healthy control population to define “normal” would be preferable, and would lead to greater sensitivity. However, with the small number of subjects in this study, the leave-one-out approach avoids the potential for introducing bias between the groups, which has been a problem in previous studies(6).Conclusions
3D volumetric T1-weighted and FLAIR techniques are commonly used in clinical practice. The techniques presented do not require additional data acquisition, and provide a novel automated way to identify cortical lesions which may have higher sensitivity than an expert reader. Future studies will use a large database of diverse clinical cases to determine its performance in a real-world clinical environment.Acknowledgements
The authors are grateful to Jay Gonyea and Scott Hipko for their help with this study.References
1. Glasser MF, Van Essen DC. Mapping human cortical areas in vivo based on myelin content as revealed by T1- and T2-weighted MRI. The Journal of neuroscience : the official journal of the Society for Neuroscience 2011;31(32):11597-11616.
2. White T, Schmidt M, Karatekin C. White matter 'potholes' in early-onset schizophrenia: a new approach to evaluate white matter microstructure using diffusion tensor imaging. Psychiatry research 2009;174(2):110-115.
3. Harrison DM, Roy S, Oh J, et al. Association of Cortical Lesion Burden on 7-T Magnetic Resonance Imaging With Cognition and Disability in Multiple Sclerosis. JAMA neurology 2015;72(9):1004-1012.
4. Seewann A, Vrenken H, Kooi EJ, et al. Imaging the tip of the iceberg: visualization of cortical lesions in multiple sclerosis. Multiple sclerosis 2011;17(10):1202-1210.
5. Glasser MF, Sotiropoulos SN, Wilson JA, et al. The minimal preprocessing pipelines for the Human Connectome Project. NeuroImage 2013;80:105-124.
6. Watts R, Thomas A, Filippi CG, Nickerson JP, Freeman K. Potholes and molehills: bias in the diagnostic performance of diffusion-tensor imaging in concussion. Radiology 2014;272(1):217-223.
Figures