2538
Investigation on Optic Neuritis with DTI and Understanding Its Underlying Pathology using Monte Carlo Simulation.1Utah Center for Advanced Imaging Research, University of Utah, Salt Lake City, UT, United States, 2Department of Neurology, University of Utah, 3Department of Radiology and Imaging Sciences, University of Utah, Salt Lake City, UT, United States
Synopsis
To understand the underlying physical and pathological meaning of optic-nerve in optic-neuritis(ON), diffusion-tensor imaging (DTI) and the corresponding Monte-Carlo Simulation (MCS) were conducted. DTI studies of four healthy subjects and seven ON patients with MS were performed and analyzed by home-built software. The measured DTI indices allowed us to monitor pathological changes such as inflammation in ON or demyelination. To investigate the clinical meanings of changes in diffusion parameters, MCS of water diffusion in optic nerve was performed.
Introduction
The purpose of this study is to understand the underlying physical environment in optic-nerve in optic-neuritis(ON) by using diffusion-tensor imaging (DTI) and the corresponding Monte-Carlo Simulation (MCS). ON is one of the presenting sites of Multiple Sclerosis (MS) relapse and exhibits similar pathological alteration on MS lesion [1,2] . While conventional MRI may detect optic nerve atrophy and dilation of the nerve sheath, DTI indices such as radial diffusivities (RD), axial diffusivities (AD), and fractional anisotropy (FA) allows for assessment of underlying pathology prior to structural damage. We developed a custom-made software which can be able to select precise region of interest(ROI) in such a small size of optic nerve and calculated DTI indices of healthy and ON optic nerve. To understand the clinical meanings of changes in diffusion parameters, MCS of water diffusion in optic nerve was performed. The measured DTI indices allowed us to monitor pathological changes such as inflammation in ON or demyelination.Methods
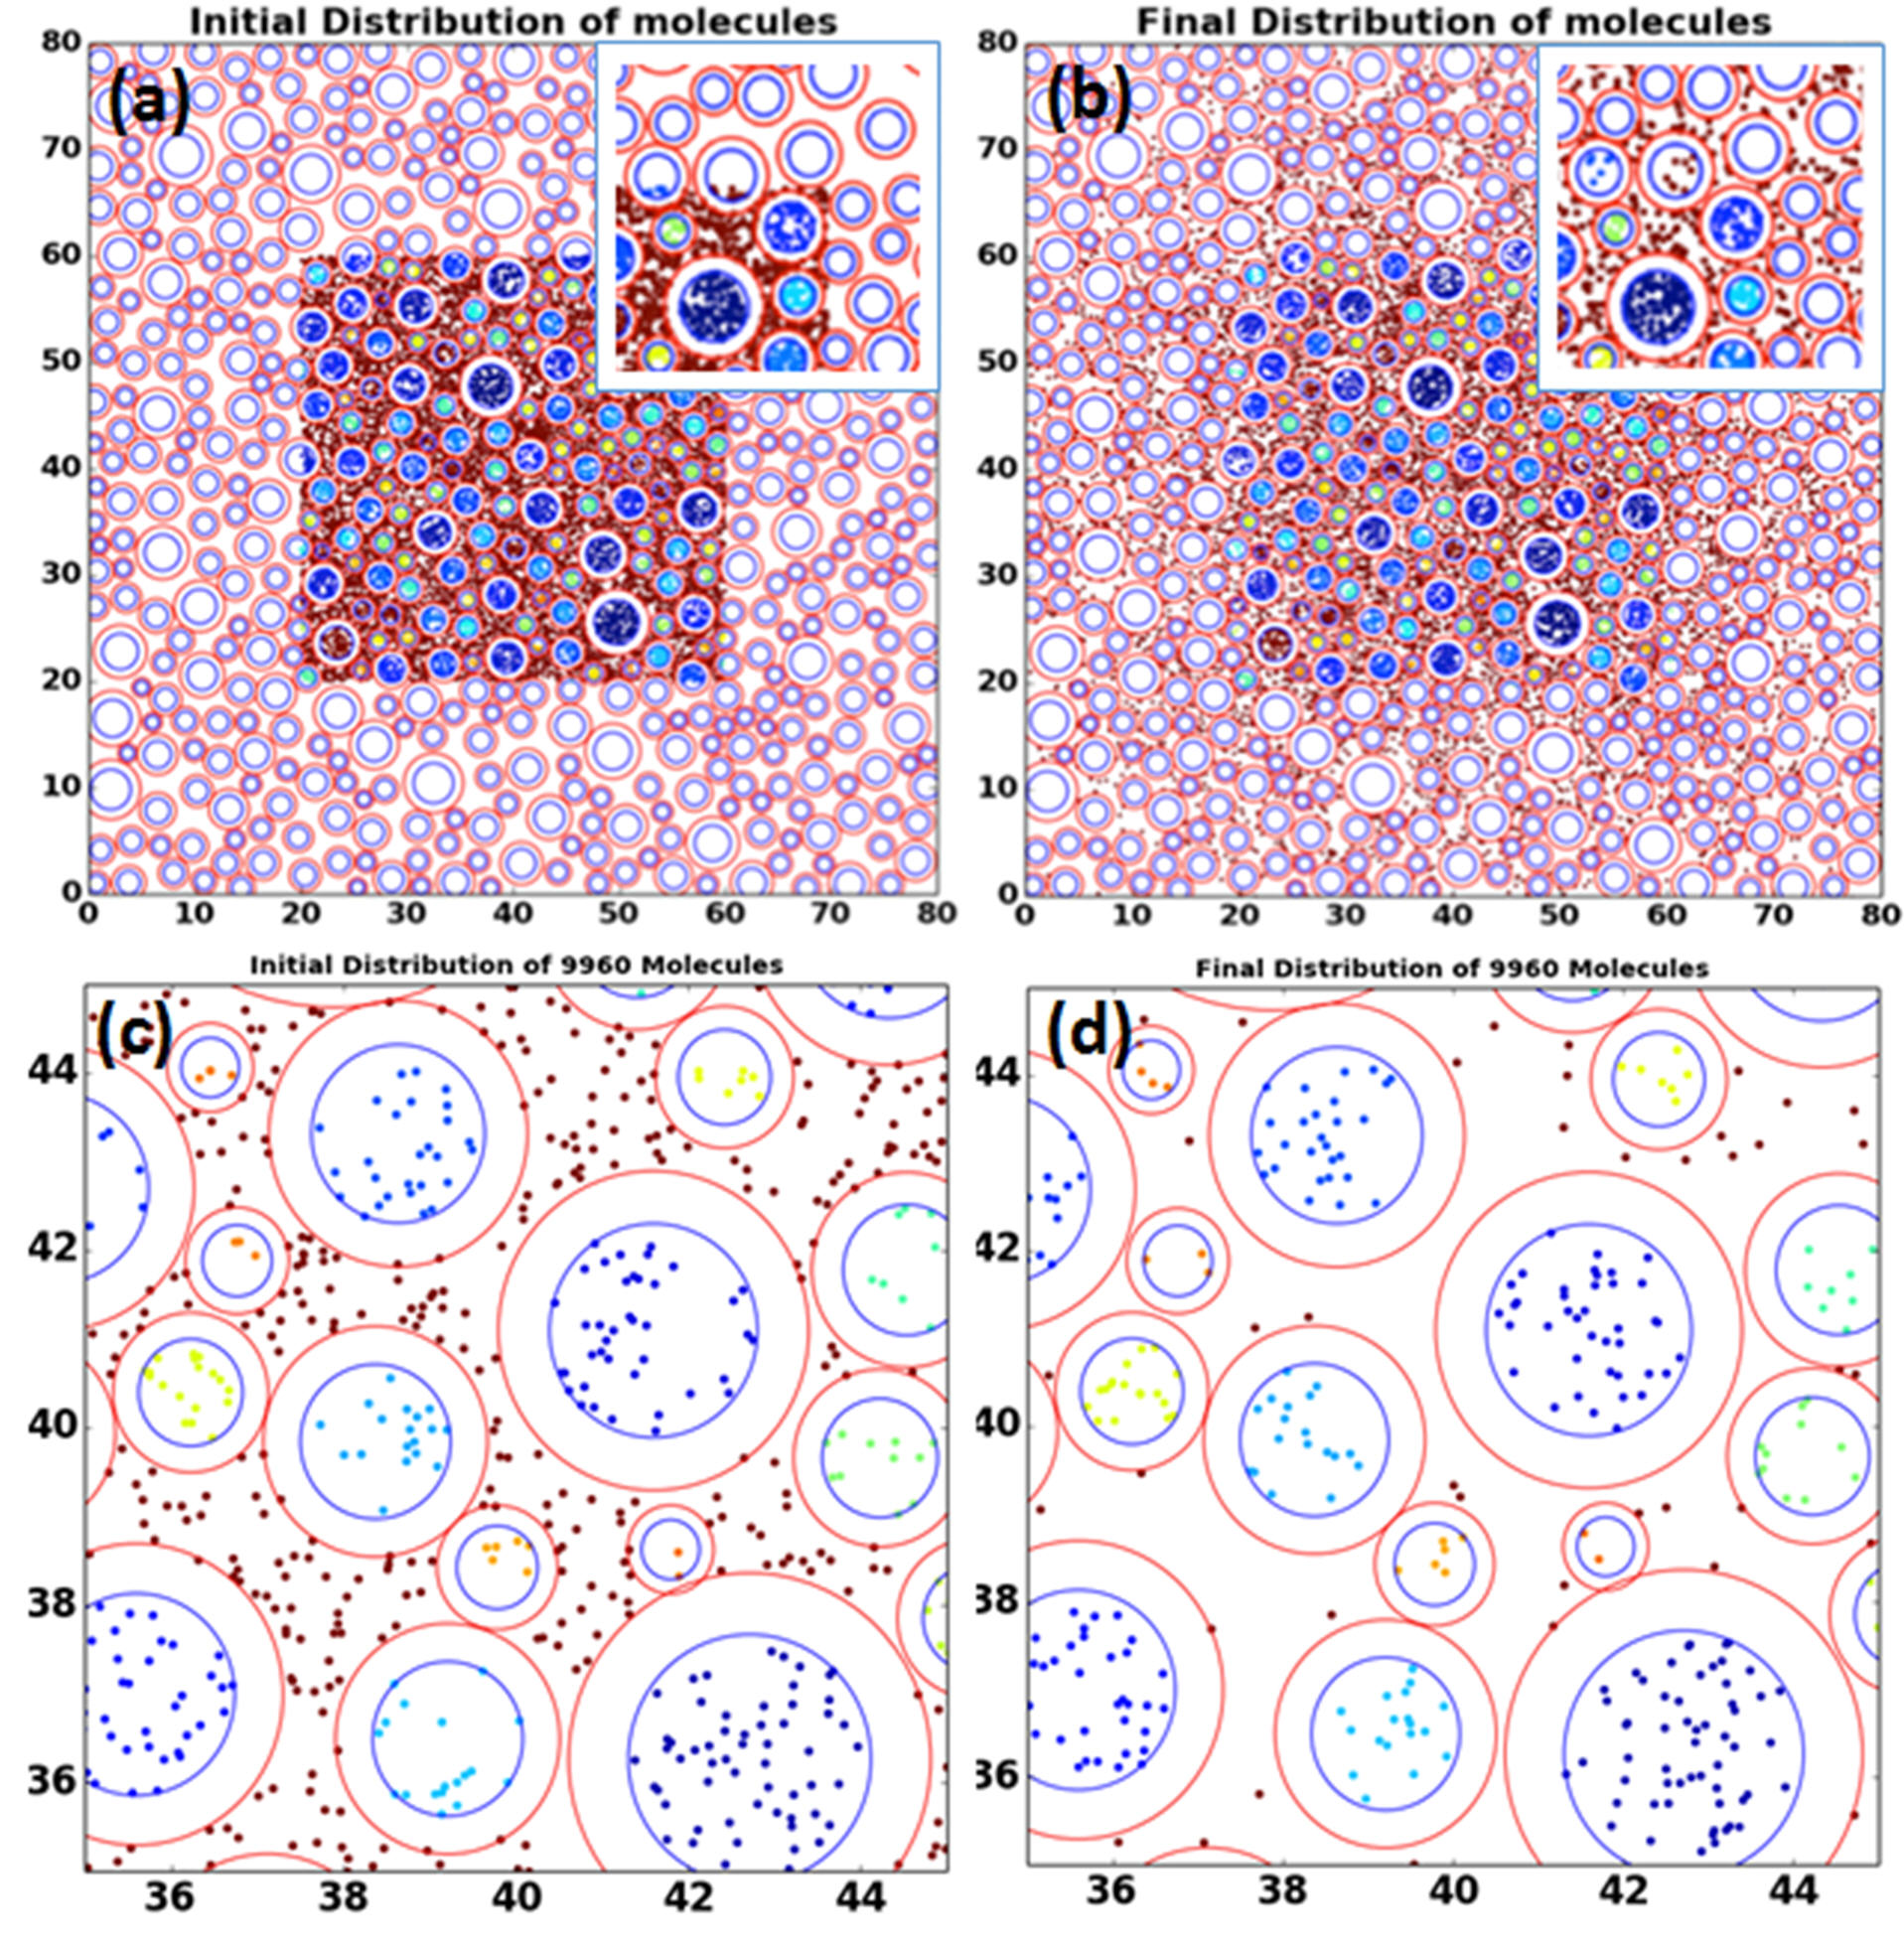
DTI studies of four healthy subjects and seven ON patients with MS were performed on a 3T MRI system (Trio, Siemens Medical Solution, Erlangen, Germany), using a homebuilt 20-element phased-array coil 4. DTI data was acquired with 2D ss-IMIV-DWEPI [3] by using the following imaging parameters; acquisition matrix=160x52, 2 mm slice thickness, TE/TR=76 ms/3s, ETL=40, b=10 and 500 sec/mm2, 12 non-collinear diffusion directions. T2W images on the same slice were acquired with 2D TSE and imaging parameters were TE/TR= 115/3000ms, and ETL=15. DTI were processed using custom-made software written in Python using dipy package[4] . A single ROI was carefully selected on FA-weighted color map per each optic nerve and DTI indices were calculated. Water diffusivities on healthy and chronically damaged optic nerve were simulated by MCS previously developed for spinal cord white matter [5] . For MCS, Different 2D geometries of cross section on optic nerve representing healthy nerve and ON were created with axon diameters followed by gamma distribution[6] . We generated seven different geometries with different number of axons in given cross-sectional area. Simulation depicted random water diffusion in the given geometry including intra-and extra-axonal space.Results
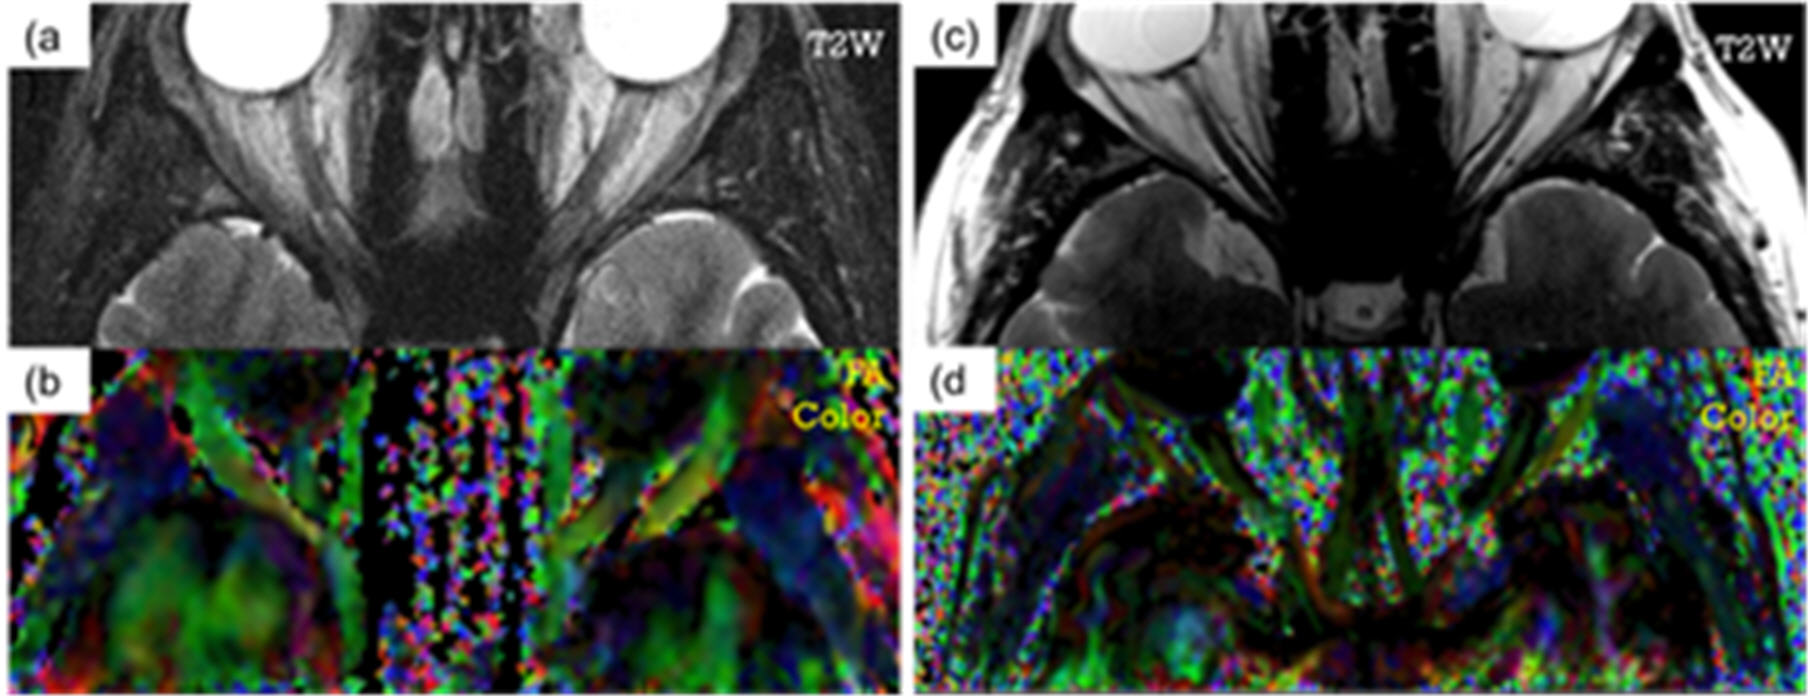
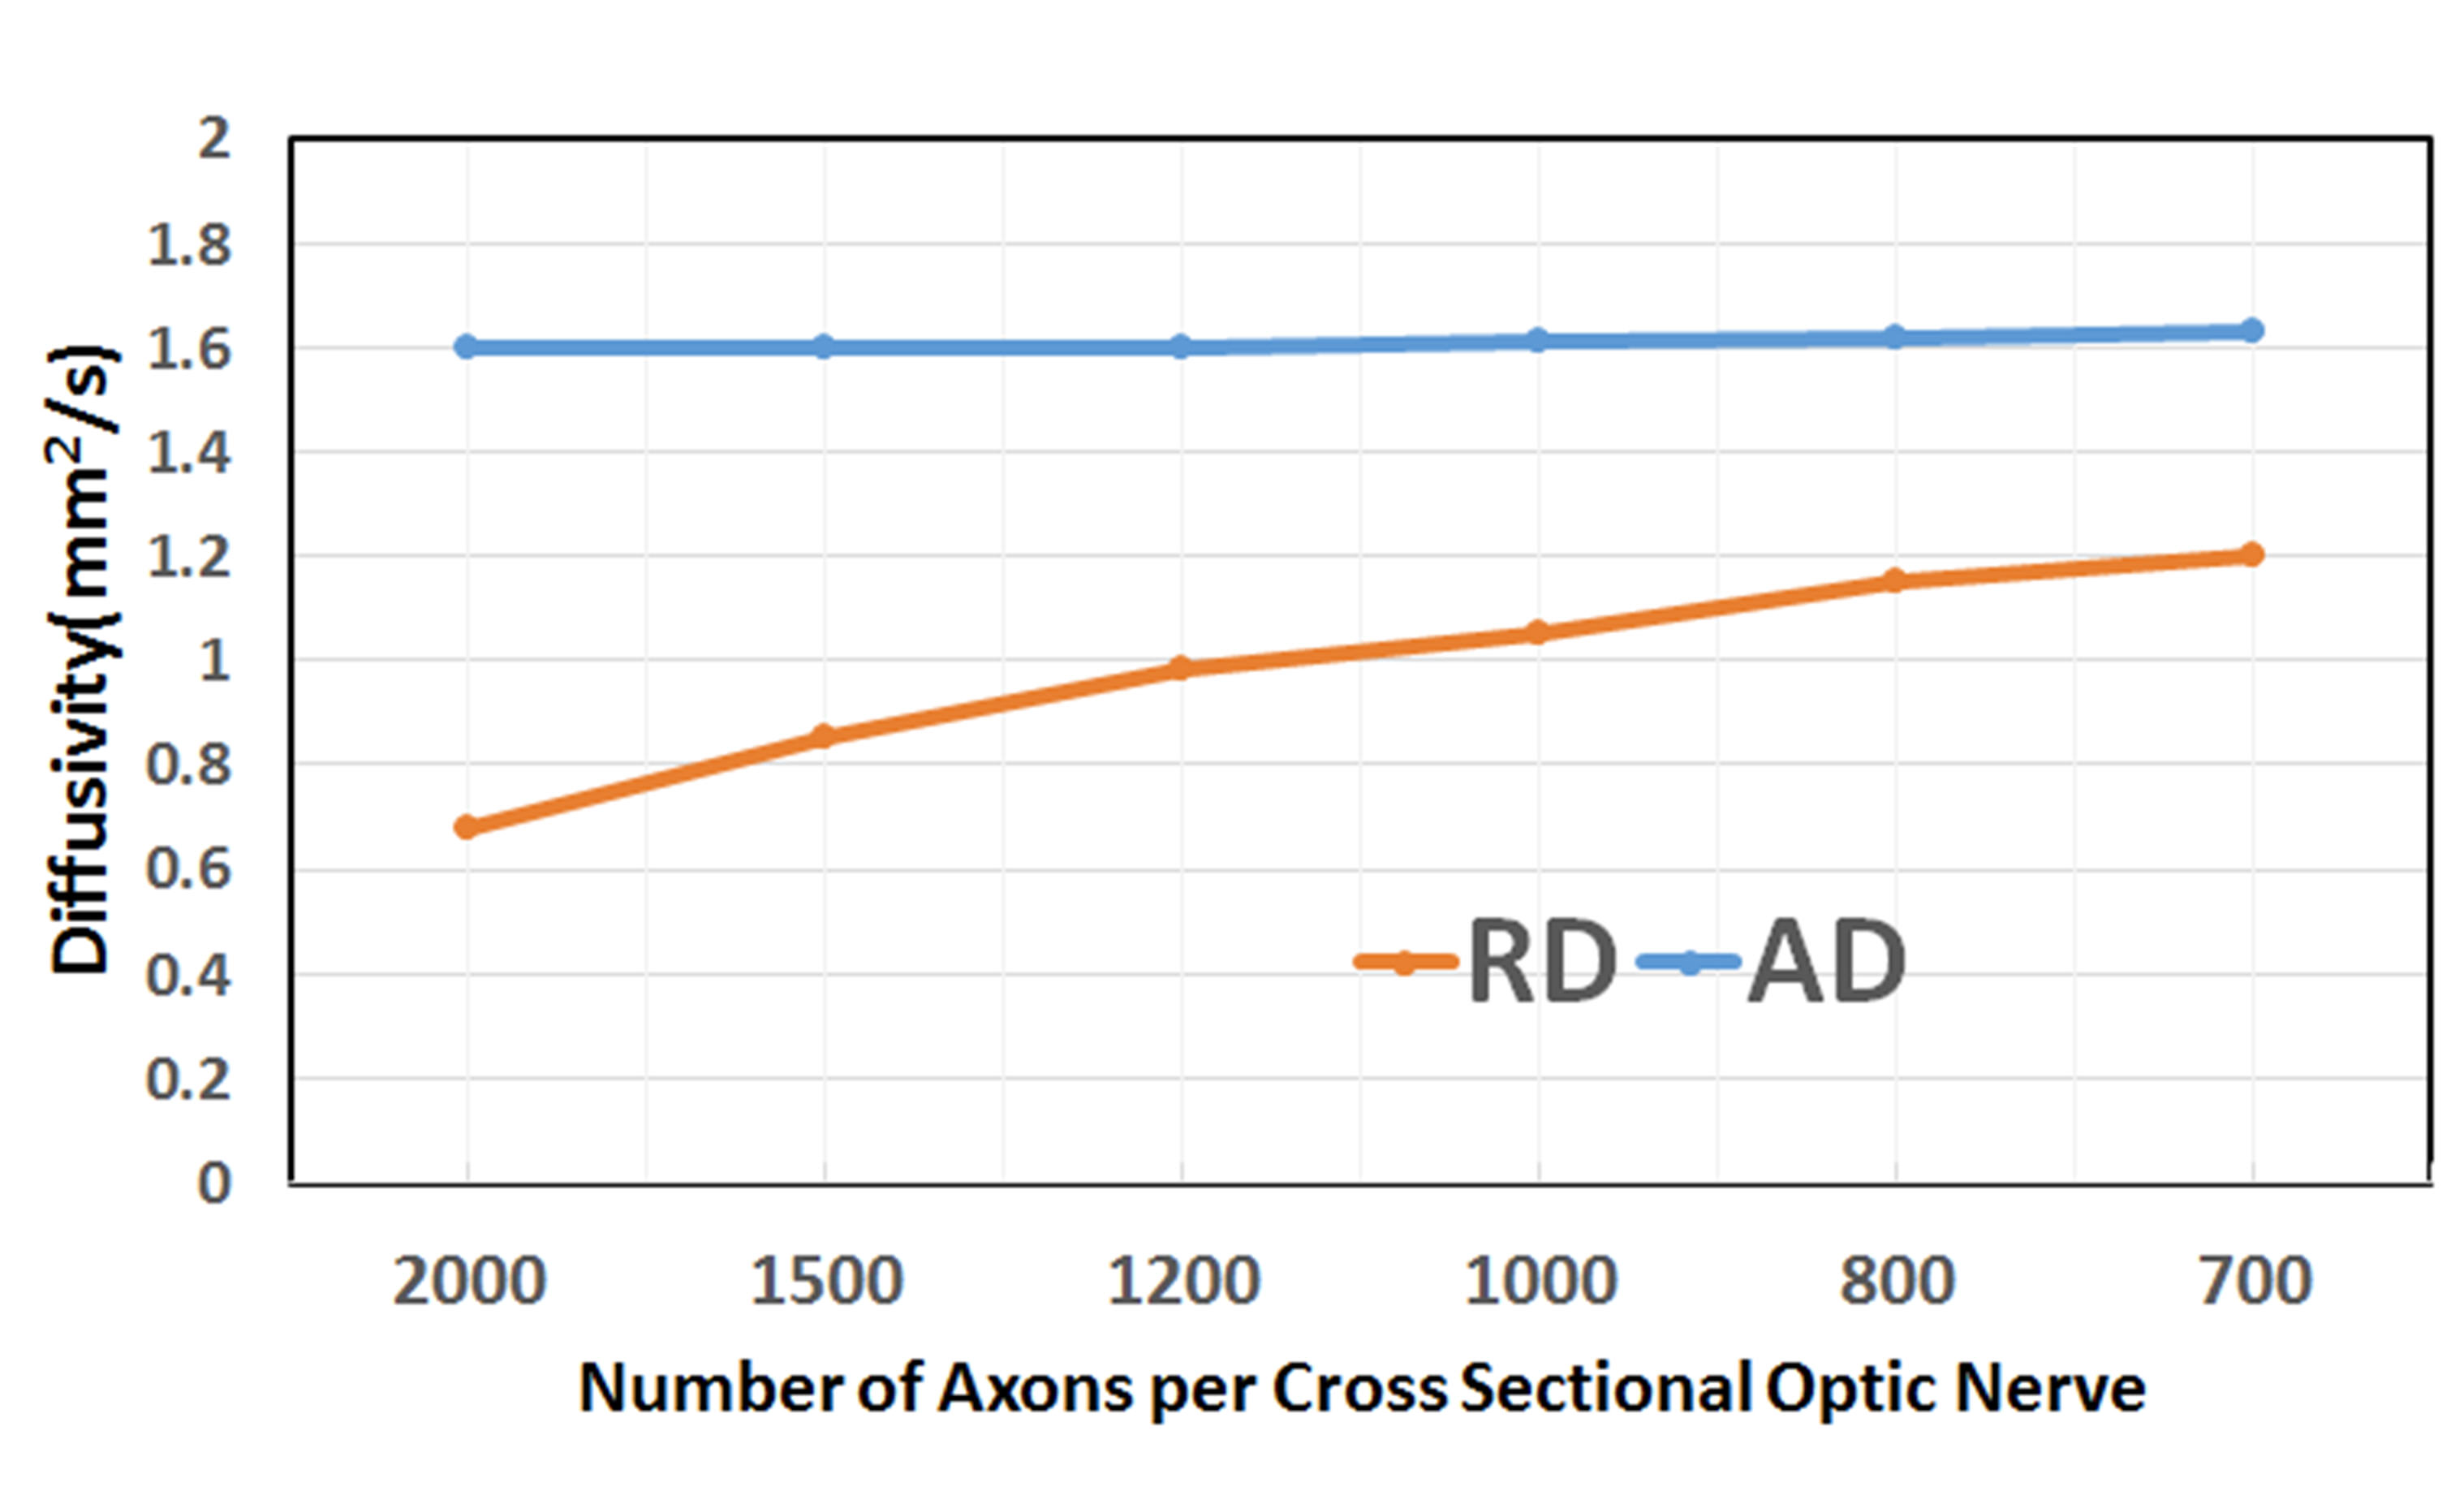
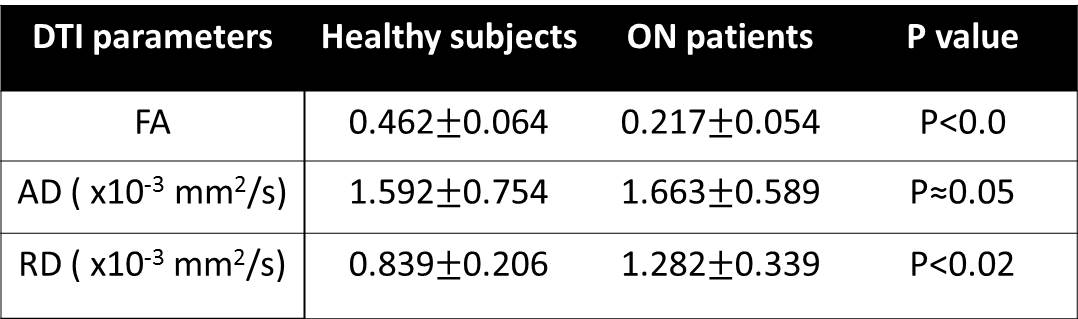
Quantitative DTI indices are summarized on table 1. There was no statistical difference in mean AD among two groups. Mean RD of normal nerves (0.839±0.206 x10⁻³ mm2 /sec) was significantly lower than mean of ON (1.28±0.33 x10⁻³ mm2 /sec) with p value under 0.01. Mean FA of healthy nerve was higher than FA of ON (0.462±0.064 vs 0.217±0.05, respectively). Figure.1 shows T2WI and FA color map created from our software for healthy (a,b) and ON (c,d)optic nerve. There were no distinctive pathological findings. Figure.2 shows the synthesized geometry of cross section on optic nerve for MCS. Figure 3 summarized the simulated diffusivities on optic nerve. We compared diffusivities on seven different cases depending on number of axons. Our MSC demonstrated an increasing tendency in the radial diffusivity as the axon density decreases.Discussion
We assumed that the chronic optic neuritis may accompany inflammation which causes water inflow in extra-axonal space and there would be smaller number of axons in given area in the case of optic neuritis than healthy case. The lower FA value on ON may indicate that the RD is increased due to increased extra-axonal space caused by inflow of water molecules as a result of inflammation. Our in vivo DTI measurements agrees well with simulation result (Figure 3), which illustrates increased RD as the axonal density decreases in the optic nerve. The change in the FA index in ON from the normal is mainly because of the increase in the RD due to the increased extra-axonal space. Optic neuritis may induce demyelination in the optic nerve, which introduces a water exchange between the intra- and extra-axonal spaces, of which rate depends on the degree of demyelination. Our previous study indicated that the increased demyelination leads to a further increase in the radial diffusivity[5] . Unlike there was no qualitative method we can detect on the image between patients and healthy group, we observed that quantitative measurement of FA, RD were varied from normal to patients which we can expect that quantitative DTI indices can be a potential biomarker of optic nerve pathology especially axonal disease.Conclusion
Measured DTI indices show significant difference in healthy and ON group which, we believed, is caused by the increased extra-axonal space due to the inflammation in ON. Our results of MCS provided insights for underlying pathology in optic nerve of MS patients with chronic ON.Acknowledgements
This work is supported by Cumming Foundation Grant, VA Merit Review Grant, NMSS Research Grant (RG 5233-A-2).References
[1]. Simon JH, McDonald WI. Assessment of optic nerve damage in multiple sclerosis using magnetic resonance imaging. J Neurol Sci 2000;172 Suppl 1:S23-26.
[2]. Hickman SJ, Brex PA, Brierley CM, et al. Detection of optic nerve atrophy following a single episode of unilateral optic neuritis by MRI using a fat-saturated short-echo fast FLAIR sequence. Neuroradiology 2001;43(2):123-128.
[3]. Jeong EK, Kim SE, Guo J, Kholmovski EG, Parker DL. High-resolution DTI with 2D interleaved multislice reduced FOV single-shot diffusion-weighted EPI (2D ss-rFOV-DWEPI). Magn Reson Med. 2005;54(6):1575-9.
[4]. Garyfallidis E, Brett M, Amirbekian B, Rokem A, van der Walt S, Descoteaux M, Nimmo-Smith I and Dipy Contributors (2014). Dipy, a library for the analysis of diffusion MRI data. Frontiers in Neuroinformatics, vol.8, no.8.
[5]. Nabraj Sapkota et al., Characterization of spinal cord white matter by suppressing signal from hindered space. A Monte Carlo simulation and an ex vivo ultrahigh-b diffusion-weighted imaging study, JMR 272 (2016):53-56.
[6]. E.O. Stejskal, J.E. Tanner, Spin diffusion measurements: spin echoes in the presence of a time-dependent field gradient, J. Chem. Phys. 42 (1965) 288.
Figures