2536
Changes in White Matter Integrity in MS under Fingolimod Treatment for Two Years Revealed by HARDI1Radiology, Cleveland Clinic, Cleveland, OH, United States, 2Neurology, Cleveland Clinic, Cleveland, OH, United States
Synopsis
In a 2 year longitudinal fingolimod study, we investigated the evolution of white matter integrity in the brain of relapsing-remitting multiple sclerosis (RRMS) patients under fingolimod treatment. Based on dMRI metrics from HARDI scans and statistical analysis, we found that MS patients experience a continued decline in white matter integrity during the first year of treatment with fingolimod with stabilization during the second year. Without a control group, it is unclear if these trends reflect on the impact of a treatment on disease progression.
PURPOSE
To investigate white matter
integrity in the brain of relapsing-remitting
multiple sclerosis (RRMS) patients under fingolimod treatment with diffusion
MRI (dMRI) metrics longitudinally. Fingolimod is an oral therapy for RRMS, but
disease progression may occur despite effective control of inflammation1.
dMRI provides quantitative measures of tissue integrity in Normal Appearing White Matter (NAWM) and may also
provide useful predictive biomarkers of injury that do not manifest on a
routine exam. In a 2 year longitudinal study of fingolimod-treated MS patients,
we used dMRI with high angular resolution diffusion imaging (HARDI) to detect evolution
of white matter injury, focusing on corticospinal tracts (CST) in brain. Our
results suggest elevated injury in NAWM over the first year after initiation of
treatment with stable white matter integrity over the second year.
METHODS
Fifteen RRMS patients were
scanned under an IRB-approved protocol on a 3 tesla MRI—either TIM-Trio with a
12-channel head coil or a Prisma with a 16-channal head coil (Siemens AG,
Erlangen, Germany). Whole brain dMRI, resting state fMRI (rs-fMRI) and
anatomical T1W images of each subject were acquired prior to initiating
fingolimod treatment and at 6, 12, 18 and 24 months after initiating fingolimod
treatment. dMRI was acquired using a HARDI protocol (2mm isotropic, 71
diffusion-weighting gradients with b=1000sec/mm2 and 8 b=0 volumes).
The diffusion tensor images were calculated after motion correction, taking
into account systematic differences between the Trio and Prisma in terms of
noise floor2. The left and right CST were mapped in each subject
with probabilistic tractography3, between ROIs placed in M1 (hand
knob) and cerebral peduncle, resulting in a track density map. The M1 ROI
was defined based upon maximum correlation between the left & right hand
knobs4 using afni InstaCorr5 on rs-fMRI after physiologic
noise and motion correction, and the cerebral peduncle ROI was drawn manually
on the color FA map. Metrics of tissue integrity (TD, LD, FA and MD) from dMRI
were averaged over the track density map on white matter of the whole brain.
RANOVA in matlab (http://www.mathworks.com) was performed on mean values of TD,
LD, FA and MD at all time points for the both sides of CST. In addition,
Tukey-Kramer tests were performed to determine which pairs of time points
differ.
RESULTS
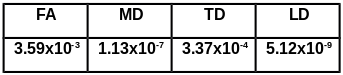
RANOVA analysis based on the data from all
time points revealed significant differences in TD, MD, FA and LD over 2 years
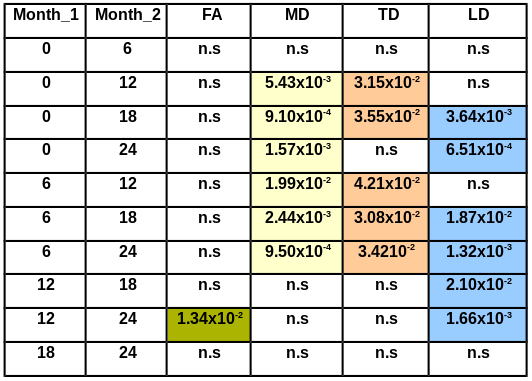
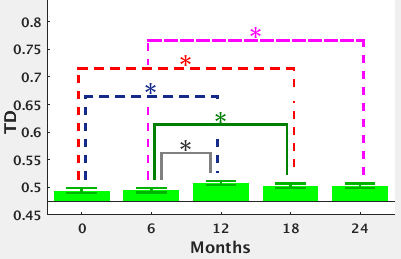
(p<0.0004, table 1). TD was significantly higher at month 12 and 18 than at
baseline (p<0.036) and at months 12, 18 and 24 as compared to month 6
(p<0.043) (figure 1, table 2), with no significant changes in TD seen during first 6 months or during the last
12 months of treatment. No significant changes in FA, LD and MD were seen
during the first 6 months and the last 6 months of treatment. FA was significantly higher at month 24 than at month12
(p<0.014, table 2). MD was significantly higher at month 12, 18 and 24 than
at baseline (p<0.006) and at month 6 (p<0.02, table 2). LD was
significantly higher at month 18 and 24 than at base line (p<0.004), at month
6 (p<0.019) and at month12 (p<0.021)
(table 2) separately.
DISCUSSION
The
results suggest that MS patients experience a continued decline in white matter
integrity during the first year of treatment with fingolimod with stabilization
during the second year. Without a control group, it is unclear if these trends
reflect on the impact of a treatment on disease progression. However, the
results suggest that dMRI is sensitive to the evolution of tissue
microstructure over time after treatment. Further study may determine if such
measurements indeed reflect disease progression.CONCLUSION
Acknowledgements
We gratefully acknowledge the support from Novartis and the contributions of Dr. Thorsten Feiweier, Siemens AG, Healthcare, for developing the advanced diffusion MRI pulse sequence used in this work.References
1. Kappos L (2010) ‘A Placebo-Controlled Trial of Oral Fingolimod in Relapsing Multiple Sclerosis’ N Engl J Med 2010; 362:387-401February 4, 2010DOI: 10.1056/NEJMoa0909494
2. Jones DK(2004) ‘Squashing peanuts and smashing pumpkins: how noise distorts diffusion-weighted MR data.’ Magn Reson Med. 2004 Nov;52(5):979-93.
3. Sakaie K. (2007) ‘An objective method for regularization of fiber orientation distributions derived from diffusion-weighted MRI’ Neuroimage. 2007 Jan 1;34(1):169-76. Epub 2006 Oct 9.
4. Lowe MJ ‘Resting state sensorimotor functional connectivity in multiple sclerosis inversely correlates with transcallosal motor pathway transverse diffusivity.’ Hum Brain Mapp. 2008 Jul;29(7):818-27. doi: 10.1002/hbm.20576.
5. Cox, RW, Hyde, JS ‘Software tools for analysis and visualization of fMRI data’ NMR Biomed, 10, 171-8, (1997).
Figures