2534
Distinct patterns of network-wise functional connectivity impairment discriminate Relapsing-Remitting Multiple Sclerosis with different disease duration1Electrical, Computer and Biomedical Engineering, University of Pavia, Pavia, Italy, 2Brain Connectivity Center, C. Mondino National Neurological Institute, Pavia, Italy, 3New Zealand Brain Research Institute, Christchurch, New Zealand, 4University of Otago, Christchurch, New Zealand, 5University of Canterbury, Christchurch, New Zealand, 6Department of Brain and Behavioral Sciences, University of Pavia, Pavia, Italy, 7Queen Square MS Centre Department of Neuroinflammation, UCL Institute of Neurology, London, United Kingdom, 8Department of Neurology, Christchurch Hospital, Christchurch, New Zealand, 9Brain MRI 3T Research Center, C. Mondino National Neurological Institute, Pavia, Italy
Synopsis
In this work we examined functional connectivity (FC) changes within and between the resting state networks (RSNs) caused by Relapsing Remitting Multiple Sclerosis (RRMS) in two cohorts showing mild disability but different disease duration. Our results demonstrate widespread functional alterations in both short and long duration RRMS groups (MS1 and MS2). The MS1 group showed more severe FC alterations compared to the MS2 group. Overall, these results suggest that there may be pathophysiological differences in RRMS groups with different disease durations. Longitudinal studies would be needed to investigate whether FC findings are able to predict the future course.
Introduction
Resting state functional magnetic resonance imaging (rs-fMRI) has provided important insight into functional brain network reorganization in Multiple Sclerosis (MS) at different disease stages.1,2 In this work we used rs-fMRI to assess which resting state networks (RSNs) are affected by the disease in cohorts of patients with similar mild disability but different disease duration. First, we focused on the identification of functional connectivity (FC) changes within the RSNs that discriminate Relapsing Remitting Multiple Sclerosis (RRMS) with either shorter or longer disease duration (MS1 vs. MS2). Then we used network modelling to assess whether and how functional interactions between RSNs (as opposite to within RSNs) differ between the groups.Methods
36 RRMS patients with recent disease onset (≤5yrs duration, mean-EDSS=1.4±0.9; MS1) and 26 RRMS patients with longer disease course (>5yrs duration; mean-EDSS=2.2±1.4; MS2) underwent MRI using a 3T GE Signa HDxt scanner with eight-channel heal-coil. 29 healthy controls (HC) were also scanned.
MRI acquisition: For each subject rs-fMRI images were acquired using a GRE sequence (TR/TE=2500/35 ms; voxel size=3.75x3.75x4mm3, FOV=240mm, 37 slices, 240 volumes). A high-resolution 3DT1w volume was also acquired using an IR-SPGR acquisition (TR/TE/TI= 2.8/6.6/400 ms; flip angle 15°; 180 slices; voxel size=0.5x0.5x1mm3, FOV=240mm) for anatomical reference.
fMRI analysis: for each subject rs-fMRI were preprocessed using FSL3 and then images underwent Independent Component Analysis (ICA) using MELODIC4 (FSL) to identify the RSNs. A non-parametric permutation test (dual regression)3,4 was applied to compare the group-specific maps, using age, gender, education level and lesion load as additional covariates in the general linear model (GLM). Finally, we used the FSLNet3,5 to perform a functional connectome (f-connectome) modeling, considering each identified RSN as a “node” in the model. Specifically, for each subject the signal time-courses of all the identified RSNs, as they output from the dual regression, were taken and normalized by subjects’ standard deviations. The RSN time-courses were then used to calculate subject-wise full correlation and partial correlation matrices. The resulting correlation coefficients were Fisher z-transformed and corrected for temporal autocorrelation. Finally, the correlation matrices were tested for group comparison using a GLM on partial correlation values as they reflect direct network connections.6 Results were thresholded (p<0.05) and FWE-corrected.
Results
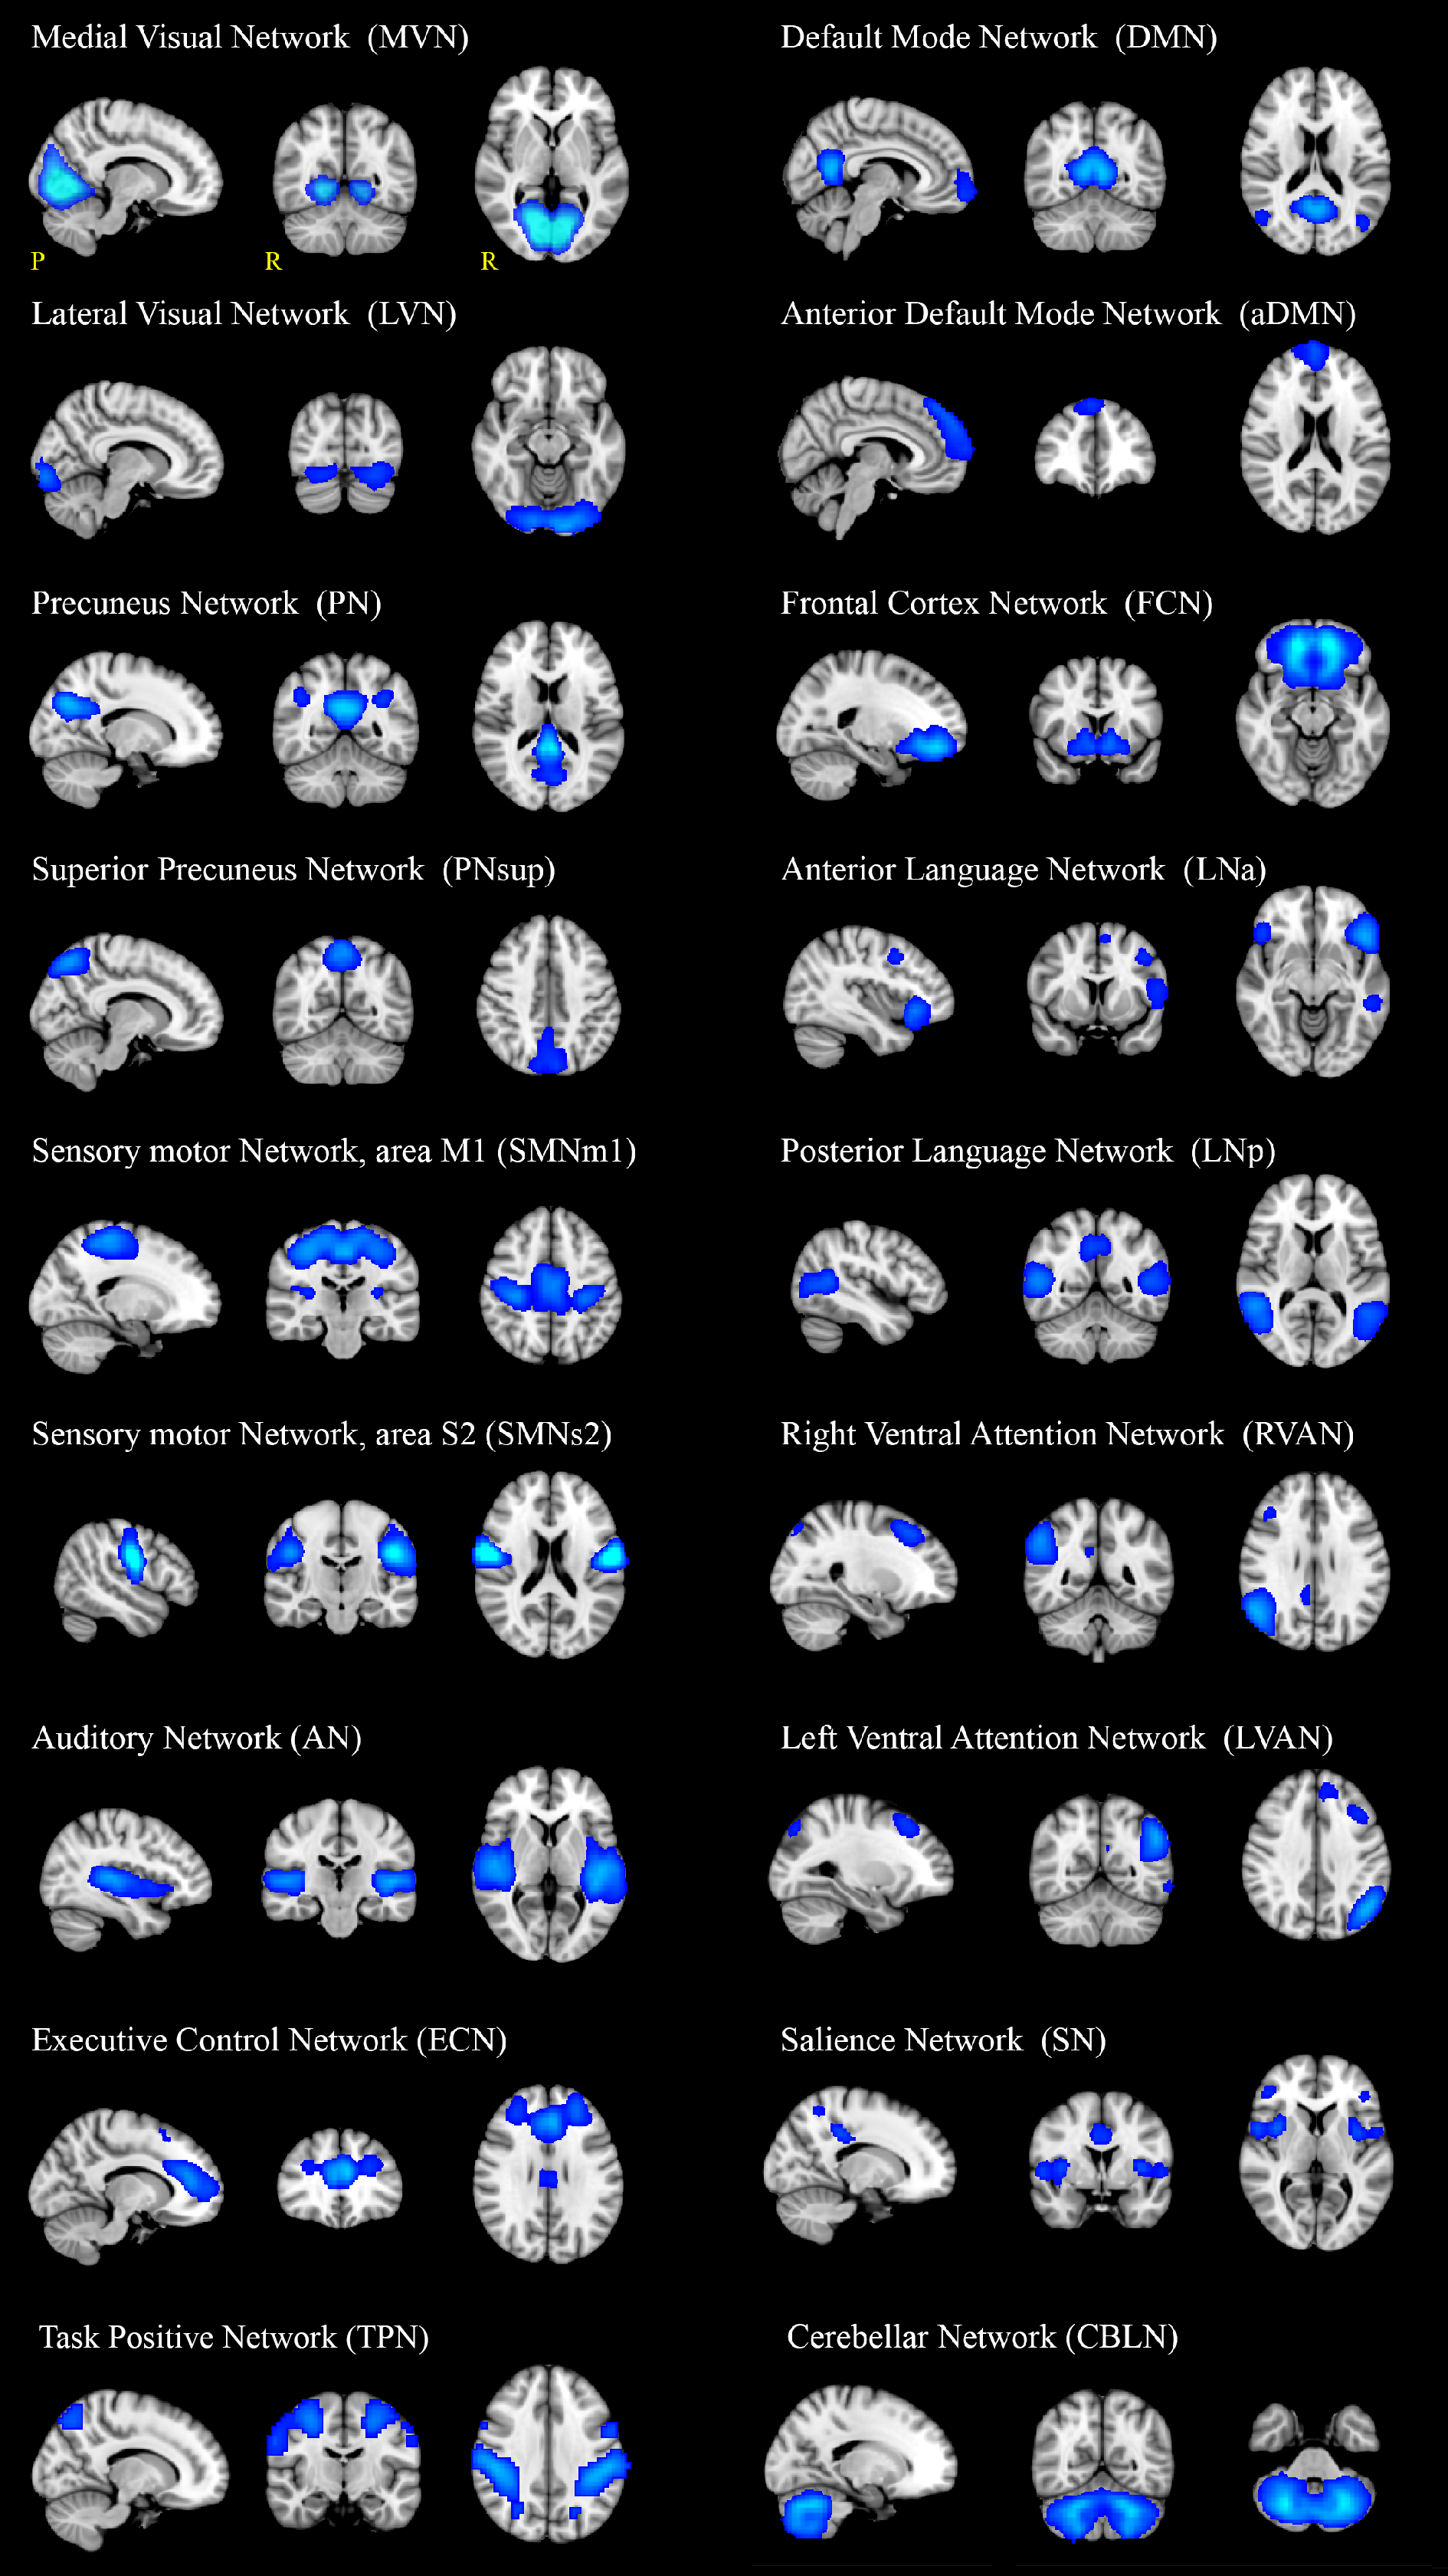
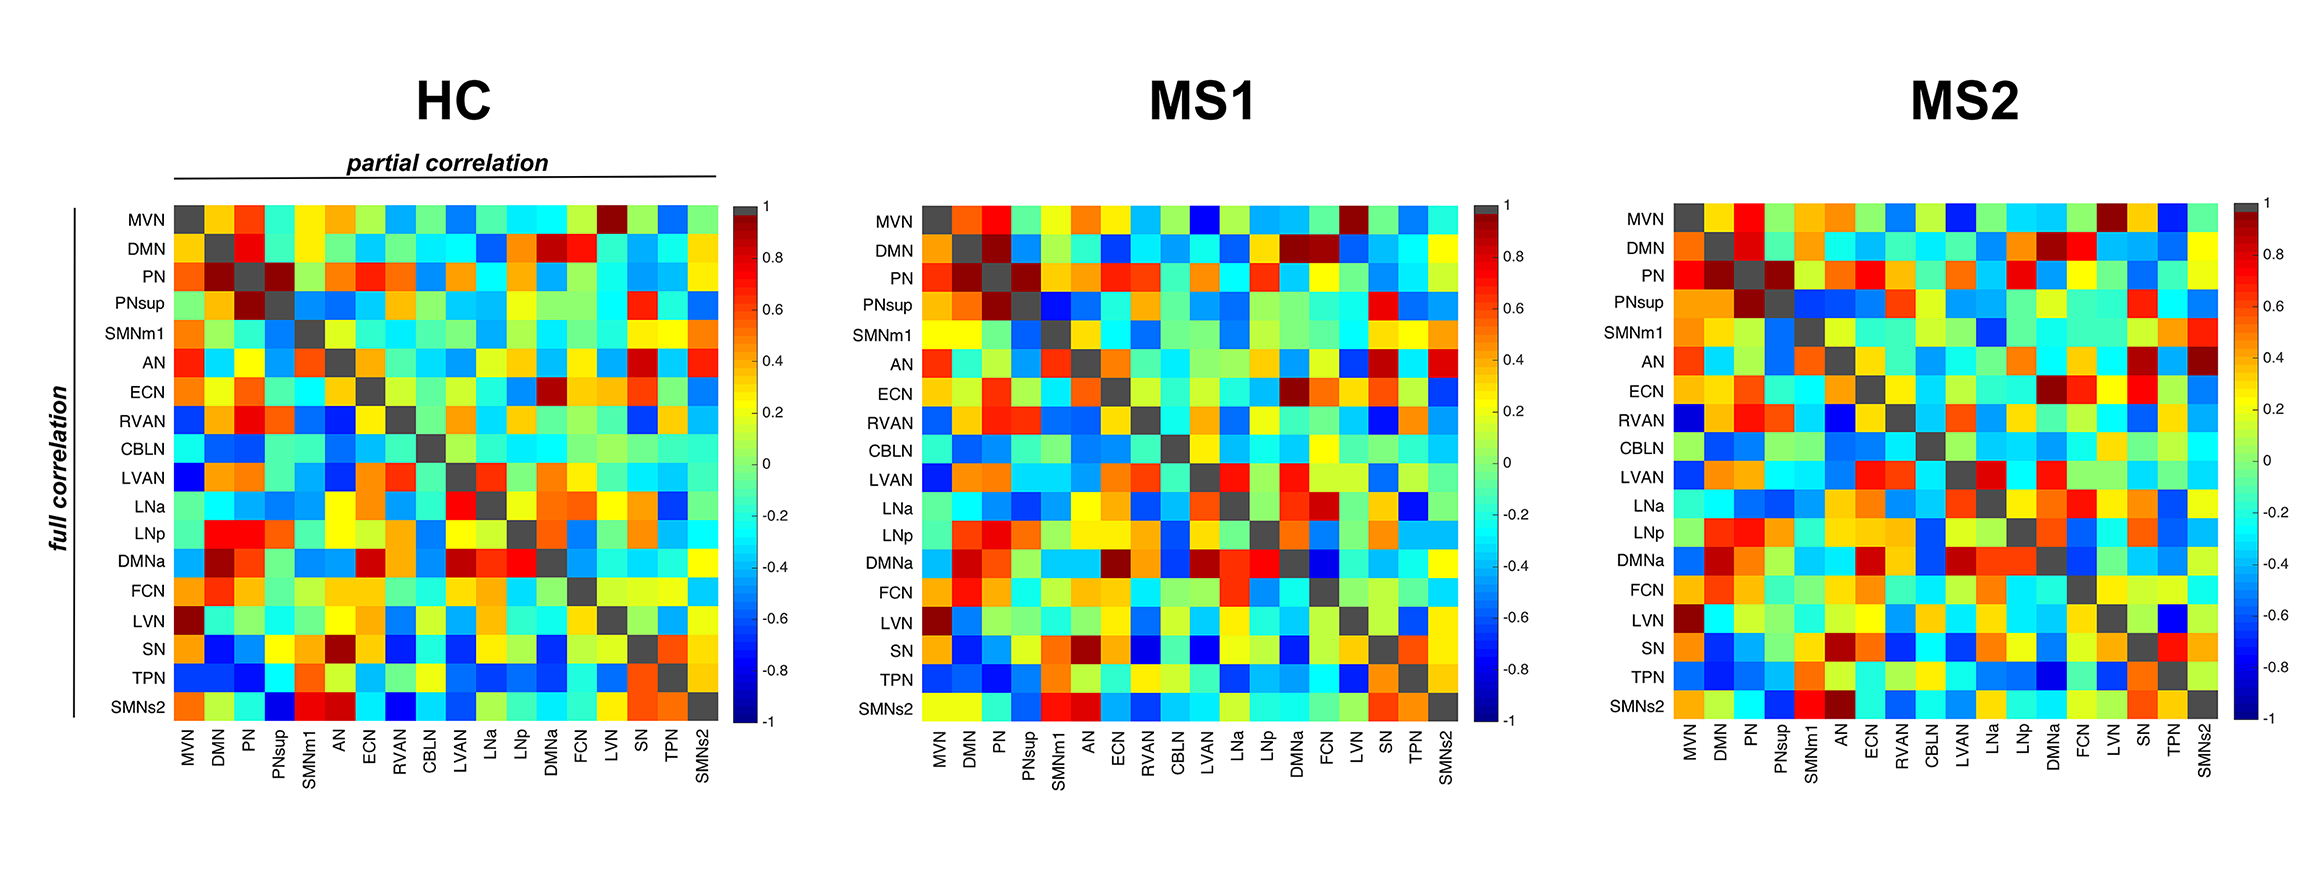
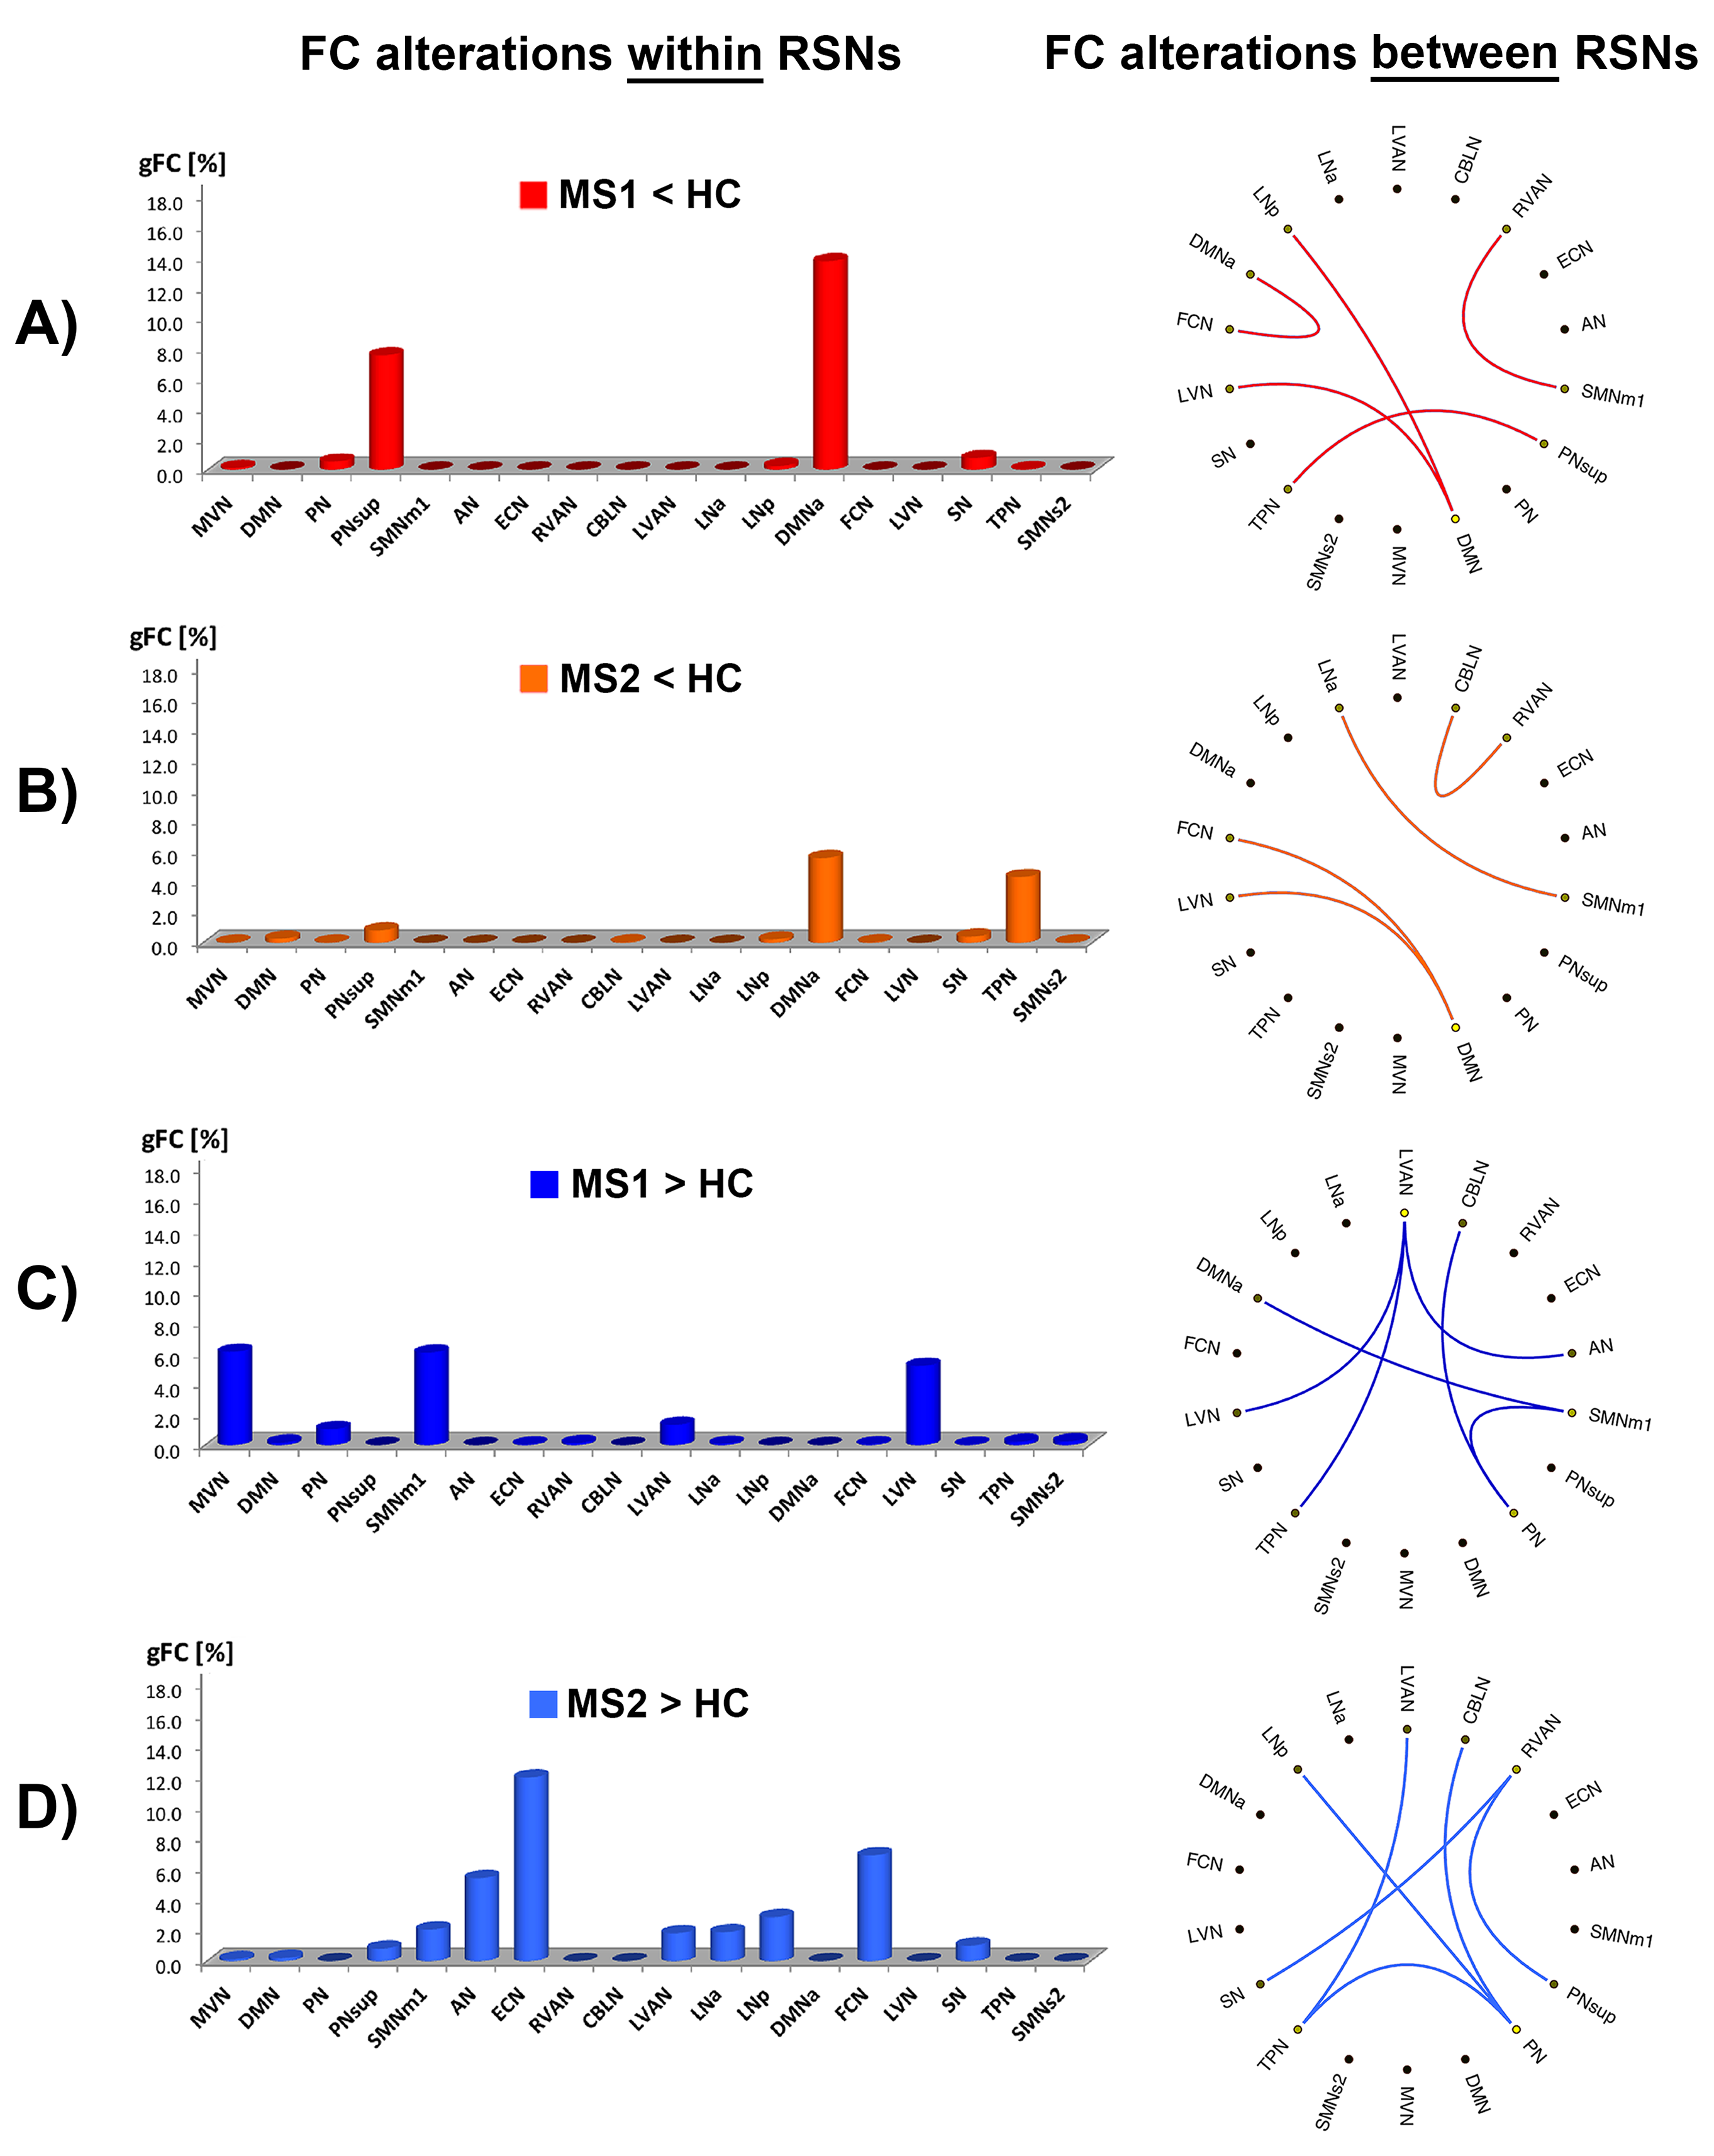
ICA analysis identified 17 RSNs (see Fig.1 for RSN definitions) across which correlations were computed (Fig.2). Results showed a widespread alteration within and between these RSNs in MS1 and MS2 compared to HC (Fig.3) and revealed more marked FC alterations in MS1 than MS2 (Fig.4).
FC changes within RSNs: compared to HC, the greatest FC-decreases in both groups were in aDMN (Fig.3.A-B). Further FC-reductions were observed in PNsup for MS1 and TPN for MS2. Increased FC was observed in both groups (vs. HC), with more evidence in MS2 (Fig.3.C-D). MS2 showed increased FC mainly in ECN, FCN and AN, while MS1 showed increased FC within SMNm1, MVN and LVN.
More interestingly, direct MS1-MS2 comparison revealed several FC-reductions in MS1 (see MS1<MS2, Fig.4), mainly affecting PNsup, ECN, LNp and AN. Compared to MS2, MS1 showed further FC reductions within LVAN, LNa, SN, FCN and aDMN. MS1 compared to MS2 showed also some FC-increases involving essentially TPN, LVN and RVAN (see MS1>MS2,Fig.4).
FC changes between RSNs: Compared to HC, the f-connectome (Fig.3.A-B) revealed a larger number of reduced between-network interactions in MS1 than in MS2, mainly affecting DMN. Both groups showed also a large number of increased between-network interactions (Fig.3.C-D), mainly involving LVAN, PN, SMNm1 in MS1 and PN,TPN, RVAN in MS2.
Direct MS1-MS2 comparison showed several reduced between-network interactions in the MS1 f-connectome (Fig.4). Compared to MS2, MS1 showed several reduced between-network correlations involving primarily SMNm1, LVN, RVAN and PNsup that resulted the networks with the highest number of weaker edges (see MS1<MS2,Fig.4). MS1 compared to MS2 showed instead stronger between-network interactions mainly involving ECN (MS1>MS2,Fig.4).
Discussion and Conclusions
Our results show widespread functional changes in both MS1 and MS2 and identify distinct patterns of FC alterations differentiating the involvement of RSNs between the two groups. Both MS groups revealed a complex pattern of functional changes, in which some RSNs, such as DMN, showed marked between-network alterations, but not relevant within-network changes (Fig.3.A-B). Compared to MS2, MS1 revealed a pattern of more marked FC alterations within and between RSNs, which may indicate differences in the pathophysiology of MS1 and MS2. These new insights in MS physiopathology suggest that FC alterations within and between multiple large-scale networks should be investigated to assess differences in groups with different disease course. Whether these differences are also indicative of a more aggressive disease course is to be confirmed with longitudinal studies.Acknowledgements
We thank the NZBRI in Christchurch (New Zealand), Canterbury Medical Research Foundation (New Zealand), the UK MS Society and UCL-UCLH Biomedical Research Centre, BCC (C. Mondino National Neurological Institute, Pavia, Italy, 5x1000 year 2013 funding) and University of Pavia for grant funding.References
1- Basile B (2013) Functional connectivity changes within specific networks parallel the clinical evolution of multiple sclerosis. Mult Scler 20(8):1050-1057
2- Sacco R (2013) The contribution of Resting State Networks to the Study of Cortical Reorganization in MS. Mult Scler Int 2013:857807
3- FSL, www.fmrib.ox.ac.uk/fsl
4- Beckmann CF (2004) Probabilistic independent component analysis for functional magnetic resonance imaging. IEEE Trans Med Imaging 23(2):137-52
5- Smith SM (2013) Resting-state fMRI in the Human Connectome Project. Neuroimage 80:144-68
6- Jenkinson M (2012) FSL. Neuroimage 62:782-90
7- Castellazzi G (2014) A comprehensive assessment of resting state networks: bidirectional modification of functional integrity in cerebro-cerebellar networks in dementia. Front Neurosci 8:223
Figures