2533
Sensitivity to pathological normal appearing white matter damage in multiples sclerosis – a comparison of DTI and DKI1Technische Universität München, Munich, Germany, 2GE Global Research, Munich, Germany, 3Max Planck Institute of Psychiatry, Munich, Germany, 4GE Heathcare, Paris, France, 5GE Global Research, Munich
Synopsis
A systematic comparison of diffusion tensor imaging (DTI) and diffusional kurtosis imaging (DKI) regarding the sensitivity to non-pathological white matter in multiple sclerosis is presented. We found first indications for a higher sensitivity of DKI compared with DTI in the normal appearing white matter compartment.
Introduction
The study of diffusion properties of white matter (WM) by MRI methods gained significant importance to characterize MS[1]. Previous MS studies reported significant increase of mean diffusivity (MD) as well as a significant decrease of fractional anisotropy (FA) for diseased tissue compared to healthy[2,3], with considerable potential for disease monitoring and prediction[4]. While conventional diffusion metrics are based on a Gaussian diffusion model, Jensen et al. introduced diffusional kurtosis to quantify the non-Gaussianity[5]. Non-Gaussian diffusion in biological tissue is caused by barriers (e.g. membranes) and compartments (e.g. intracellular and extracellular spaces). Due to axonal pathology induced by MS, the diffusion barriers are reduced and the kurtosis of the diffusion signal should be decreased while the ADC should be increased. Here, we present a systematic comparison of DTI and DKI regarding the sensitivity to non-pathological WM in MS.Methods
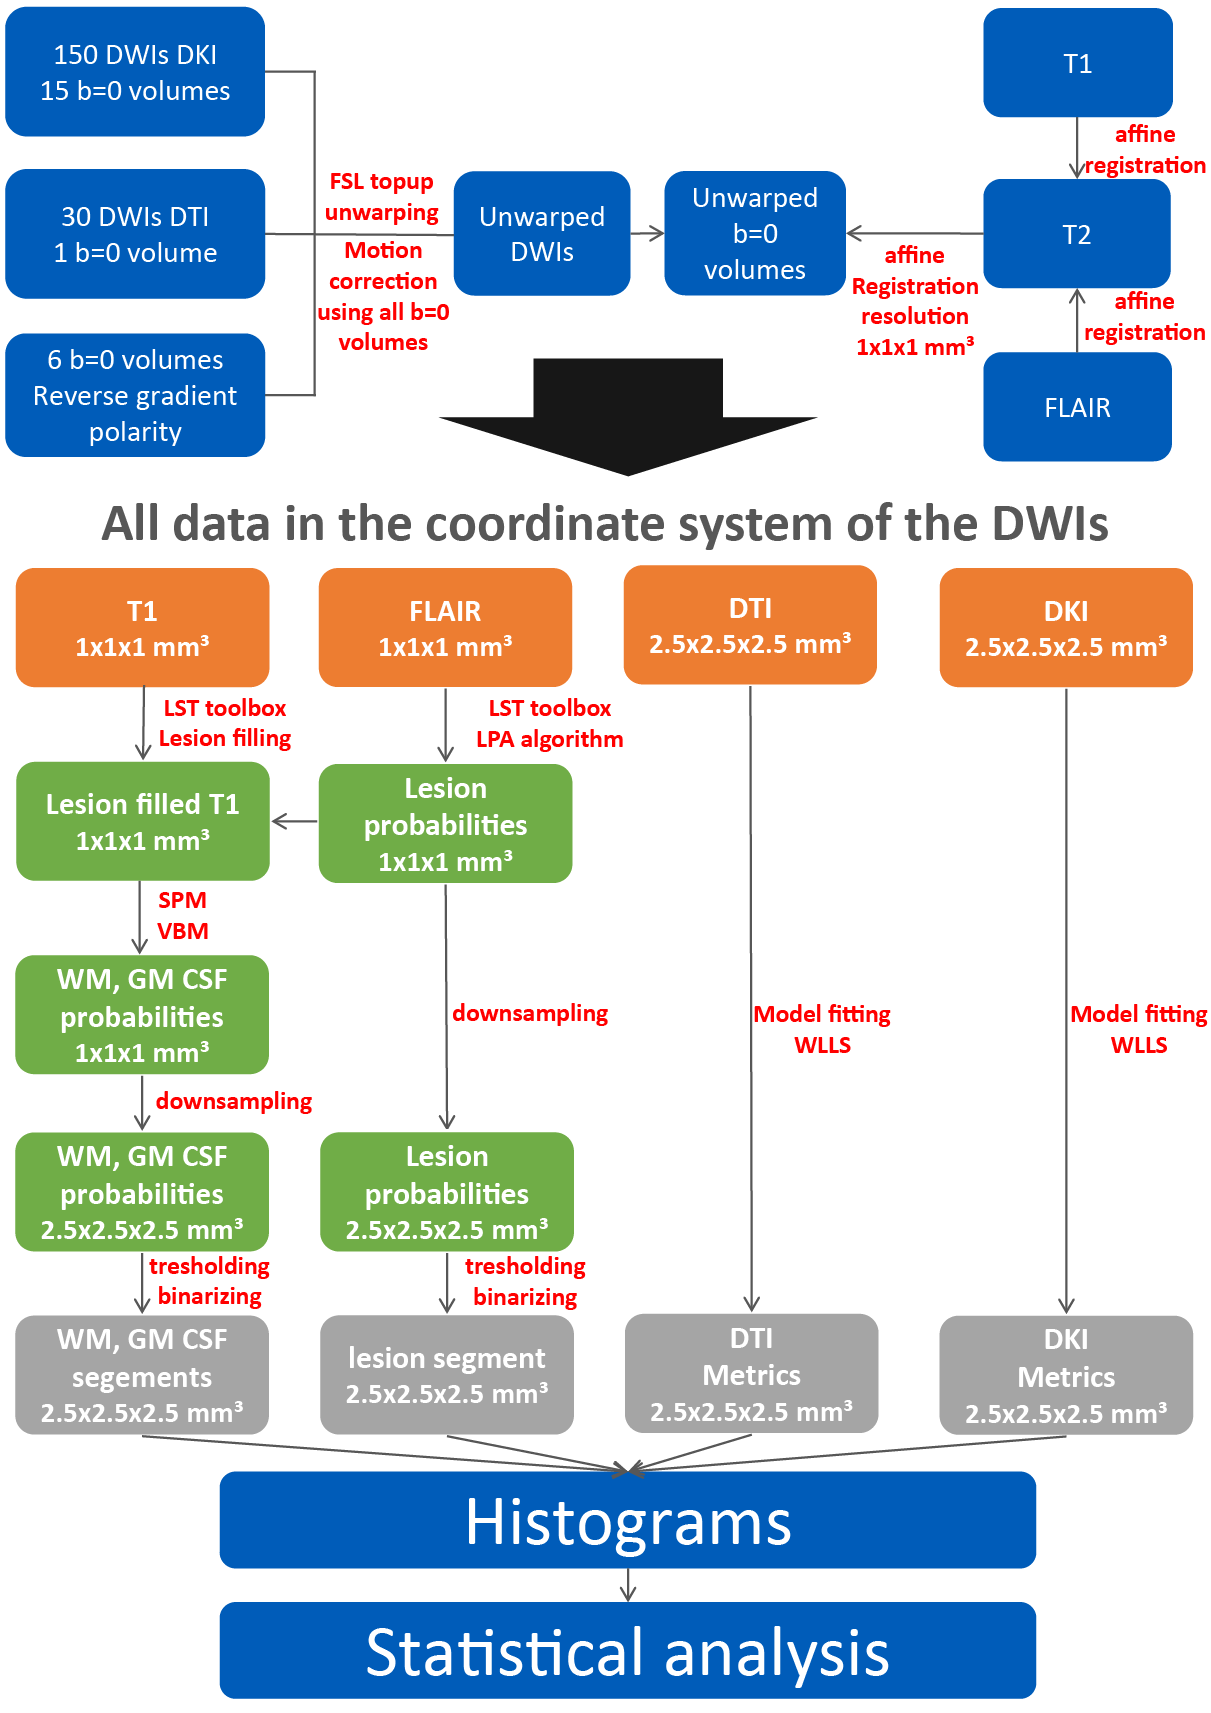
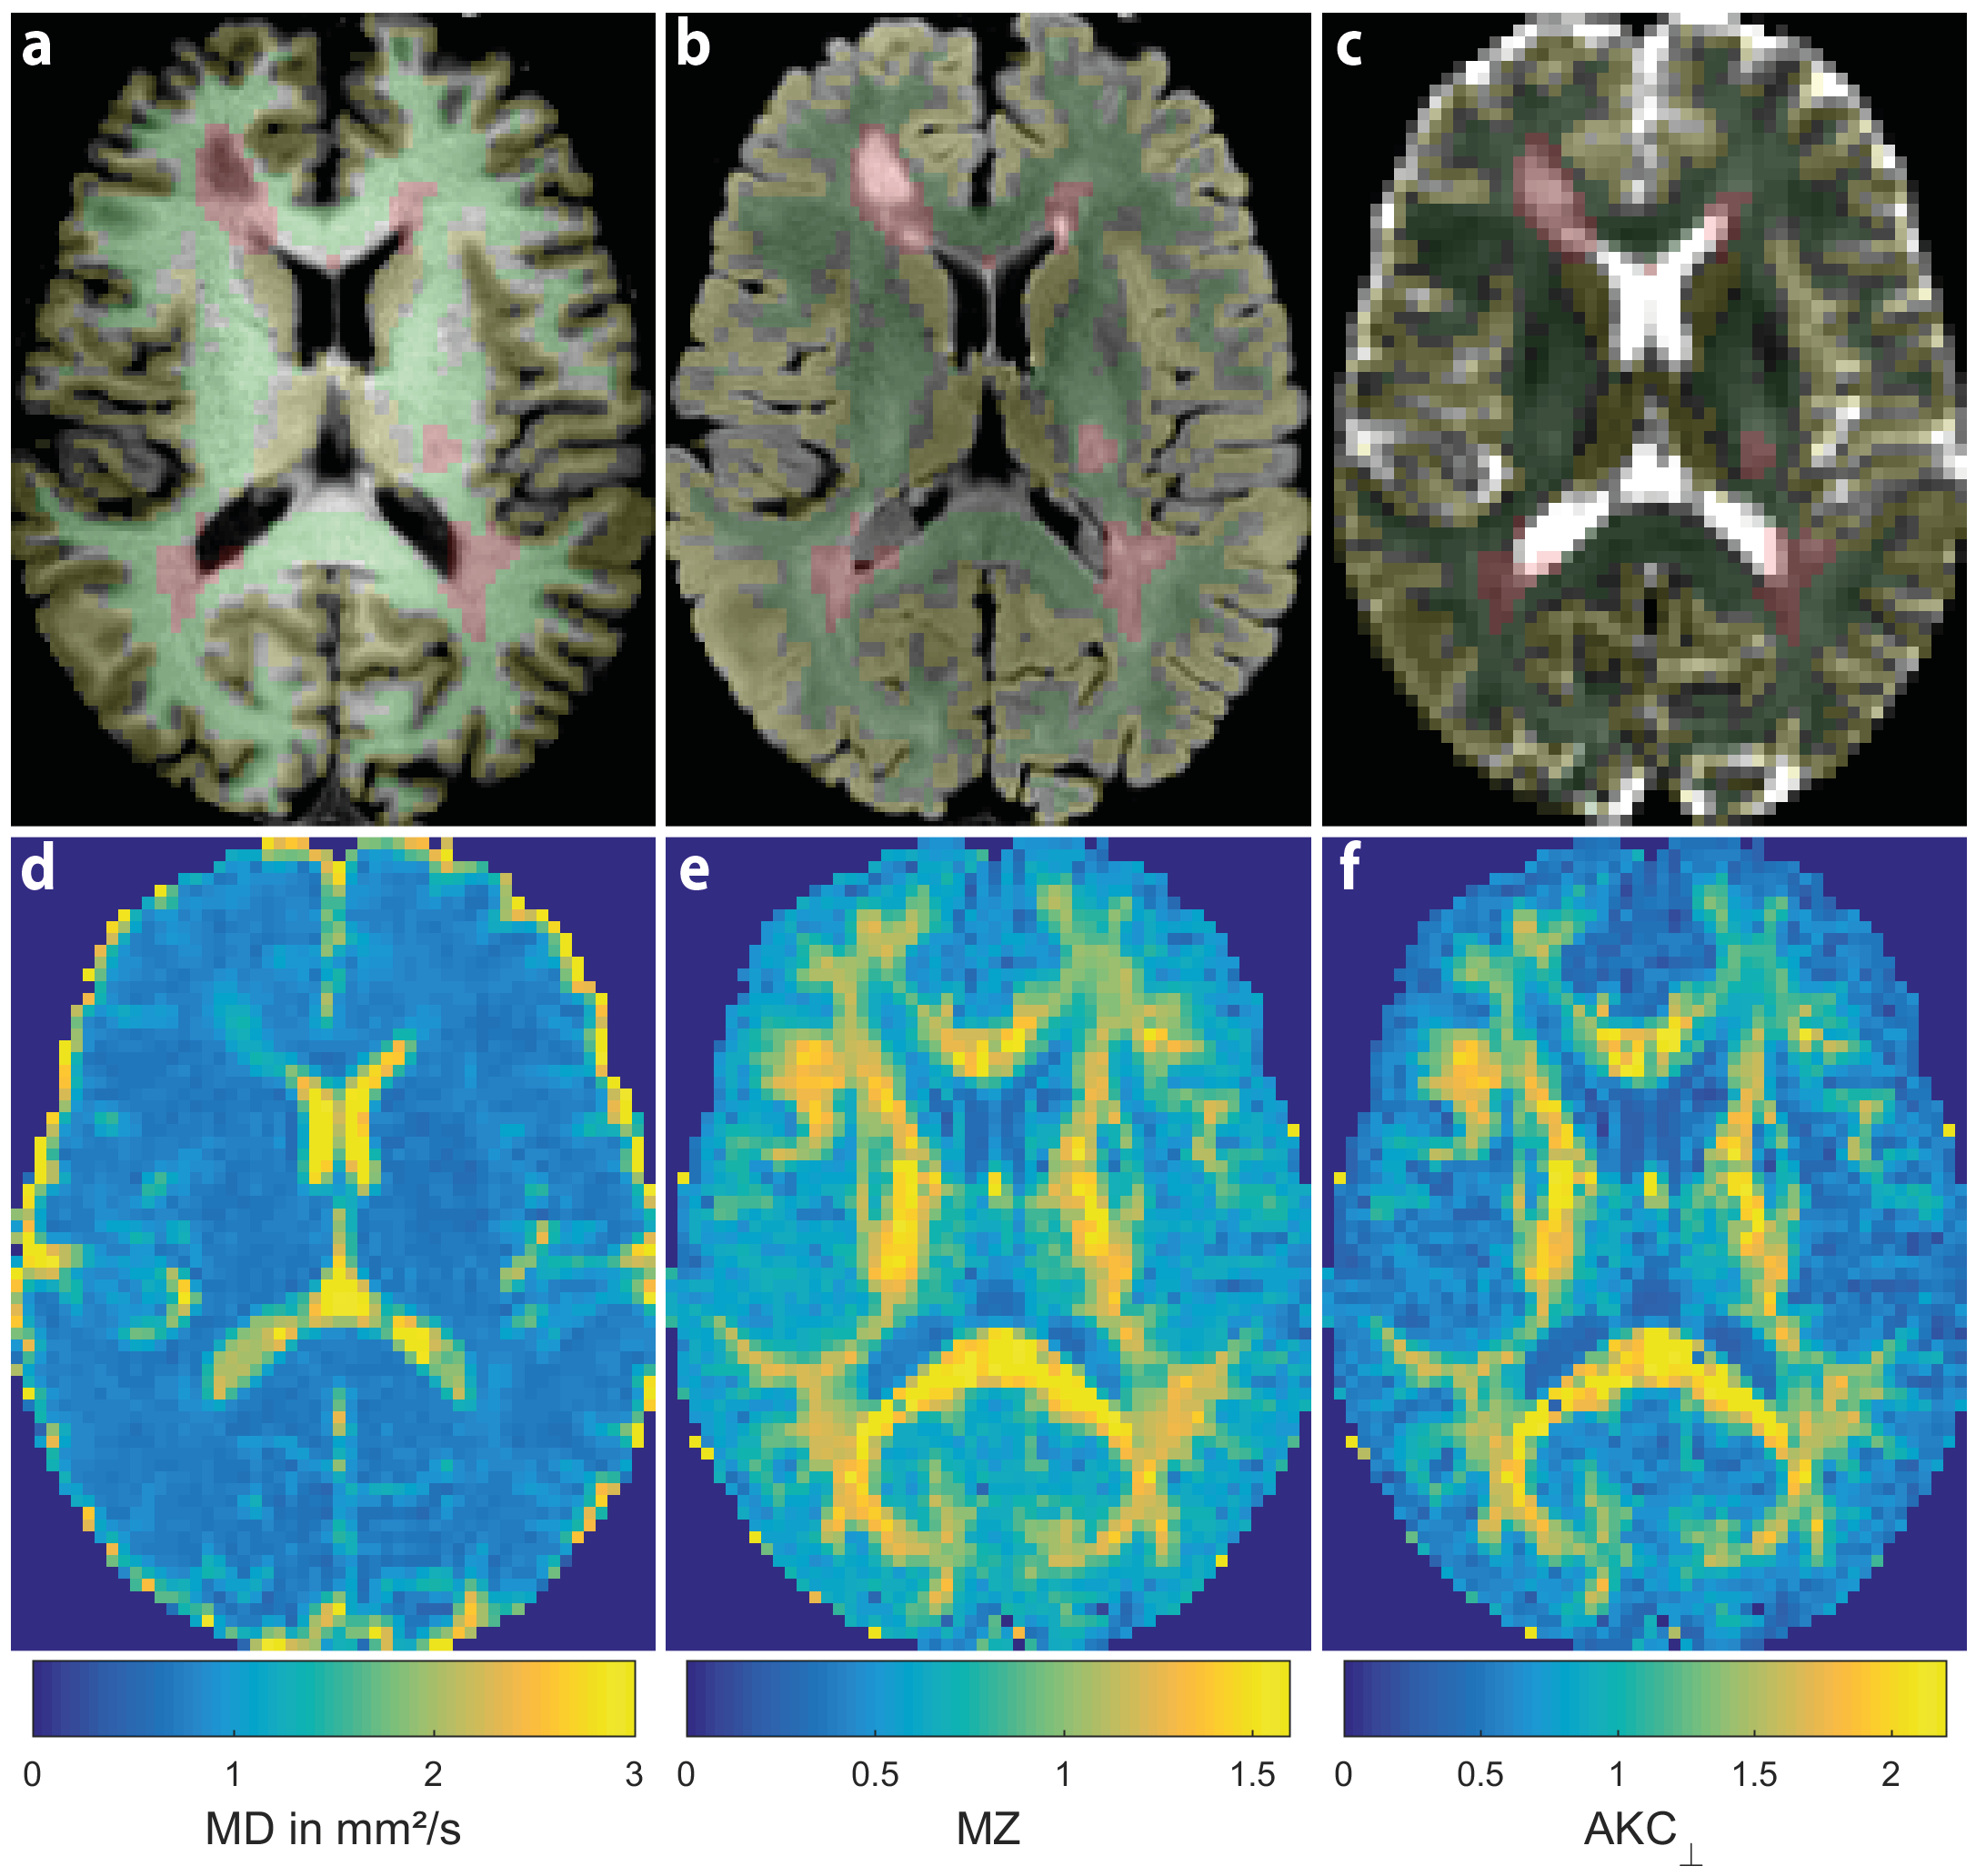
Echo-planar DWI experiments of 20 MS patients and 20 healthy volunteers (age and gender matched) were performed using a 3T GE MR750 MR scanner (GE Healthcare, Waukesha, USA) with a 32-channel head coil (TE=78.3ms, TR=5.5s, 96×96, 50 slices, FOV=24×24×12.5cm³, ASSET factor 2). DWI schemes comprised 150 volumes of an undersampled DSI scheme[6,7] (bmax=3000 s/mm²) and 30 DWIs of a single shell DTI scheme (bmax=1000s/mm²). An in-house tool has been used to fit the DTI and kurtosis tensors using a WLLS algorithm. Structural contrasts T1, T2 and FLAIR were acquired using a GE cube sequence (1mm³ isotropic). The postprocessing pipeline is shown in Fig. 1. Fig. 2 depicts exemplary segmentation maps and parametric DTI and DKI maps. Histograms of several diffusion metrics including MD, FA, orthogonal and parallel ADC (ADC⊥, ADC||), mean, orthogonal, parallel and maximum kurtosis (MZ, ADC⊥, ADC||, AKCmax) were computed for WM, normal appearing WM (NAWM, WM without lesions), gray matter (GM) and brain (GM+WM). From the normalized histograms, several metrics were computed, i.e. mean, peak position, peak height and standard deviation.Results
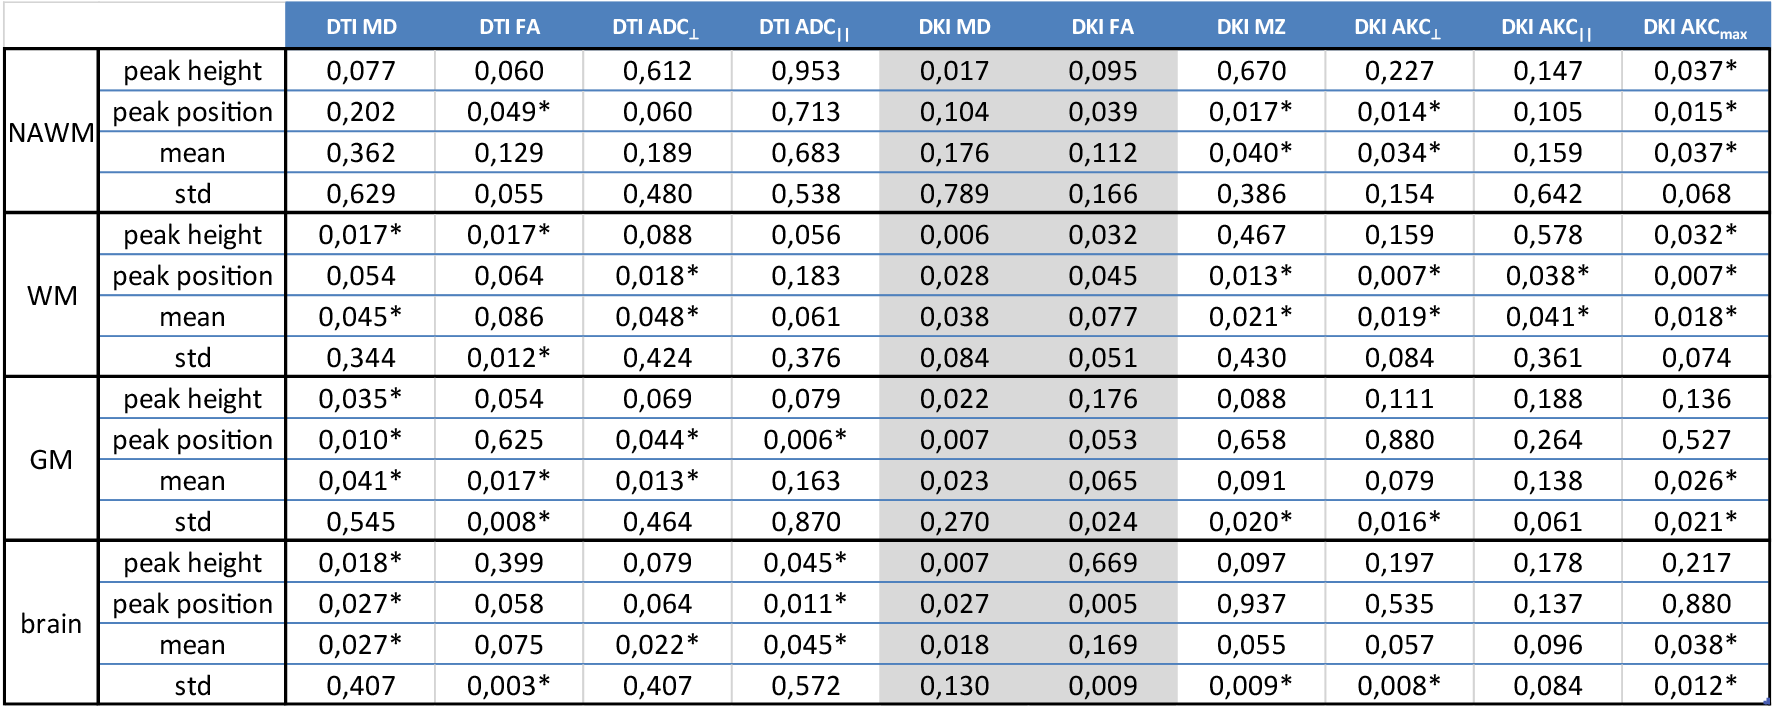
Fig. 3 tabulates p-values of T-tests employed to compare histogram metrics of different compartments between patients and controls. In NAWM, DKI yielded lower p-values than DTI with a higher number (7 vs. 1 of 16) of nominally significant results (p<0.05). In the WM compartment (that includes T2-lesions), the sensitivity of both DTI and DKI is relatively higher compared with the NAWM compartment which is expected as lesions show strong diffusional abnormalities. For WM, DKI and DTI generally yielded similar number of nominally significant group differences but DKI still achieved lower p-values for peak position and mean. In GM and brain, DKI provided a lower number of significant differences than DTI. Overall, the orthogonal components (ADC⊥, AKC⊥) yielded similar or slightly better p-values than the corresponding mean values (MD, MZ). AKCmax provided also a high sensitivity, comparable to MZ and AKC⊥. The parallel components (ADC||, AKC||) were generally the least sensitive. This is comprehensible because axonal damage primarily changes the diffusion properties in orthogonal direction.
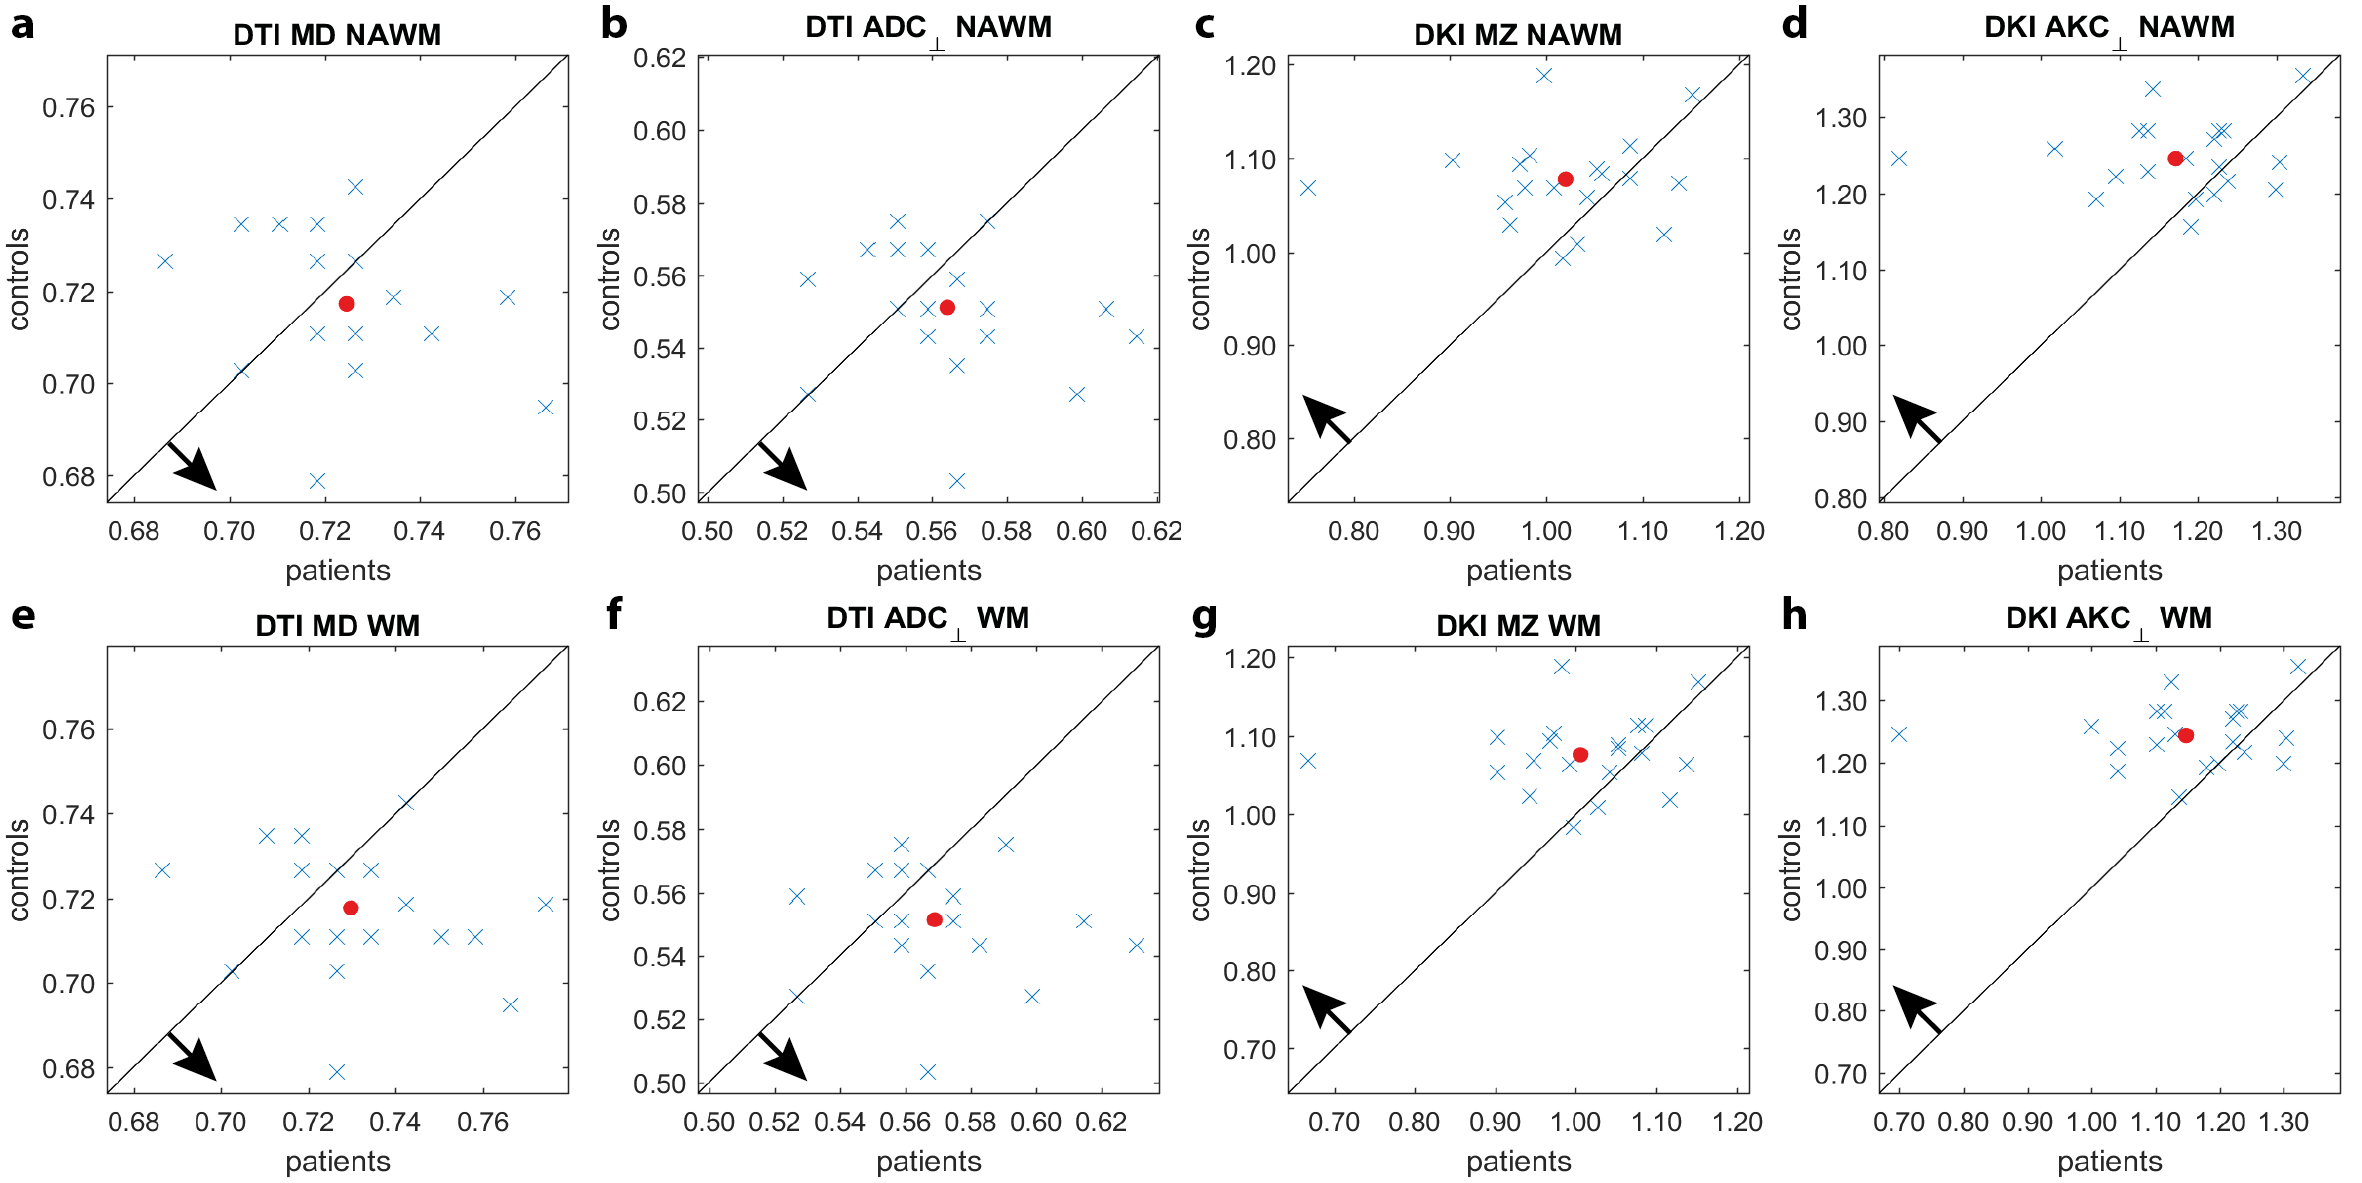
Fig. 4 shows pairwise scatter plots of the histogram peak position of the patients and the corresponding age and gender matched controls. In all diagrams the center of the point cloud is shifted according to the hypothesis, i.e. increased diffusivity or decreased kurtosis for MS patients. Interestingly, the DKI plots (4c,d,g,h) exhibit a patient outlier with very low kurtosis which is not clearly delineated in the DTI plots (4a,b,e,f). However, even without this outlier, the variance of the patient group is higher compared to the control group for DKI than for DTI which may indicate a higher sensitivity of DKI.
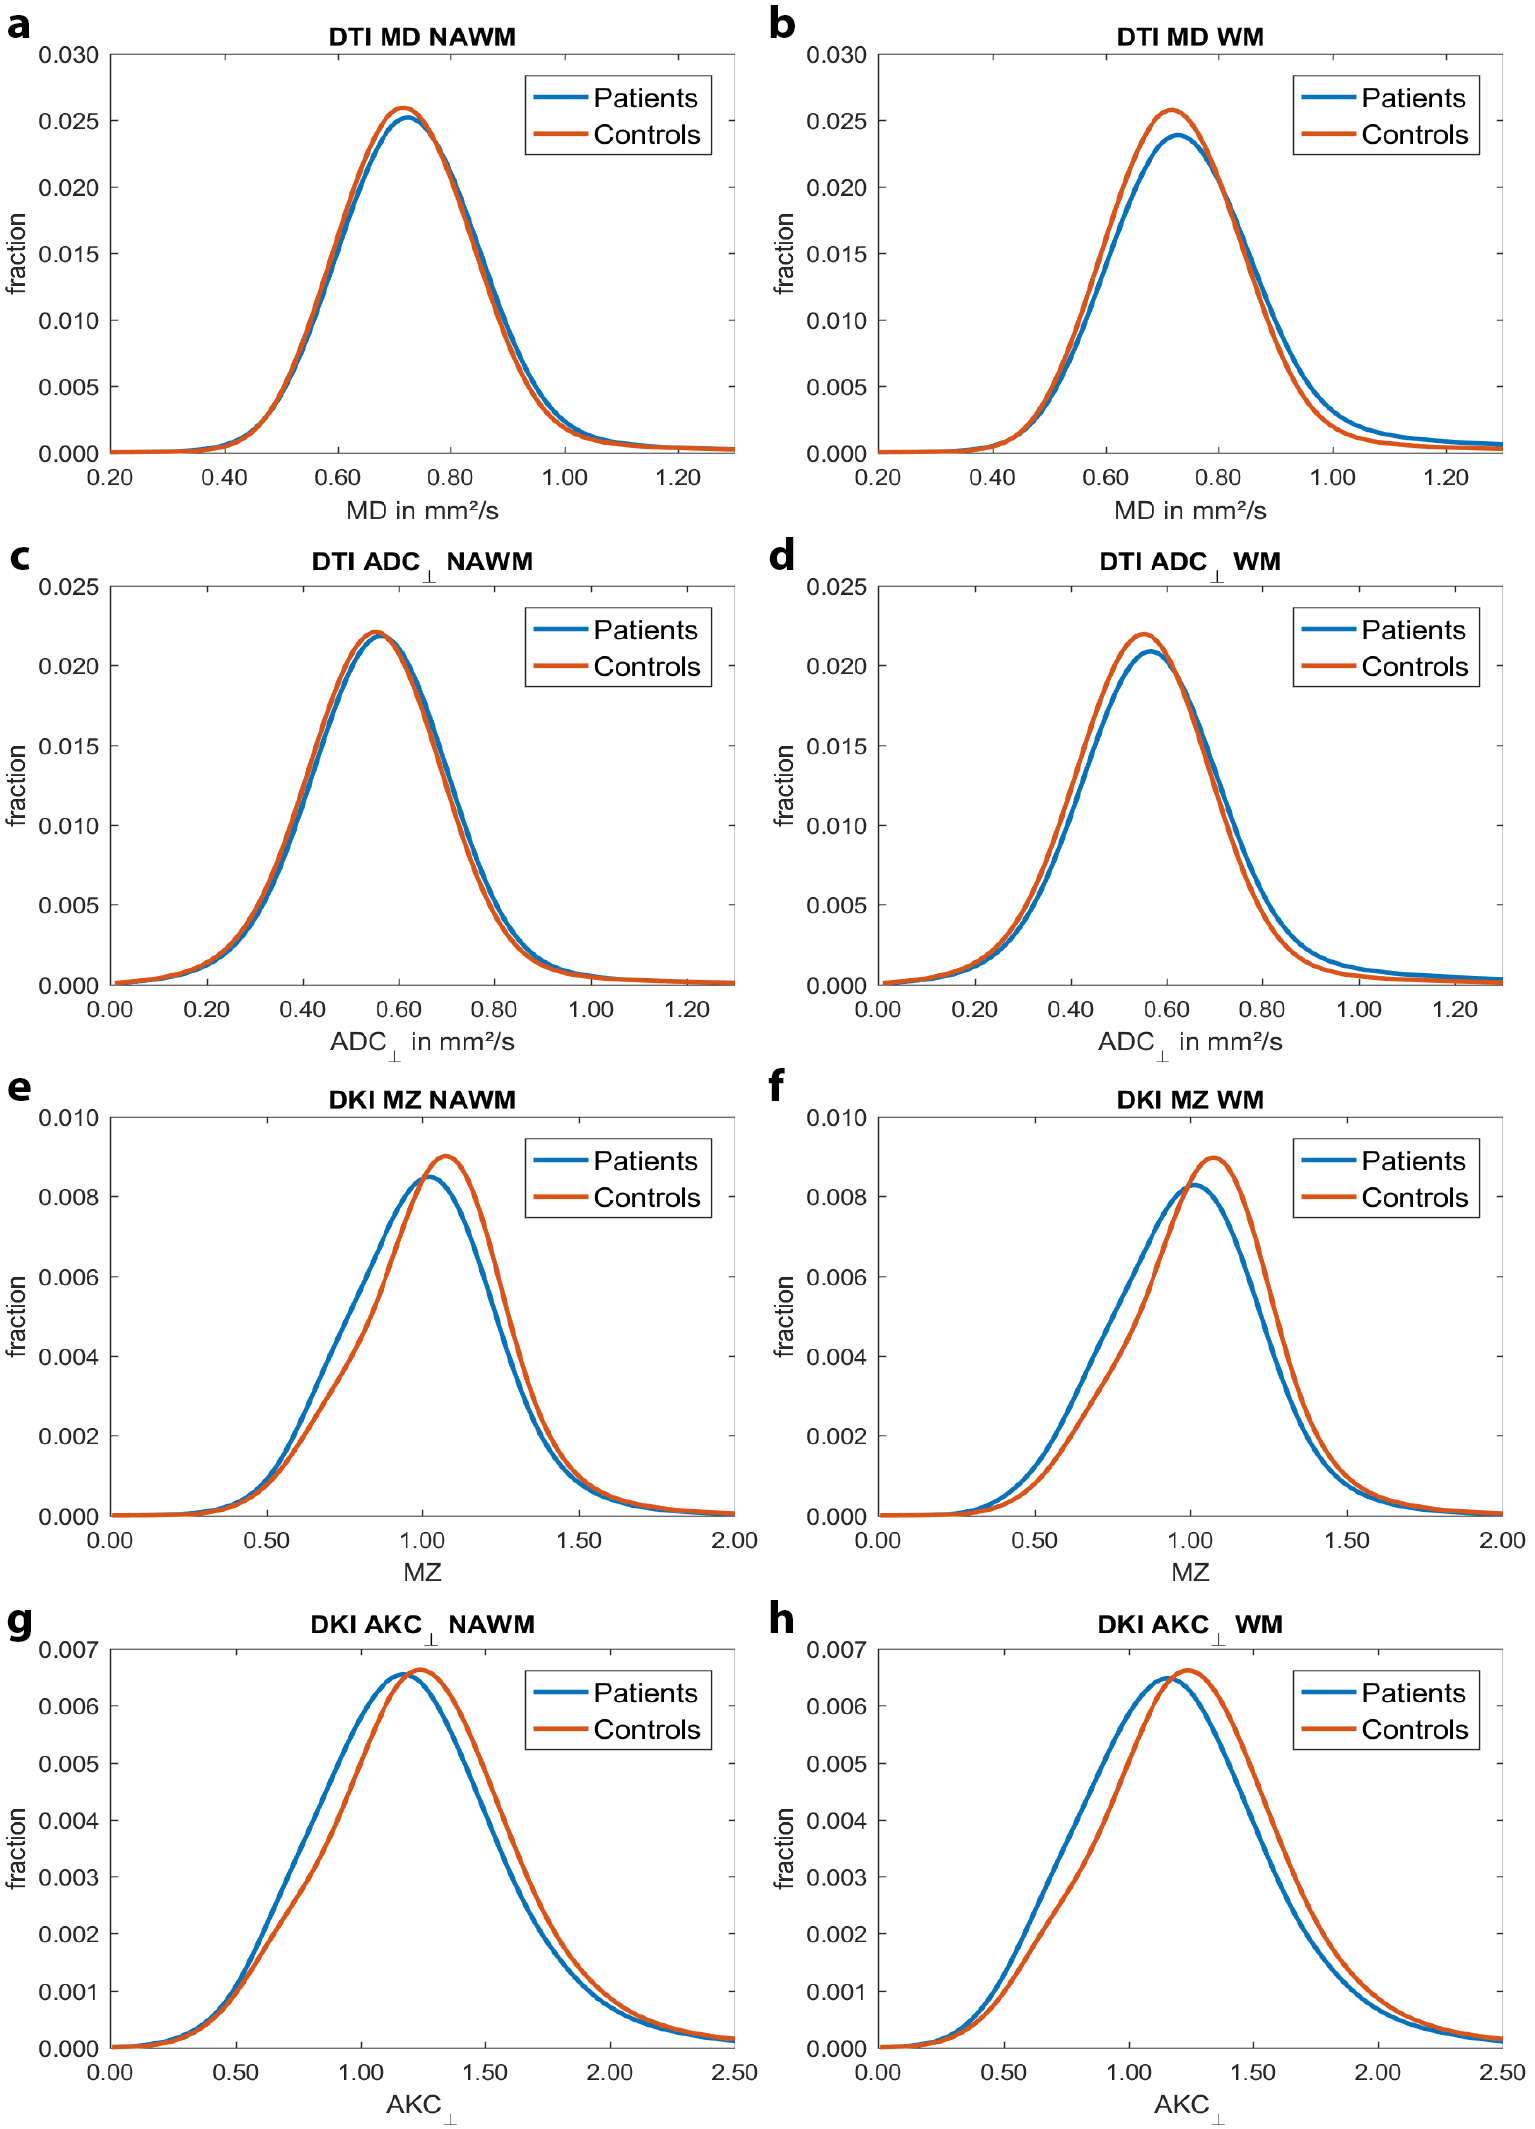
Fig. 5 depicts group average histograms for the NAWM and WM compartment: In NAWM, the histograms of MD and ADC⊥ (Fig. 5a,c) show little group differences while the discrimination is clearer for MZ and AKC⊥ (Fig. 5e,g). Moving on to the WM compartment, the discrimination improves for MD and ADC⊥ (Fig. 5b,d), yet, this improvement is much less pronounced for MZ and AKC⊥ (Fig. 5f,h). Overall, these qualitative histogram comparisons confirm the aforementioned statistical analyses, that DKI seems more sensitive in NAWM.
Discussion
We systematically applied histogram analysis on DKI and DTI measures in MS, finding first indications for a higher sensitivity of DKI compared with DTI in the NAWM compartment. Contrary DKI was clearly less sensitive in the GM and brain compartments. However, it is not clear yet whether the specificity of DKI to NAWM results from a higher sensitivity to axonal damage or less influence of atrophy-driven partial volume effects in the other compartments. Longitudinal data and larger samples are needed to fully establish DKI as novel diffusion MRI technique for MS biomarkers.Acknowledgements
No acknowledgement found.References
[1] Geet. al Applications of diffusion tensor MR imaging in multiple sclerosis. Ann N Y Acad Sci. 2005;1064:202-19.
[2] Heide et al. Diffusion imaging of experimental allergic encephalomyelitis. Magn Reson Med 1993; 29: 478–484.
[3] Filippi et al. Diffusion tensor magnetic resonance imaging in multiple sclerosis. Neurology. 2001; 56(3):304-11.
[4] Sämann et al. Brain volume and diffusion markers as predictors of disability and short-term disease evolution in multiple sclerosis. AJNR Am J Neuroradiol. 2012; 33(7):1356-62
[5] Jensen et al. MRI Quantification of Non-Gaussian Water Diffusion by Kurtosis Analysis. NMR Biomed. 2010; 23(7): 698–710
[6] Menzel et al. Accelerated diffusion spectrum imaging in the human brain using compressed sensing. MagnReson Med. 2011;66(5):1226-33
[7] Sprenger et al. Bias and precision analysis of diffusional kurtosis imaging for different acquisition schemes. Magn Reson Med 2016
Figures