2531
The cytoarchitectonic anterior-posterior subdivision of BA4 reveals different resting state networks suggestive of maladaptive mechanisms in MS1UCL Institute of Neurology, Queen Square MS Centre, University College London, London, United Kingdom, 2Department of Diagnostic Radiology, Faculty of Applied Medical Science, KAU, Jeddah, Saudi Arabia, 3Department of Neurosciences, Rehabilitation, Ophthalmology, Genetics and Maternal and Child Health, University of Genoa, Genoa, Italy, 4Department of Brain and Behavioural Sciences, University of Pavia, Pavia, Italy, 5Brain Connectivity Centre, C. Mondino National Neurological Institute, Pavia, Italy, 6Wellcome Centre for Imaging Neuroscience, University College London, London, United Kingdom, 7Brain MRI 3T Mondino Research Center, C. Mondino National Neurological Institute, Pavia, Italy
Synopsis
This study investigates whether it is possible to characterise different resting state fMRI (rsfMRI) networks connected to the cytoarchitectonic subdivisions of Brodmann area 4 (BA4) and how these networks behave in the presence of multiple sclerosis (MS). We showed that each sub-region identifies different rsfMRI networks, with the BA4p network including more associative and higher order functional areas whereas the BA4a network includes more force-related and motor areas. In MS, functional connectivity to the right hemisphere was lost and was positively correlated with the 9-HPT, suggesting a maladaptive mechanism rather than a compensatory mechanism.
Purpose
To investigate the characteristics of the anterior and posterior cytoarchitectonic subdivisions of Brodmann area 4 (BA4a and BA4p) in terms of their resting-state fMRI (rsfMRI) networks and alterations in multiple sclerosis (MS).Background
Cytoarchitectonically, Brodmann area 4 (BA4), i.e. M1, has been subdivided into two sub-regions[1]: Anterior (BA4a) and posterior (BA4p). FMRI motor task studies have shown that each sub-region contributes to different functions[2-6]: BA4p fMRI activity is modulated by attention[2], fine forces[3], imagined forces[4], and motor complexity[5], whereas BA4a is related to force production[6]. What are the healthy functional connectivity (FC) rsfMRI networks of BA4a and BA4p, and how are these networks modulated by pathologies such as MS?Methods
Subjects recruited: 26 Right-handed subjects (10 healthy subjects (HS): 5 females; mean (std) age 30 (3.65) years and 16 relapsing-remitting MS (RRMS) patients: 8 females; mean (std) age 34 (2.13) years; median (range) EDSS=3 (1.5, 6.5)); median (range) 9-Hole Peg Test (9-HPT) = 20.8 (14.7-33.1).
MRI: (3.0T Philips Achieva scanner and a 32-channel head coil): 1) T2*-weighted EPI (for rsfMRI): TE/TR=35/2500ms, voxel size=3×3×3mm3, SENSE=2, slices=46, FOV=192mm2, volumes=120; 2) PD/T2-weighted clinical scan; 3) 1mm isotropic 3D-T1-weighted scan.
Pre-processing and statistical analysis were performed using CONN[7] and SPM12[8]. Pre-processing of rsfMRI volumes includes: Slice timing, realignment, co-registration, normalization, outlier detections using ART[9] and smoothing with an 8mm kernel. Temporal processing with data denoising was applied to remove artifactual confounds effects (e.g. white matter and CSF signals, motion and scrubbing parameters) from the BOLD signals. Statistical analysis was computed at two levels. At the first level, weighted general linear bivariate correlation models including region of interest (ROI)-to-ROI connectivity matrices were calculated for each subject. The left (dominant) hemisphere BA4 sub-divisions were defined as source regions according to the cytoarchitectonic probability anatomy toolbox[10] as guided by[1]. 414 grey-matter areas[7,10-23] were used as target regions in CONN. At the second level, FC measures were calculated and compared at group level using ANOVA, one or two sample t-tests, as appropriate, identifying and comparing the rsfMRI networks connected to either BA4a or BA4p in HS and MS. ROIs’ FC measures were then correlated with the 9-HPT. Results are displayed using corrected FDR (p<0.05).
Results
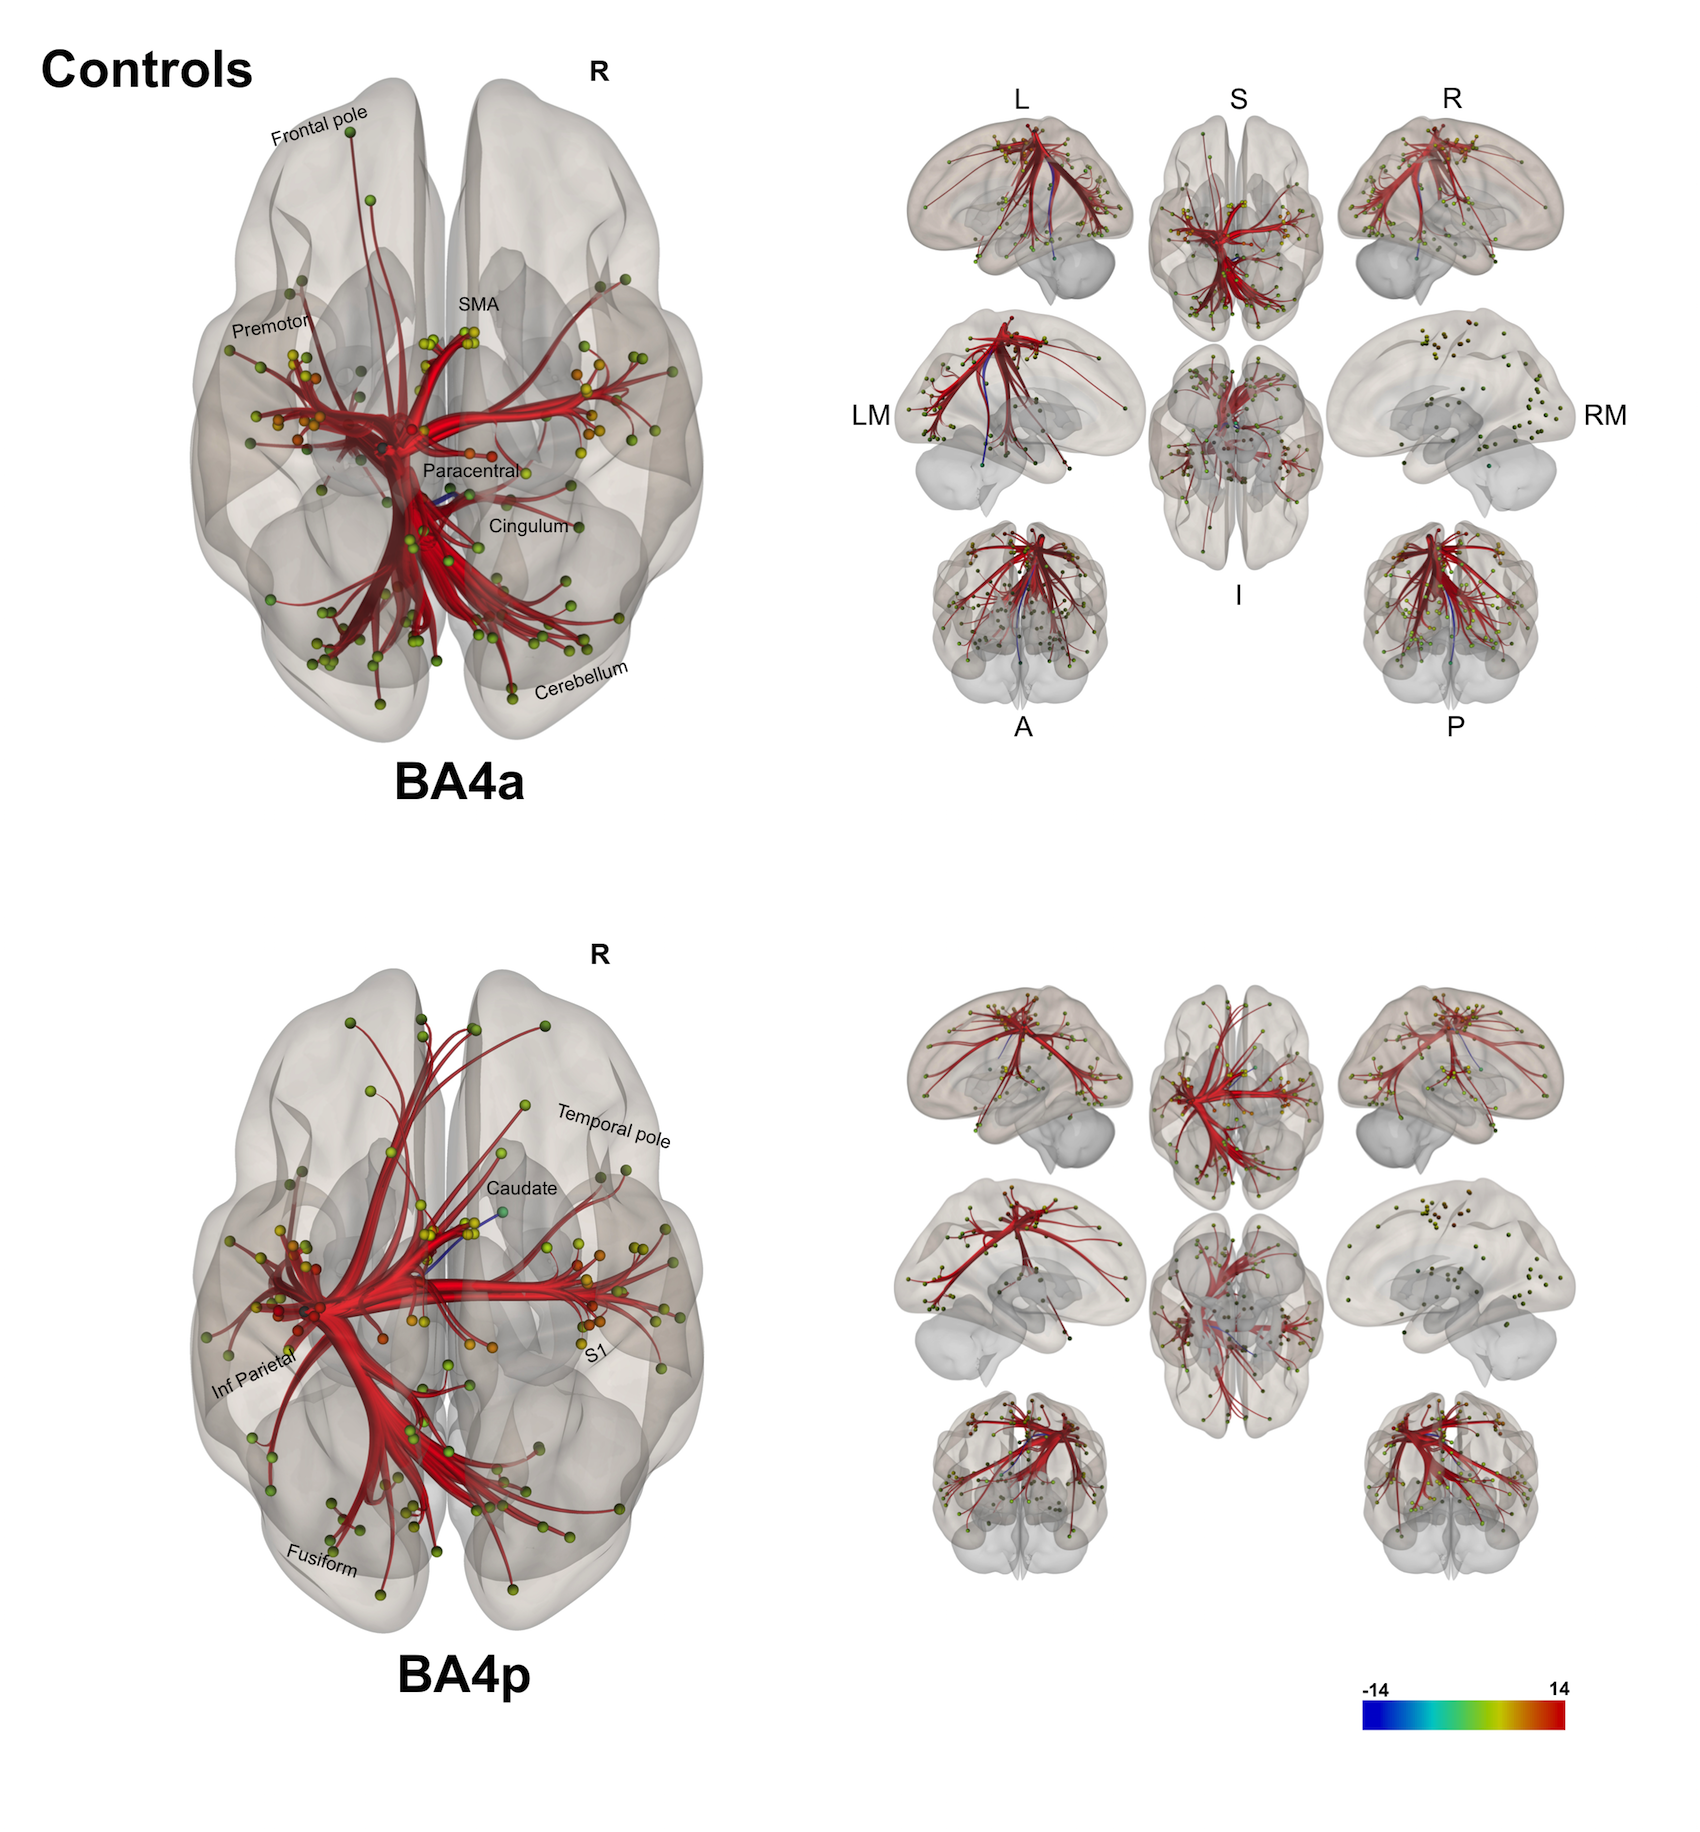
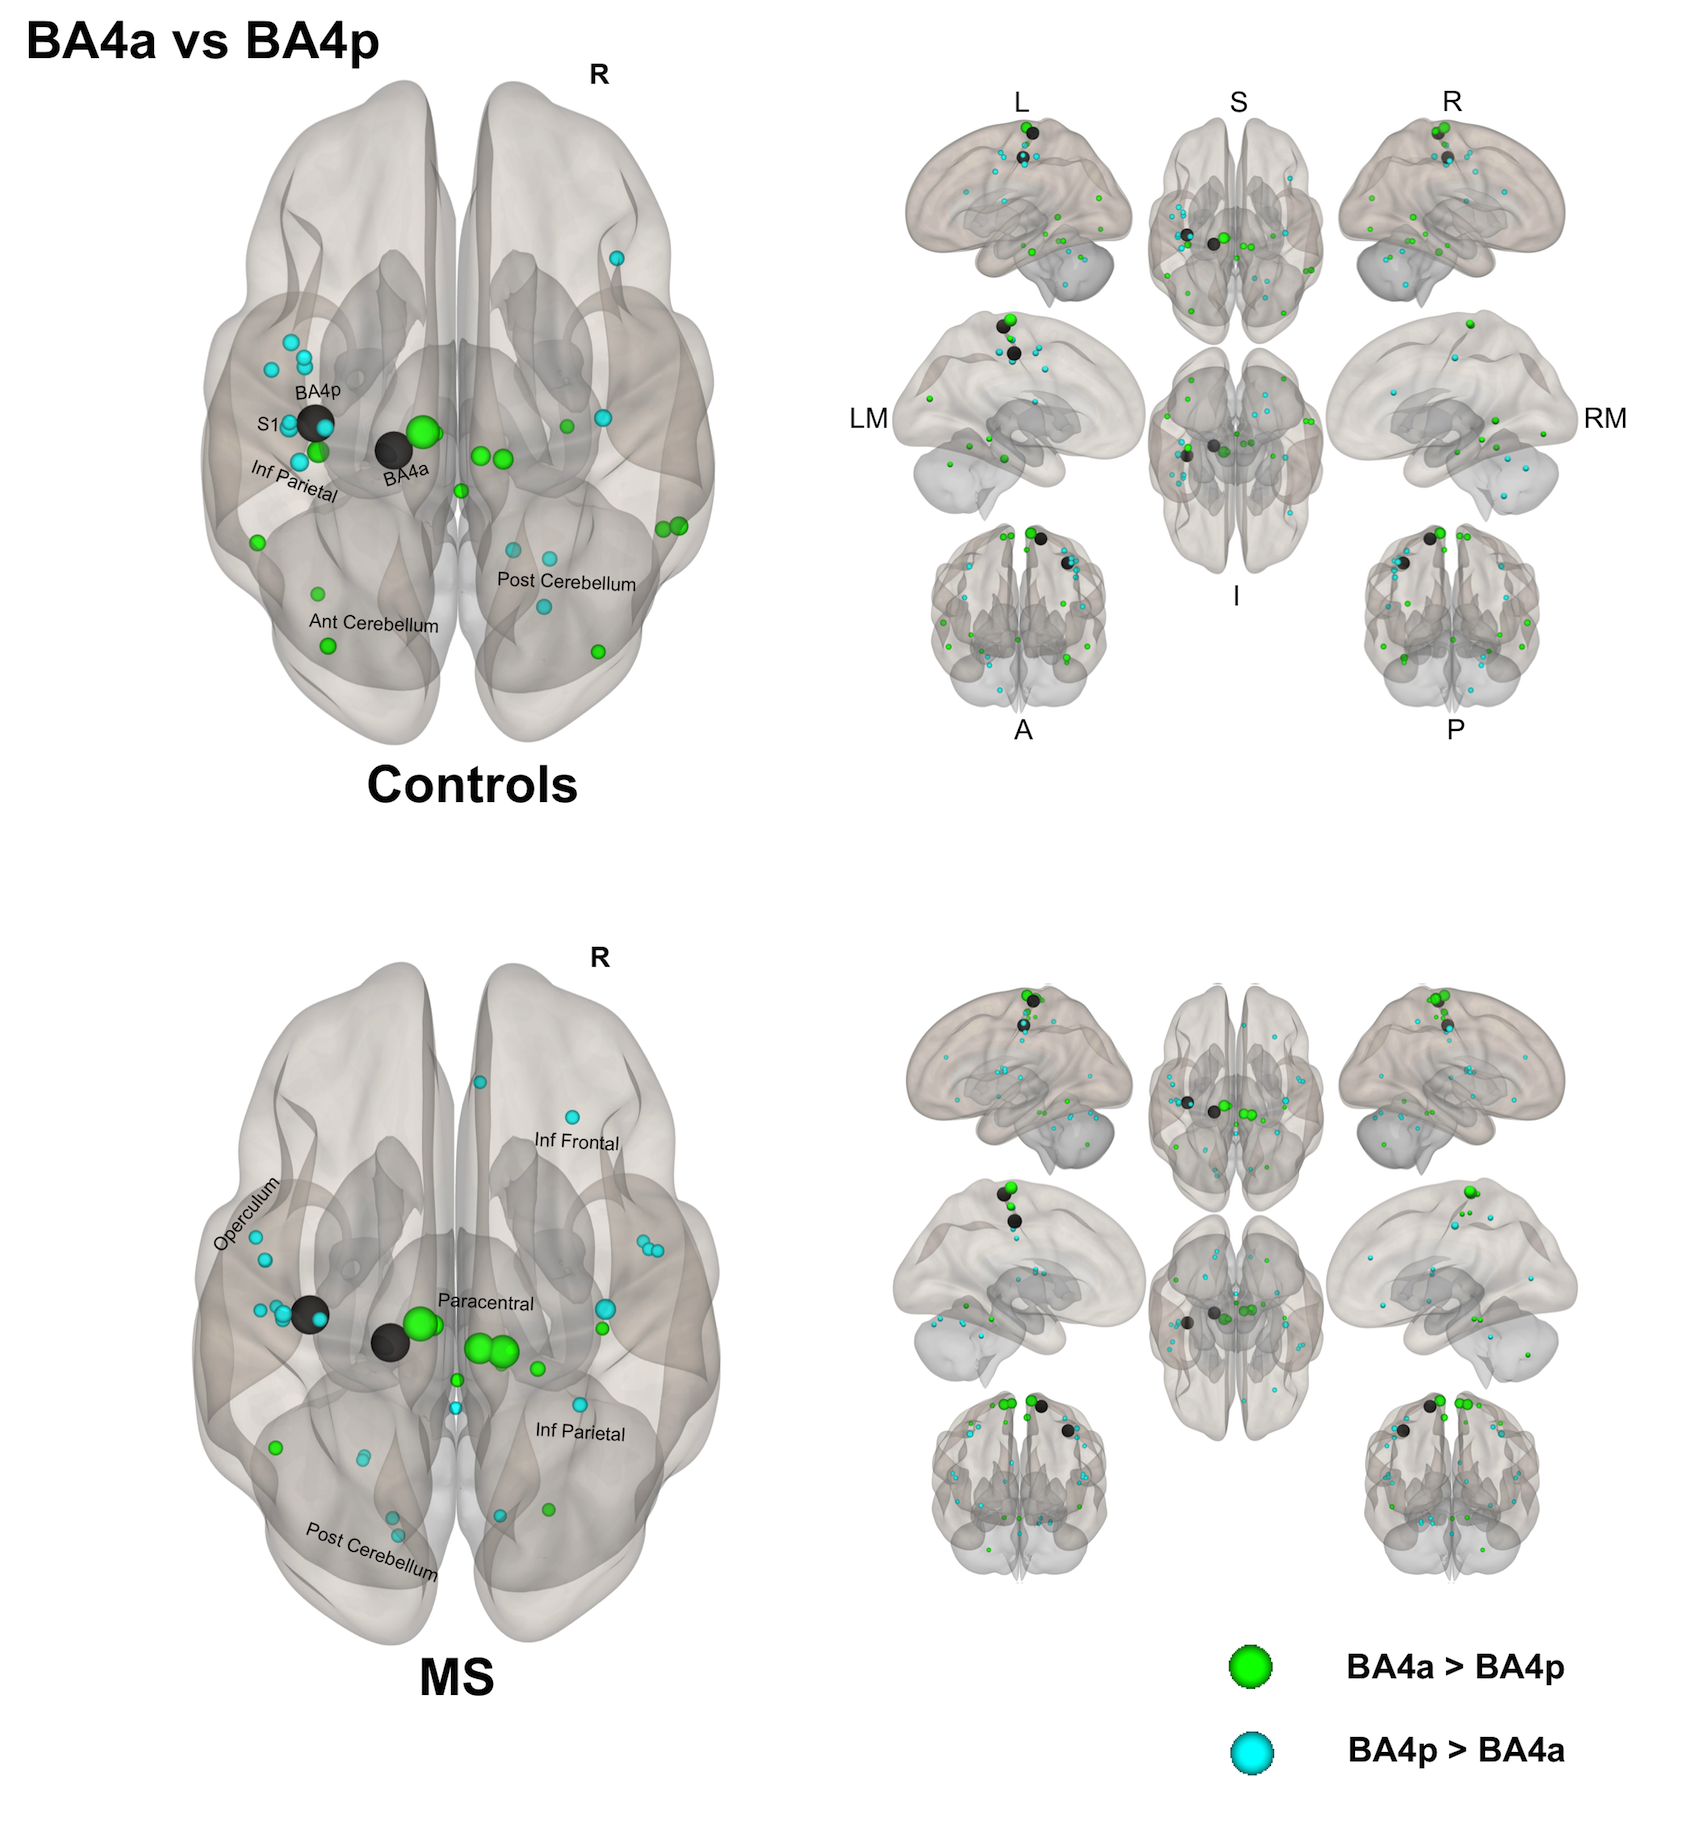
(1) Individual groups – different networks: Both sub-regions in both groups display different rsfMRI connectivity networks [figures 1-3]. In HS, BA4p has greater FC to associative, higher order and attentional regions (e.g. superior and inferior parietal lobules, primary and secondary sensory areas) whereas BA4a has greater FC to motor areas (e.g. premotor, supplementary motor and anterior cerebellar areas). In MS, the BA4p network includes additional areas (e.g. bilateral posterior cerebellum, visual and inferior frontal regions).
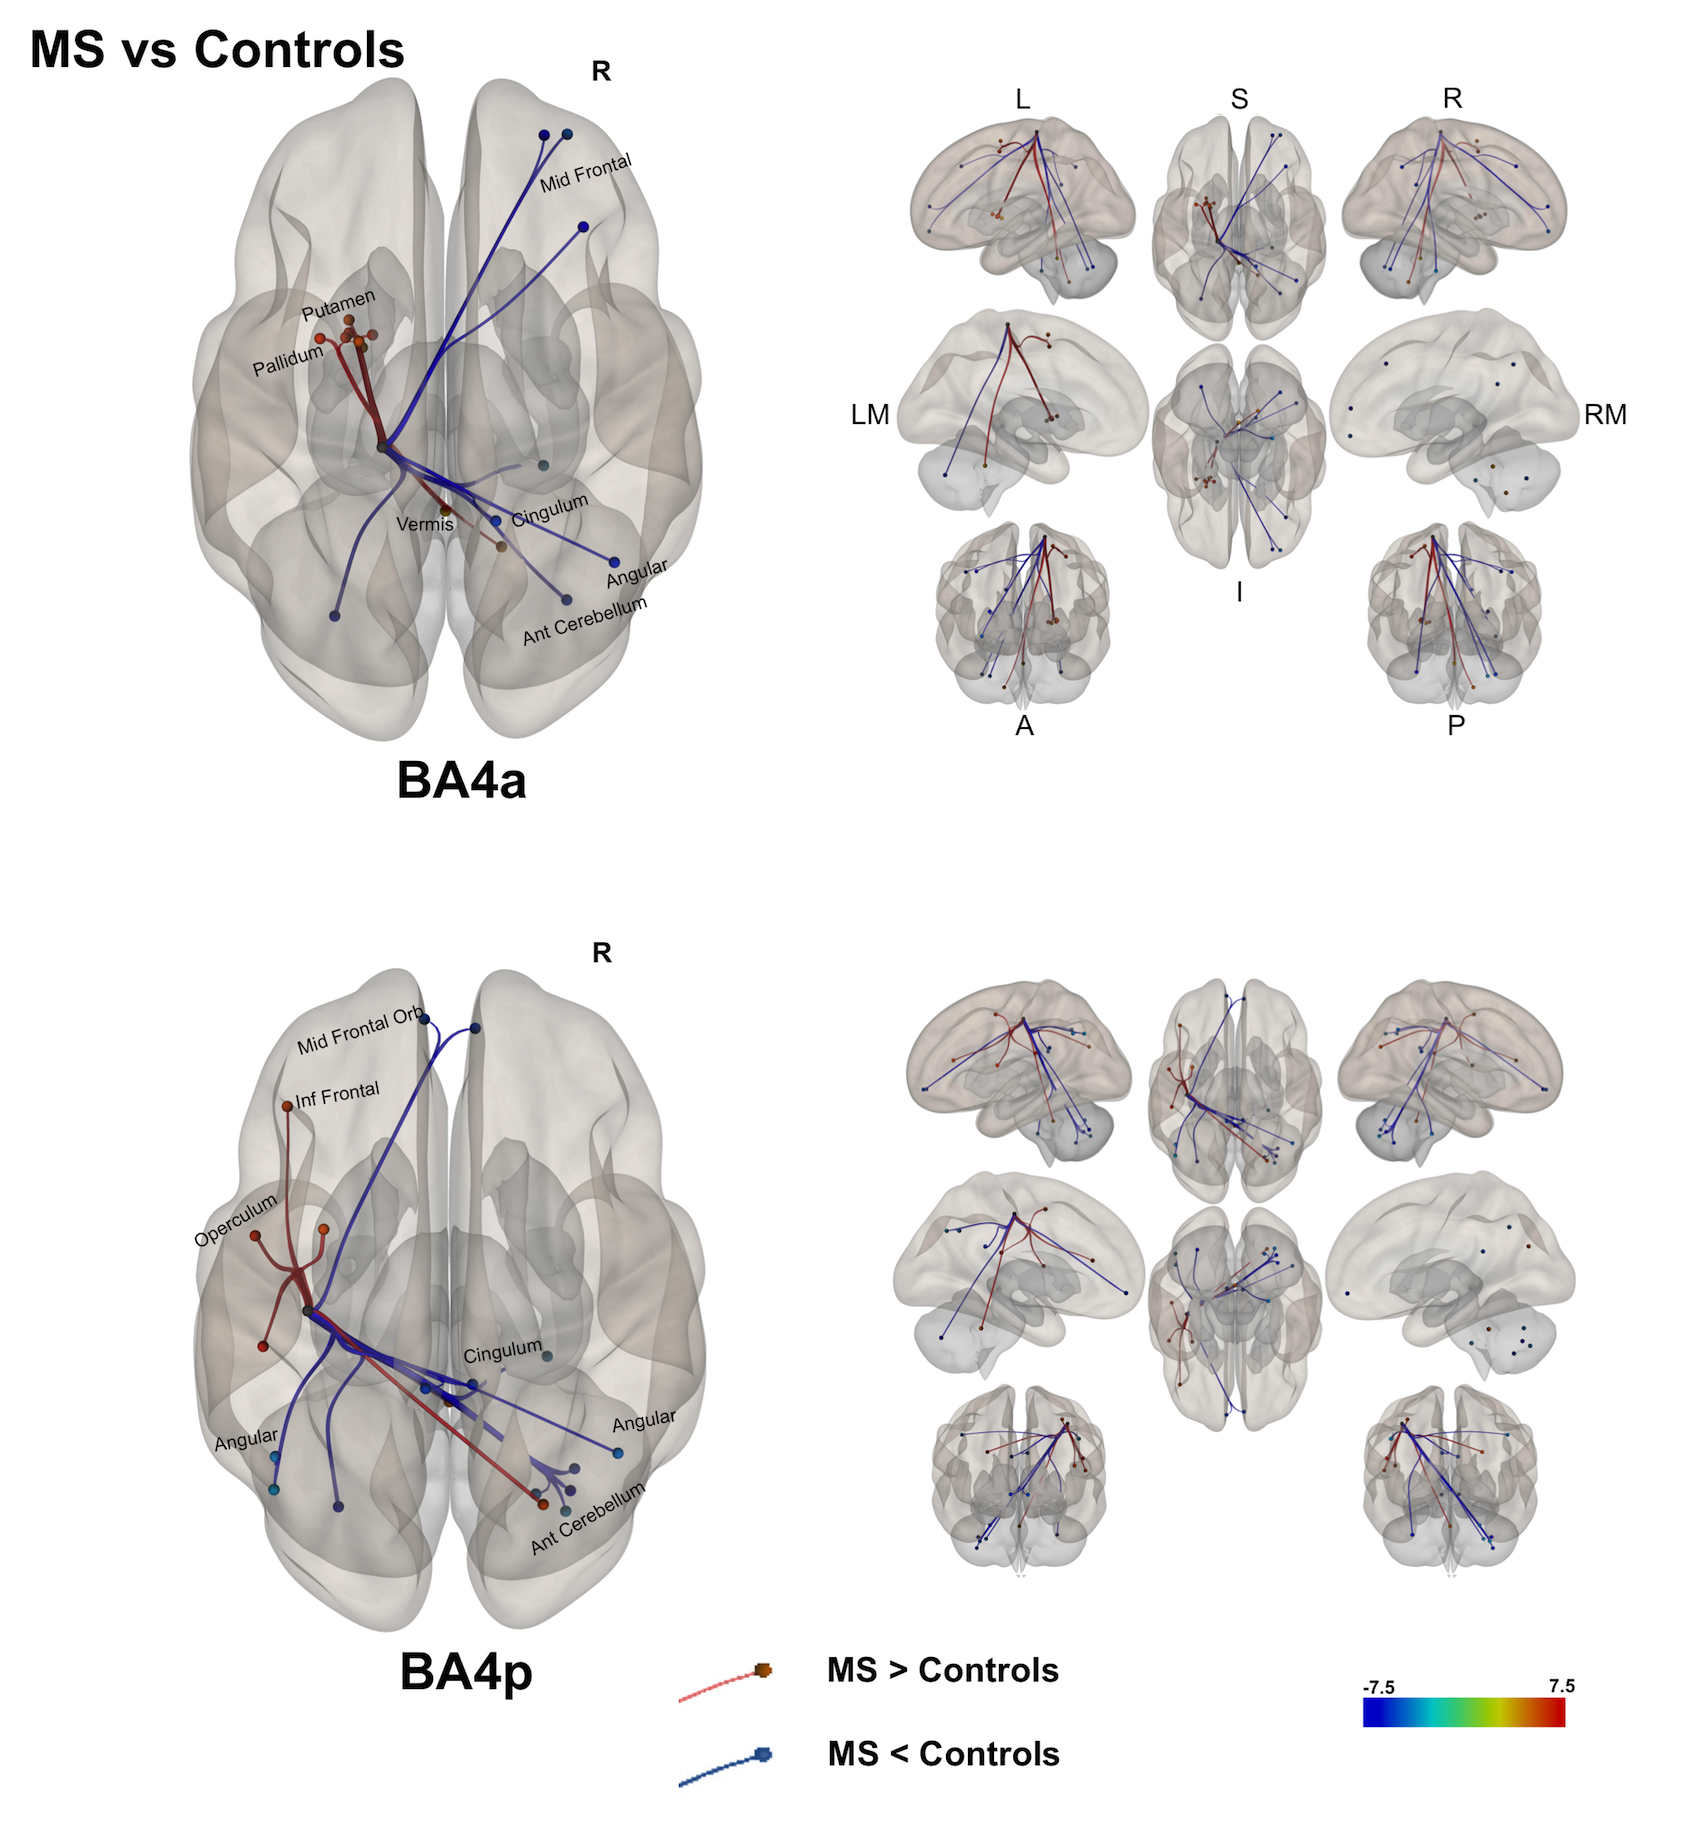
(2) A direct comparison of the networks in both groups [figure 4] showed that both BA4a/p sub-regions in MS have reduced FC to the right hemisphere. This was noticed in the cingulum, parietal and cerebellar areas. In the left hemisphere, MS exhibit higher FC than HS in motor and associative areas such as premotor cortex, cerebellum, inferior parietal and sub-cortical motor areas.
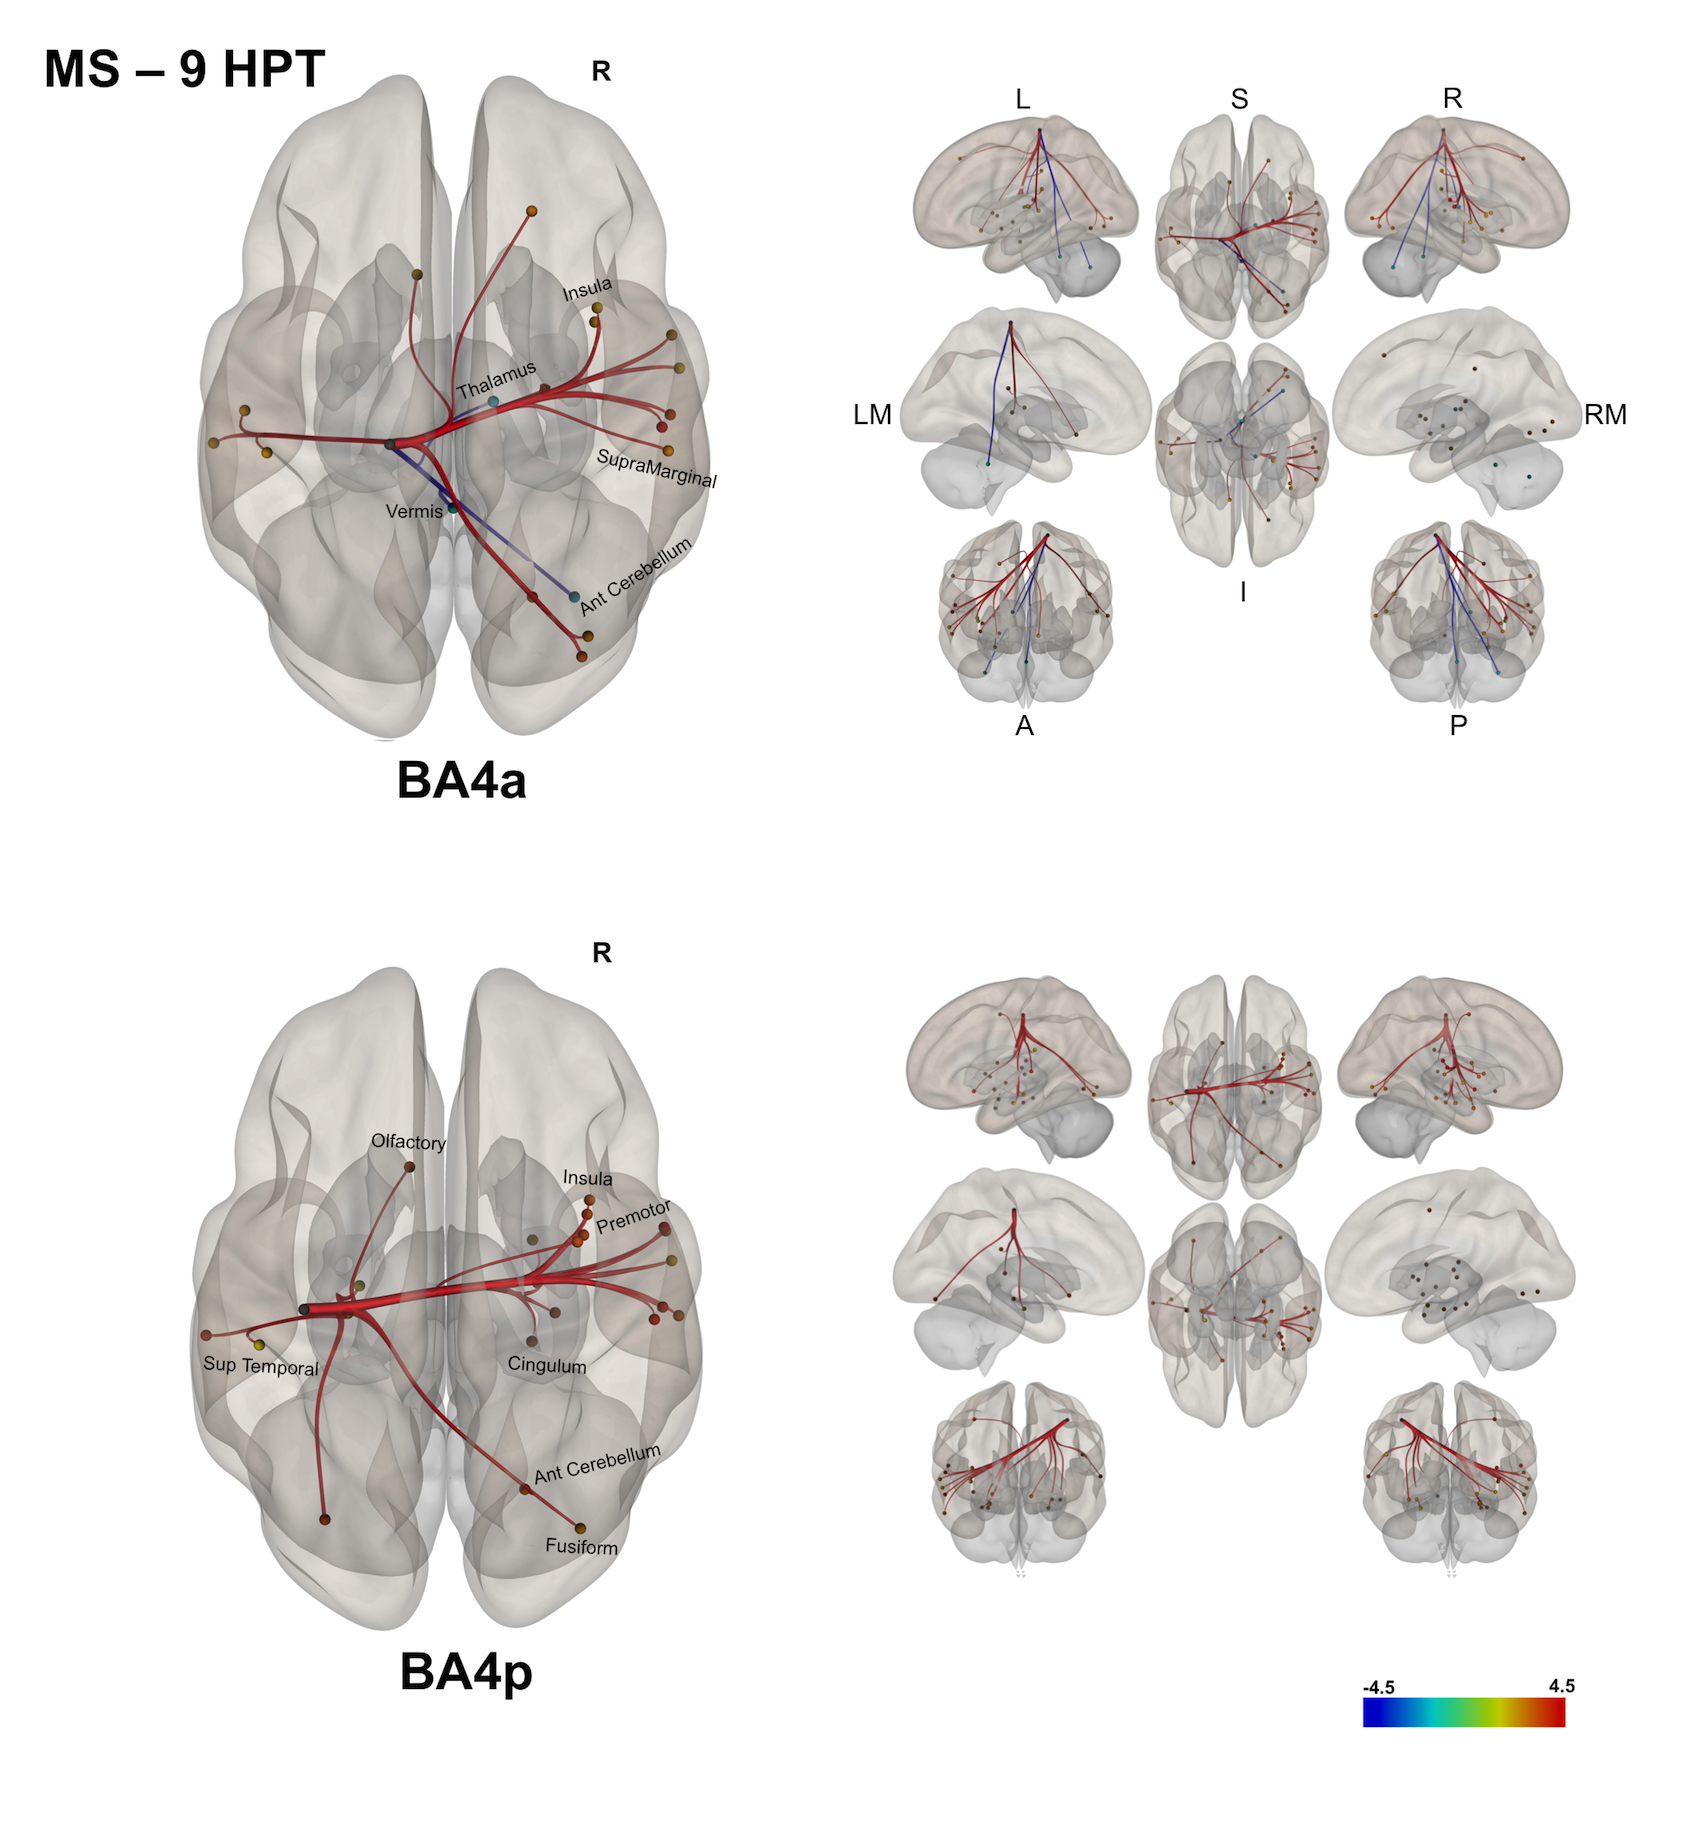
(3) In MS, exploring correlations of the FC with the 9-HPT [figure 5] showed: i) worse performance in the 9-HPT was associated with reduced FC of BA4a with the right anterior cerebellum and the right thalamus; ii) worse 9-HPT performance was also associated with greater FC (despite being reduced compared with HS) of BA4a/p with the right hemisphere.
Discussion and conclusions
In this work, we have shown FC networks characterising the anterior and posterior sub-divisions of BA4 in HS and MS. The observation that BA4p is mainly connected to associative and higher order functional areas while BA4a is connected to motor-related areas supports previous findings[2-6]. Additionally, it is interesting that the long range FC of either region to the rest of the brain, and in particular to the right (non-dominant) hemisphere is reduced or even lost in MS (possibly due to the frequent involvement of the corpus callosum in MS[24]), while there is an increased FC to more local left hemisphere regions compared to HS. At the same time, we demonstrated that the performance of a motor task requiring attention and coordination, such as the 9-HPT, correlates strongly with FC of BA4a to the anterior cerebellum (i.e. worse performance, worse FC), and with areas of the right and some of the left hemisphere in a counter-intuitive manner (i.e. worse performance, greater FC), indicating that the increased FC may not be a compensatory but rather a maladaptive mechanism of disease. Multi-modal protocols may enable the investigation of the pathophysiology of these changes, which could derive from axonal loss and demyelination, but also perfusion or synaptic activity impairment.Acknowledgements
MS society of the UK; National Institute for Health Research, University College London; AA was supported by KAU (Saudi Arabia), UKSACB and MOHE. MP was supported by the AKWO association, Lavagna (Italy). KJF was supported by the Wellcome trust.References
[1] Geyer S, Ledberg A, Schleicher A, et al. Two different areas within the primary motor cortex of man. 1996.
[2] Binkofski F, Fink GR, Geyer S, et al. Neural activity in human primary motor cortex areas 4a and 4p is modulated differentially by attention to action. J. Neurophysiol. 2002;88(1):514-519.
[3] Kuhtz-Buschbeck JP, Gilster R, Wolff S, et al. Brain activity is similar during precision and power gripping with light force: an fMRI study. Neuroimage. 2008;40(4):1469-1481.
[4] Sharma N, Jones PS, Carpenter TA, Baron JC. Mapping the involvement of BA 4a and 4p during Motor Imagery. Neuroimage. May 15 2008;41(1):92-99.
[5] Alahmadi AA, Samson RS, Gasston D, et al. Complex motor task associated with non-linear BOLD responses in cerebro-cortical areas and cerebellum. Brain Struct Funct. Jun 2016;221(5):2443-2458.
[6] Alahmadi AA, Pardini M, Samson RS, et al. Differential involvement of cortical and cerebellar areas using dominant and nondominant hands: An FMRI study. Hum. Brain Mapp. 2015;36(12):5079-5100.
[7] Whitfield-Gabrieli S, Nieto-Castanon A. Conn : A Functional Connectivity Toolbox for Correlated and Anticorrelated Brain Networks. Brain Connectivity. 2012;2(3):125-141.
[8] Friston KJ, Holmes AP, Worsley KJ, et al. Statistical parametric maps in functional imaging: a general linear approach. Hum. Brain Mapp. 1995;2:189-210.
[9] (https://www.nitrc.org/projects/artifact_detect/).
[10] Eickhoff SB, Stephan KE, Mohlberg H, et al. A new SPM toolbox for combining probabilistic cytoarchitectonic maps and functional imaging data. Neuroimage 2005;25(4):1325-35.
[11] Tzourio-Mazoyer N, Landeau B, Papathanassiou D, et al. Automated anatomical labeling of activations in SPM using a macroscopic anatomical parcellation of the MNI MRI single-subject brain. Neuroimage. 2002;15(1):273-289.
[12] Geyer S. The Microstructural Border Between the Motor and the Cognitive Domain in the Human Cerebral Cortex.: Springer, Wien; 2003.
[13] Geyer S, Schormann T, Mohlberg H, et al. Areas 3a, 3b, and 1 of human primary somatosensory cortex. Part 2. Spatial normalization to standard anatomical space. Neuroimage. 2000;11:684-696.
[14] Grefkes C, Geyer S, Schormann T, et al. Human somatosensory area 2: observer-independent cytoarchitectonic mapping, interindividual variability, and population map. Neuroimage. 2001;14(3):617-631.
[15] Eickhoff SB, Schleicher A, Zilles K, Amunts K. The human parietal operculum. I. Cytoarchitectonic mapping of subdivisions. Cereb. Cortex. 2006;16(2):254-267.
[16] Eickhoff SB, Amunts K, Mohlberg H, Zilles K. The human parietal operculum. II. Stereotaxic maps and correlation with functional imaging results. Cereb. Cortex. 2006;16(2):268-279.
[17] Eickhoff SB, Grefkes C, Zilles K, Fink GR. The somatotopic organization of cytoarchitectonic areas on the human parietal operculum. Cereb. Cortex. 2007;17(8):1800-1811.
[18] Choi HJ, Zilles K, Mohlberg H, et al. Cytoarchitectonic identification and probabilistic mapping of two distinct areas within the anterior ventral bank of the human intraparietal sulcus. J. Comp. Neurol. 2006;495(1):53-69.
[19] Scheperjans F, Hermann K, Eickhoff SB, et al. Observer-independent cytoarchitectonic mapping of the human superior parietal cortex. Cereb. Cortex. 2008;18(4):846-867.
[20] Scheperjans F, Eickhoff SB, Hömke L, et al. Probabilistic maps, morphometry, and variability of cytoarchitectonic areas in the human superior parietal cortex. Cereb. Cortex. 2008;18(9):2141-2157.
[21] Caspers S, Eickhoff SB, Geyer S, et al. The human inferior parietal lobule in stereotaxic space. Brain Struct Funct. 2008;212(6):481-495.
[22] Rottschy C, Eickhoff SB, Schleicher A, et al. Ventral visual cortex in humans: cytoarchitectonic mapping of two extrastriate areas. Hum. Brain Mapp. 2007;28(10):1045-1059.
[23] Malikovic A, Amunts K, Schleicher A, et al. Cytoarchitectonic analysis of the human extrastriate cortex in the region of V5/MT+: a probabilistic, stereotaxic map of area hOc5. Cereb. Cortex. 2007;17(3):562-574.
[24] Garg N, Reddel SW, Miller DH, et al. The corpus callosum in the diagnosis of multiple sclerosis and other CNS demyelinating and inflammatory diseases. J. Neurol. Neurosurg. Psychiatry. 2015:jnnp-2014-309649
Figures