2530
Thalamic involvement in neuromyelitis optica spectrum disorder: multicomponent relaxometry parameters and relationship with cognition1Neuroimaging, Institute of Psychiatry, Psychology & Neuroscience, King's College London, London, United Kingdom, 2Neurology, University of British Columbia, Vancouver, BC, Canada, 3Radiology, University of British Columbia, Vancouver, BC, Canada
Synopsis
Investigations into thalamus pathology, a known predictor of disease progression and cognitive impairment in multiple sclerosis, have yielded inconsistent results in neuromyelitis optica spectrum disorder. We found significant thalamic atrophy, but normal multicomponent relaxometry parameters in patients compared to healthy controls, providing further evidence that despite volume loss, microstructural alterations are likely subtle. Associations between MRI metrics (thalamic volume and T1 relaxation time, linked with changes in water content) and performance on two measures of information processing speed support the hypothesis that damage to the thalamus may be involved in cognitive impairment in this population.
Introduction
Neuromyelitis optica spectrum disorder (NMOSD) is a recurring inflammatory disease of the central nervous system affecting predominantly the optic nerves and spinal cord, although damage to the brain is being recognized as an important and clinically significant feature. The characterisation of brain pathology in NMOSD has mostly focused on the description of focal lesions, white matter abnormalities, and cortical pathology. Less is known about the nature and extent of damage to deep grey matter (DGM) structures. Thalamus pathology, and in particular volume loss, is a known predictor of disease progression in multiple sclerosis (MS), and linked to cognitive impairment. A limited number of studies have reported inconsistent evidence for both the presence1–4 and absence5–8 of atrophy and microstructural abnormalities in this structure in NMOSD. Here, we report measures of thalamic volume, as well as multicomponent relaxometry parameters relating to tissue microstructure, to investigate the presence and characteristics of thalamic pathology in a group of NMOSD subjects compared to healthy controls (HC). We also assess relationships between quantitative MRI metrics and cognitive scores in the NMOSD group.Methods
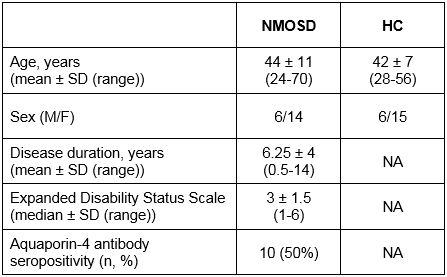
20 NMOSD subjects with no thalamic lesions, as assessed on clinical FLAIR and T2-weighted scans, and 21 age- and gender-matched HC were included (Table 1). Participants were scanned on a 3.0T MRI scanner using a multicomponent Driven Equilibrium Single Pulse Observation of T1 & T2 (mcDESPOT) protocol9 with 1.7 mm3 isotropic voxel size. Voxelwise mcDESPOT analysis yielded a number of parameters, of which we report single-component T1 relaxation time, and the myelin water fraction (fM) derived from a three-pool model10. Thalamic segmentation was performed on a T1-weighted spoiled gradient recalled echo (SPGR) scan using FIRST, and the obtained volumes were normalized for intracranial volume using a scaling factor derived using SIENAX, both part of FMRIB’s Software Library11. Regions of interest (ROIs) were created in the left and right thalamus; mean values were obtained within each ROI, and averaged for each subject. A subset of NMOSD participants underwent cognitive evaluation, including the Symbol Digit Modalities Test (SDMT) (n=14) and the Trail Making Test (TMT) (n=12), two sensitive measures of information processing speed, independent of education level12,13. Group comparisons between MRI metrics were performed using Student’s t‑test, and relationships with cognitive scores in the NMOSD group were assessed using partial correlation analysis with and without age as a covariate.Results
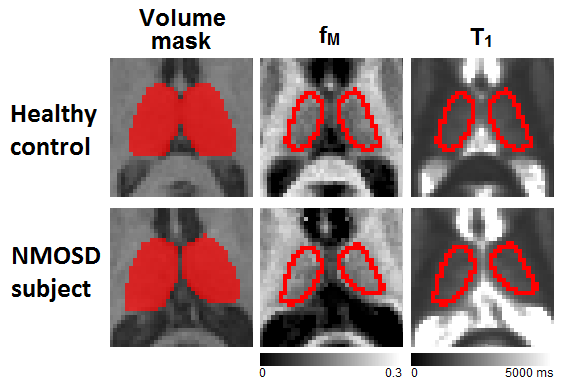
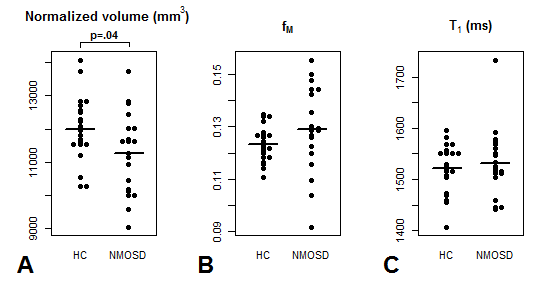
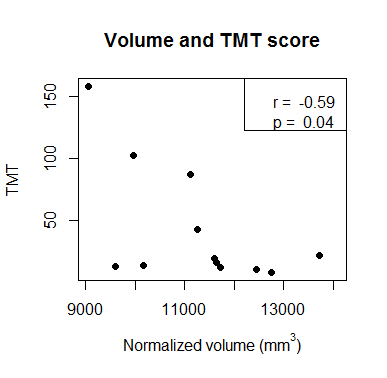
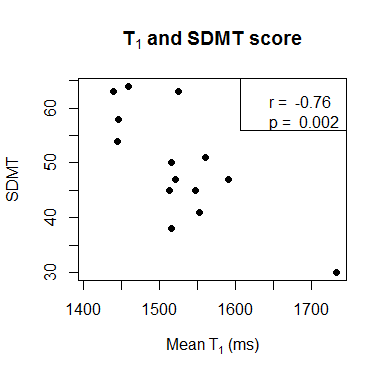
Example ROIs and parameter maps are shown in Figure 1. The NMOSD group had significantly lower normalized thalamic volume compared to HC (-6.2%, p=.04). There were no group differences between NMOSD and HC for T1 (+0.6% longer in NMOSD than HC, p=.6) or fM (+4.7% higher in NMOSD than HC, p=.1) (Figure 2). In the NMOSD group, thalamic volume was inversely correlated with TMT score (r=-0.59, p=.04) (Figure 3), and T1 was related to SDMT score (r=-0.76, p=.002) (Figure 4). When controlling for age, the correlation between thalamic volume and TMT was reduced to a trend (r=-0.55, p=.08), while the relationship between T1 and SDMT remained highly significant (r=-0.76, p=.003).Discussion
Thalamic atrophy has been an inconsistent finding in previous studies of NMOSD. Our results in a Canadian group of mixed ethnicity and aquaporin-4 antibody status confirm that volume loss is found in some cohorts. Quantitative relaxometry parameters were normal in this group when compared to HC. One study found abnormal diffusion metrics in the thalamus of NMOSD subjects (high fractional anisotropy and low mean diffusivity) which, surprisingly, were consistent with increased myelination14, although this has not been consistently replicated4,7. Our findings of statistically comparable fM between HC and NMOSD do not directly support this hypothesis; however, the high inter-individual variance in the NMOSD group suggests that heterogeneous processes may be at play regarding myelination of DGM structures. Other hypotheses should also be explored, such as alterations in water content that would be consistent with NMOSD pathophysiology, and may explain the strong relationship observed between T1 and one of the cognitive scores employed here. Associations between thalamic atrophy and cognitive scores have been previously reported1,3, and our results provide further evidence that this structure may be linked with cognitive impairment in NMOSD.Conclusion
We found significant thalamic volume loss in an NMOSD group compared to matched controls, but no evidence of microstructural abnormalities assessed via multicomponent relaxometry. Our results provide complementary evidence that tissue integrity may be preserved or only subject to subtle alterations in this group. Relationships between MRI metrics and two cognitive scores suggest that further explorations into the link between thalamus pathology and cognitive impairment in NMOSD may be of interest.Acknowledgements
We thank all study participants and the UBC MRI technologists for their contributions to this project, and are grateful to the Diamond Family Foundation for their support.
References
1. Blanc F, Noblet V, Jung B, et al. White matter atrophy and cognitive dysfunctions in neuromyelitis optica. PLoS ONE. 2012;7(4).
2. Chanson J-B, Lamy J, Rousseau F, et al. White matter volume is decreased in the brain of patients with neuromyelitis optica. European Journal of Neurology. 2013;20(2):361–7.
3. Wang Q, Zhang N, Qin W, et al. Gray Matter Volume Reduction Is Associated with Cognitive Impairment in Neuromyelitis Optica. AJNR. American journal of neuroradiology. 2015;36(10):1822–9.
4. Liu Y, Duan Y, Huang J, et al. Multimodal Quantitative MR Imaging of the Thalamus in Multiple Sclerosis and Neuromyelitis Optica. Radiology. 2015;277(3):784–792.
5. Duan Y, Liu Y, Liang P, et al. Comparison of grey matter atrophy between patients with neuromyelitis optica and multiple sclerosis: a voxel-based morphometry study. European journal of radiology. 2012;81(2):e110-4.
6. Matthews L, Kolind S, Brazier A, et al. Imaging Surrogates of Disease Activity in Neuromyelitis Optica Allow Distinction from Multiple Sclerosis. PloS one. 2015;10(9):e0137715.
7. Finke C, Heine J, Pache F, et al. Normal volumes and microstructural integrity of deep gray matter structures in AQP4+ NMOSD. Neurology: Neuroimmunology & Neuroinflammation. 2016;3(3):e229–e229.
8. Pache F, Zimmermann H, Finke C, et al. Brain parenchymal damage in neuromyelitis optica spectrum disorder – A multimodal MRI study. European Radiology. 2016:1–10.
9. Deoni S, Rutt B. Gleaning multicomponent T1 and T2 information from steady-state imaging data. Magnetic Resonance in Medicine. 2008;60(6):1372–87.
10. Deoni SCL, Matthews L, Kolind SH. One component? Two components? Three? the effect of including a nonexchanging “free” water component in multicomponent driven equilibrium single pulse observation of T1 and T2. Magnetic Resonance in Medicine. 2013;70(1):147–154.
11. Smith SM, Jenkinson M, Woolrich MW, et al. Advances in functional and structural MR image analysis and implementation as FSL. NeuroImage. 2004;23 Suppl 1:S208-19.
12. Drane DL, Yuspeh RL, Huthwaite JS, et al. Demographic characteristics and normative observations for derived-trail making test indices. Neuropsychiatry, neuropsychology, and behavioral neurology. 2002;15(1):39–43.
13. Sheridan LK, Fitzgerald HE, Adams KM, et al. Normative Symbol Digit Modalities Test performance in a community-based sample. Archives of Clinical Neuropsychology. 2006;21(1):23–28.
14. Zhao DD, Zhou HY, Wu QZ, et al. Diffusion tensor imaging characterization of occult brain damage in relapsing neuromyelitis optica using 3.0T magnetic resonance imaging techniques. NeuroImage. 2012;59(4):3173–3177.
Figures