2529
A New Iterative GPU Algorithm to Segment MS Lesions in Multi-spectral MRI Datasets1Biomedical Informatics, Arizona State University, Scottsdale, AZ, United States, 2Radiology, Mayo Clinic, AZ, United States, 3Neurology, Mayo Clinic, AZ, United States, 4Research, Mayo Clinic, AZ, United States
Synopsis
This paper presents a new method to segment MS lesions in multi-spectral MRI exams. Our approach leverages the speed of a GPU level set algorithm and a new data term to perform multiple segmentations of brain white matter in each exam. Differences between these segmentations allow us to estimate the distribution of MS lesions. We evaluated our method on BrainWeb and MS Lesion Segmentation Challenge 2008 data. It achieved results comparable to, or better than, two top performing algorithms. The average time required by our algorithm for Challenge08 data was 20.8 seconds.
Introduction
Multiple sclerosis (MS) is a chronic inflammatory demyelinating disease of the central nervous system (CNS). Magnetic resonance imaging (MRI) is widely used to diagnose MS and evaluate disease activity over time. Focal MS white matter lesions typically appear hyperintense on T2 weighted (T2w) and fluid-attenuated inversion recovery (FLAIR) T2 MRIs, and isointense or hypointense on non-contrast enhanced T1 weighted (T1w) MRIs. Such lesions can be visually distinguished from surrounding “normal-appearing white matter” (NAWM).
Accurate and reproducible quantitative measurement of Multiple sclerosis (MS) lesion volumes aids disease tracking, therapeutic assessment, and cognitive research. However, segmentation of MS lesions is generally quite difficult due to their highly variable size, distribution, and intensity patterns.
We presents a new method to segment MS lesions in multi-spectral MRI exams. Our approach leverages the speed of a GPU level set algorithm to perform multiple segmentations of brain white matter in each exam [1]. Differences between these segmentations allow us to estimate the distribution of MS lesions. A new data term in the level set speed function eliminates the need to store MRI exams on the GPU memory [2]. This allows multi-spectral MRI exams that are too large to fit on the GPU to be processed efficiently.
Methods
Since the time penalty for segmentation with our GPU level set is small, multiple segmentations of large regions in a single neurological MRI dataset are possible in a clinically practical time frame. We leverage this to repeatedly segment the total WM volume, while varying the level set initialization parameters between iterations.
We begin by segmenting all white matter (AWM, including NAWM and MS lesions). Then, through successive iterations, we adjust the initialization parameters to constrain the segmentation towards NAWM alone. Differences between these repeated segmentations allow us to estimate the spatial distribution of MS lesions. In theory, the more segmentations we perform, the better our estimate will become. Here, as a proof of concept, we perform only two segmentations of WM - the minimum possible with our scheme.
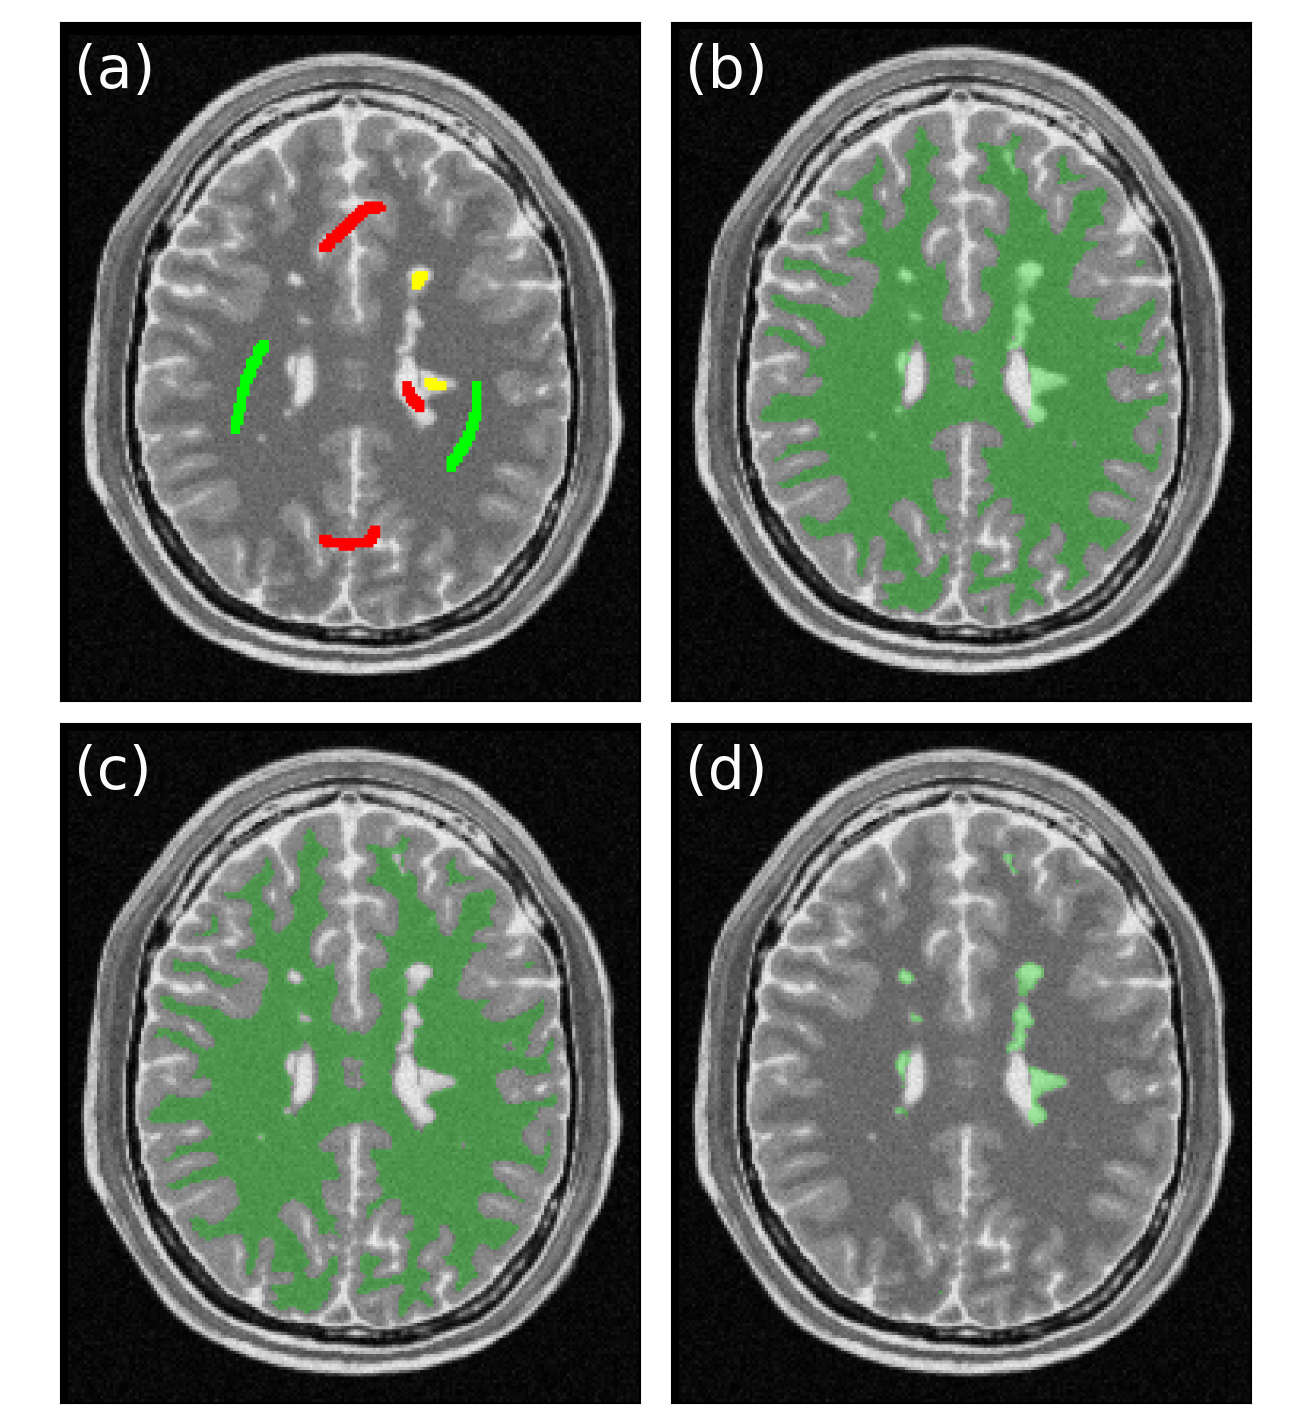
To accomplish this, we introduce a new workflow that requires the user to label seed points for three tissues (Fig. 1a): 1) NAWM (green), 2) other brain regions (gray matter and CSF, red), and 3) one or more MS lesions (yellow). Using these three clusters of seed voxels, our method performs two separate segmentations. The first is to extract AWM (Fig. 1b), and the second is to extract NAWM (Fig. 1c). We estimate the MS lesion region as the difference between AWM and NAWM (Fig. 1d).
Experimental design: We evaluated our method on two public, freely available MS lesion datasets: the BrainWeb synthetic phantom data [3], and the 2008 MS Lesion Segmentation Challenge data (Challenge08) [4].
Results
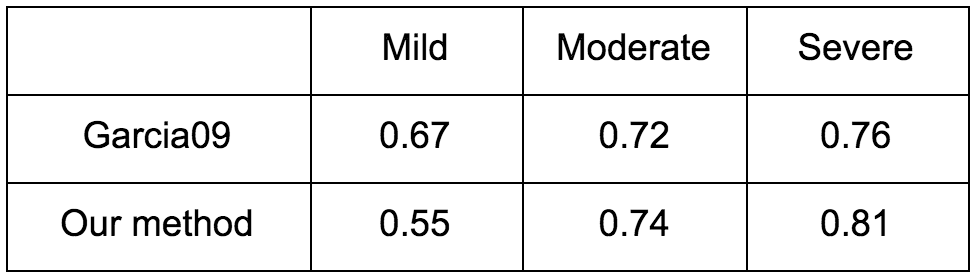
BrainWeb phantoms: The dice coefficient (DSC) of our method is presented and compared to [5]. Our method had a lower DSC on MRIs with mild lesion load, but a higher DSC on cases with moderate and severe lesion load (Table 1).
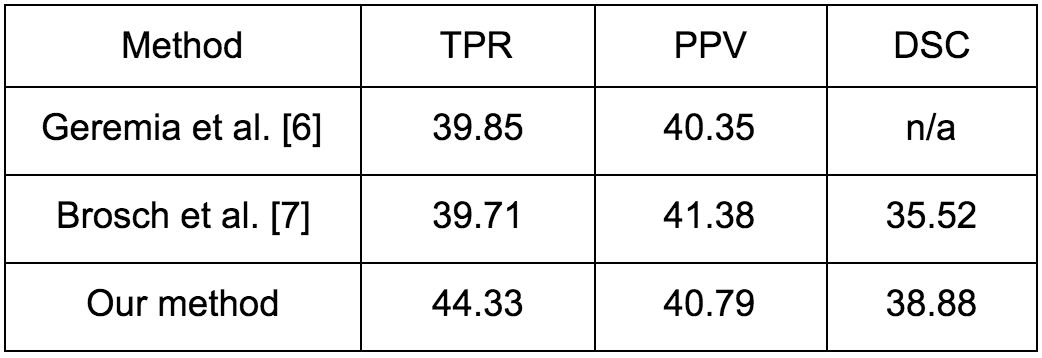
Patient images: Results from the algorithm evaluation are shown in Table 2, and compared to published results from two leading algorithms [6, 7]. Our algorithm had a higher true positive rate (TPR) and DSC than the comparison algorithms, and a positive prediction value (PPV) nearly half way between these algorithms. The average execution time for our algorithm to segment lesions in Challenge08 data was 20.8 seconds.
Conclusion
The proposed method was evaluated on BrainWeb and Challenge08 data and achieved results comparable to, or better than, two leading algorithms. The average execution time for our algorithm to segment lesions in Challenge08 data was 20.8 seconds. Current limitations include the need for a user to seed three regions in each exam: NAWM; GM and CSF (major brain anatomy); and, one or more MS lesions. Future work will focus on automating the seed placement step using statistical and/or atlas-based co-registration approaches. Finally, better post-processing methods may reduce false positive lesions.Acknowledgements
No acknowledgement found.References
[1] Roberts, M., Packer, J., Sousa, M. C., & Mitchell, J. R. (2010). A work-efficient GPU algorithm for level set segmentation. Proceedings of the Conference on High Performance Graphics. CPAPER, Saarbrucken, Germany: Eurographics Association.
[2] Xue, Wenzhe, Christine Zwart, and Joseph Ross Mitchell. "Intelligent Initialization and Interactivity: Optimizing Level Sets for T1-weighted White Matter Segmentation."
[3] Cocosco, C. A., Kollokian, V., Kwan, R. K.-S., Pike, G. B., & Evans, A. C. (1997). Brainweb: Online interface to a 3D MRI simulated brain database. In NeuroImage.
[4] Styner, M., Lee, J., Chin, B., & Chin, M. (2008). 3D segmentation in the clinic: A grand challenge II: MS lesion segmentation. MIDAS, 1–6.
[5] García-Lorenzo, D., Lecoeur, J., Arnold, D. L., Collins, D. L., & Barillot, C. (2009). Multiple sclerosis lesion segmentation using an automatic multimodal graph cuts. Medical Image Computing and Computer-Assisted Intervention--MICCAI 2012, 584–91.
[6] Geremia, E., Clatz, O., Menze, B. H., Konukoglu, E., Criminisi, A., & Ayache, N. (2011). Spatial decision forests for MS lesion segmentation in multi-channel magnetic resonance images. NeuroImage, 57(2), 378–90.
[7] Brosch, T., Yoo, Y., Tang, L. Y., Li, D. K., Traboulsee, A., & Tam, R. (2015). Deep Convolutional Encoder Networks for Multiple Sclerosis Lesion Segmentation. Medical Image Computing and Computer-Assisted Intervention--MICCAI 2015, 3–11.
Figures