2528
Inhomogeneous Magnetization Transfer (ihMT) in normal-appearing tissue correlates with clinical EDSS score of MS patients.1Aix-Marseille Univ, CNRS, CRMBM UMR 7339, Marseille, France, 2Radiology, Division of MR Research, Beth Israel Deaconess Medical Center, Harvard Medical School, Boston, MA, United States, 3Aix Marseille Univ, APHM, Hôpital La Timone, Pôle de Neurosciences Cliniques, Service de Neurologie, Marseille, France
Synopsis
The present study was aimed at evaluating the potential of ihMT (inhomogeneous Magnetization transfer) contrast in characterizing the severity of MS disease, and investigating possible correlations between ihMT and the clinical disability score.
Purpose:
Multiple sclerosis (MS) is an autoimmune inflammatory disease that causes demyelination of the central nervous system, therefore in vivo myelin imaging should be a key factor in the characterization of the disease and evaluation of therapeutic strategies. Unfortunately, anatomic MRI cannot image directly myelin protons and current advanced MR techniques (e.g. MWF (1), MT/qMT (2)), although promising, may suffer from a lack of specificity or are challenged by technical issues, preventing precise characterization of the pathology (3). Inhomogeneous Magnetization Transfer (ihMT) MRI (4), a technique believed to be able to selectively isolate the MT effects of structured lipid membranes such as those found in myelin, has recently been proposed as a putative myelin-specific technique and preliminary studies have demonstrated sensitivity for MS (5,6). The present study was aimed at evaluating the potential of ihMT contrast in characterizing the severity of the disease, and investigating possible correlations between ihMT and the clinical disability score.Methods:
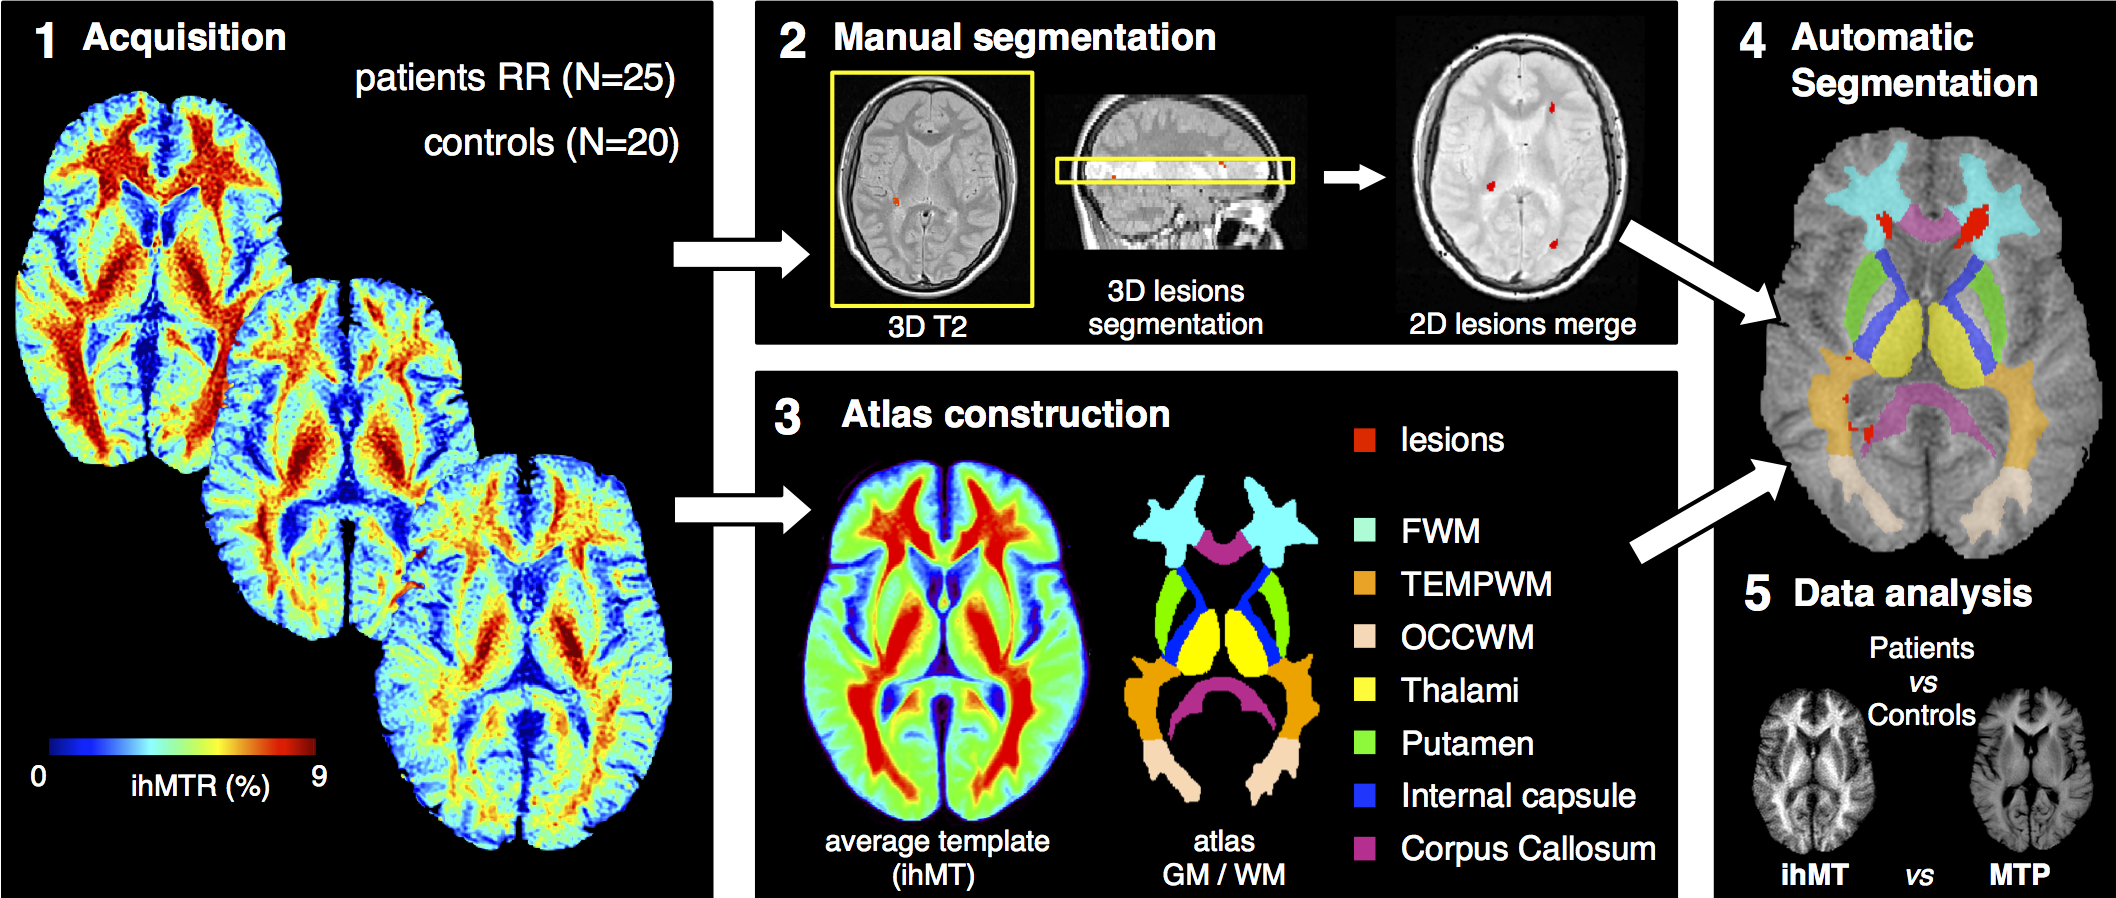
25 relapsing-remitting (RR) MS patients (mean age 41 years, EDSS 0-6.5) and 20 sex- and age-matched control subjects were scanned at 1.5T (Avanto MRI, Siemens, Erlangen, Germany) with the following imaging protocol: anatomical 3D-T1w and 2D multislice (n=44, thickness 3mm) axial T2w for lesion segmentation, and ihMT obtained with a pulsed saturation preparation module (Δf=7kHz, Hann-shaped pulses (PW=0.5ms), pulse repetition time Δt=1ms, total saturation τ=700ms, Energy of saturation Etr=35μT2.s) combined with a 2D HASTE (20 NEX) single-slice (9mm) readout (7). The ihMT images were derived from the subtraction of MT images obtained with simultaneous saturation at positive and negative frequency offsets (MTpm) from those obtained with single frequency saturation (MTp) at the same total RF power as described in (7).
Image Processing (Fig. 1): step 1, generation of ihMT/MT ratio maps defined as ihMTR = ihMT/S0 and MTR=1-MTp/S0, with S0 the signal measured without RF saturation; step 2, for each MS patient, lesions were manually segmented in the 3-mm slices of the T2w image corresponding to the 9-mm ihMT slice (yellow box) and further merged in order to create a lesion mask in the 9-mm ihMT slice space; step 3, an ihMT atlas with 7 ROIs manually segmented (FSLview, FMRIB Software Library) on an ihMT average template created upon control/patient ihMT images database using iterative nonlinear normalization (8) and realignment of images into a new common reference space was constructed; step 4, projection of the ihMT atlas and the lesion mask in the reference space of each individual subject (patients/controls) for automatic segmentation of normal appearing (NA) frontal, occipital and temporal WM, internal capsules and corpus callosum, thalamus and putamen, where quantitative ihMTR/MTR values were analyzed (step 5). Note that the large slice thickness of the ihMT images induced partial volume effects preventing accurate measurement in other finer structures.
Statistics: All statistical analyses were performed using JMP9 software. Correlations between the EDSS score and the ihMTR/MTR values in NA tissues were evaluated using statistical non-parametric Spearman’s rank correlation coefficient.
Results:
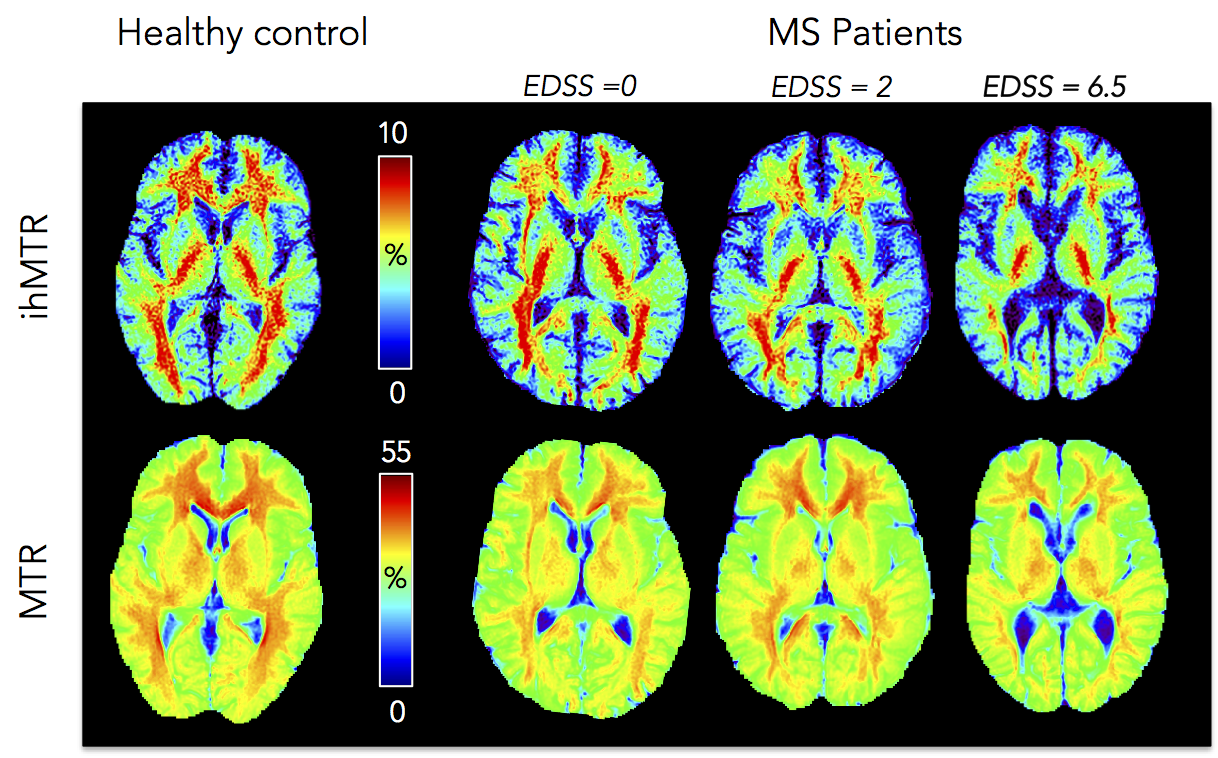
Fig. 2 shows examples of ihMTR/MTR maps obtained for
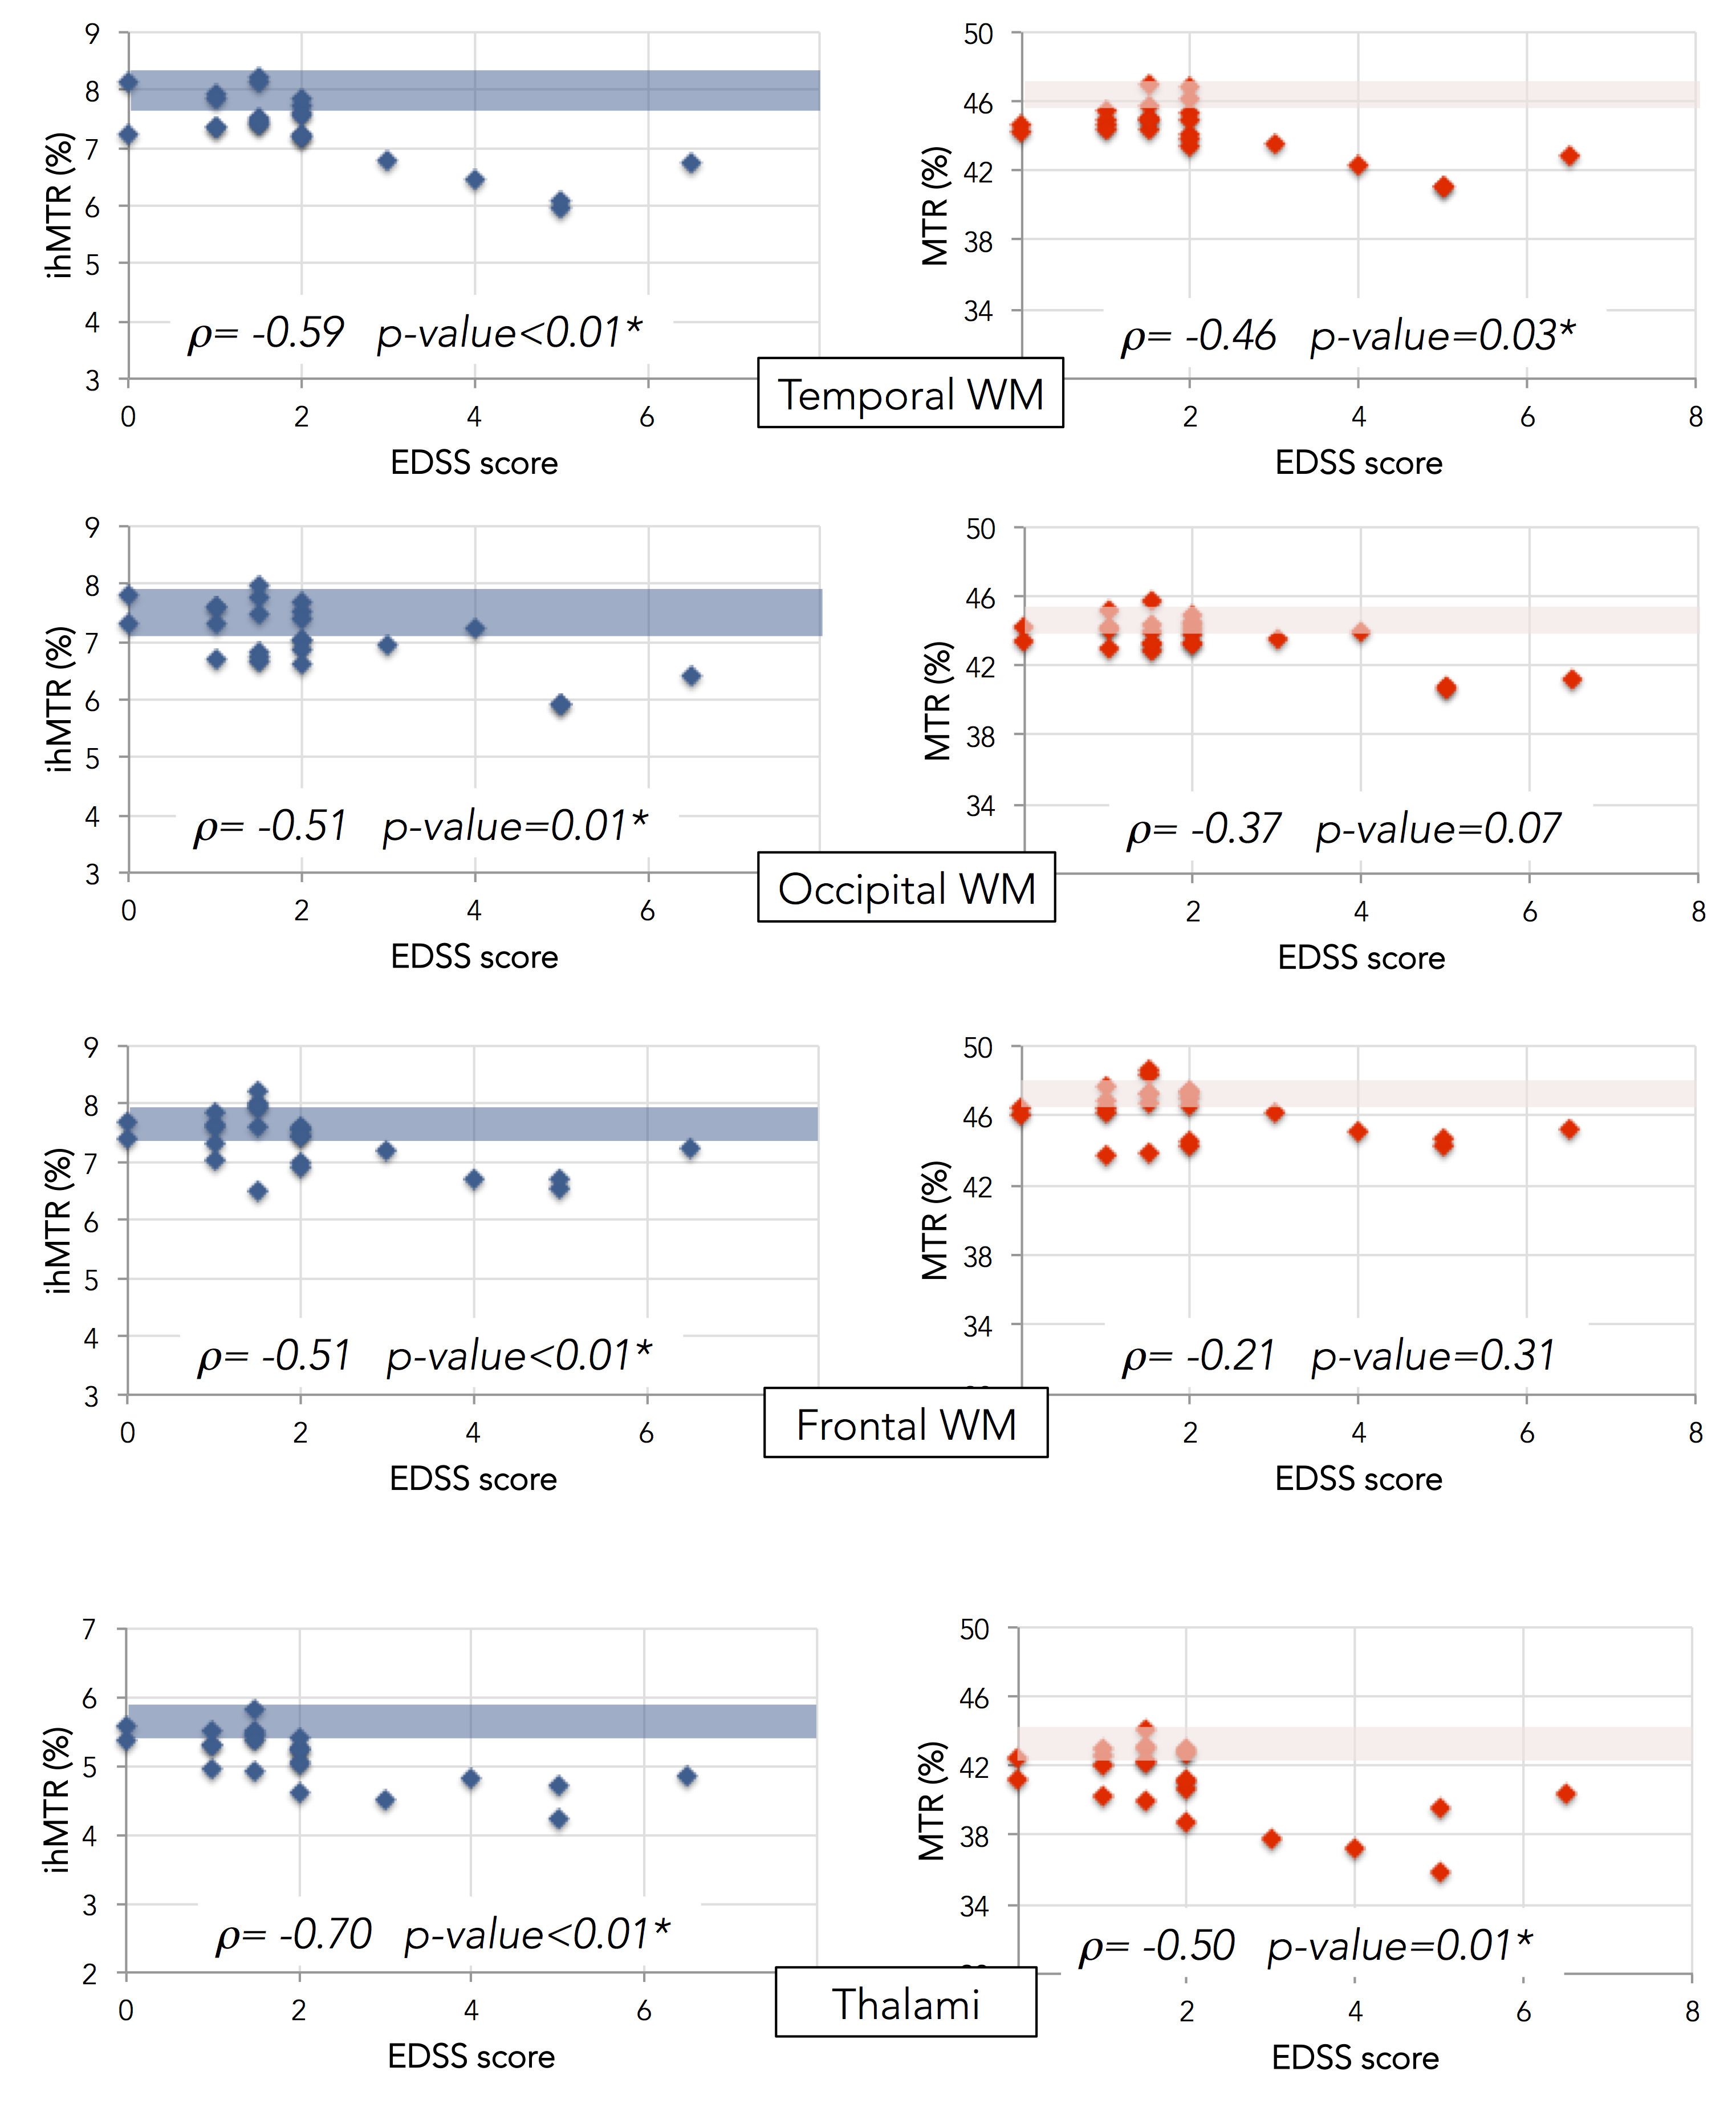
control and MS patients and Fig. 3 shows plots of ihMTR/MTR as a function of
EDSS in different brain structures. With regards to correlations with EDSS,
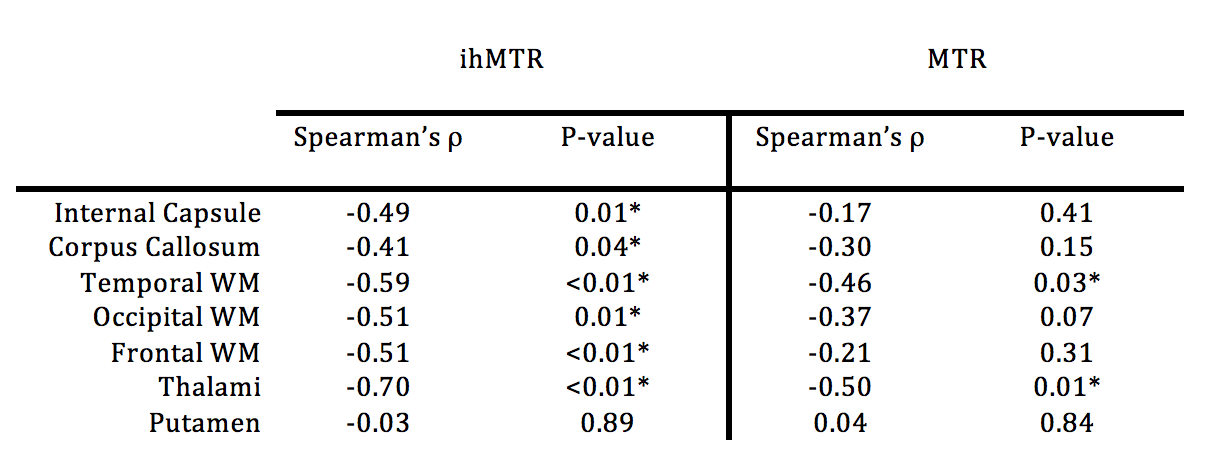
differences between ihMTR and MTR were noticed (table 1). Negative significant (p<0.05) correlations between ihMTR and
EDSS were found in all investigated NA tissue with the exception of putamen. Conversely, weaker correlations, significant in
thalami and temporal WM only were found for MTR. Discussion:
Whereas both ihMTR and MTR are sensitive to MS disease with lower ratios found in patients compared to controls (Figs. 2, 3), this study reveals an improved ability of ihMT to discriminate patients, as illustrated by the significant relationship between the clinical disability and ihMTR values in NA tissues. With regards to MTR results, the negative correlation by trend with EDSS, significant in thalami and temporal WM only is in line with other contrasted reported findings (e.g. disability in MS related to NA tissue MTR histogram abnormalities (9) or the opposite (10)), which were explained by the combination of MS tissue abnormalities (oedema, inflammation, microglial activity, demyelination) being responsible of MTR variations. Conversely, due to the presumably higher specificity of ihMT for myelinated tissues, pathological mechanisms other than demyelination did not confound ihMTR variations, which univocally demonstrated significant decrease with increasing EDSS. Further studies will investigate whole brain MS patient ihMT analyses at different stages of the disease to refine assessment of myelin status and relate it to the clinical state.Acknowledgements
ARSEP foundation 2015References
1. MacKay A, Whittall K, Adler J, Li D, Paty D, Graeb D. In vivo visualization of myelin water in brain by magnetic resonance. Magn. Reson. Med. Off. J. Soc. Magn. Reson. Med. Soc. Magn. Reson. Med. 1994;31:673–677.
2. Sled JG, Pike GB. Quantitative imaging of magnetization transfer exchange and relaxation properties in vivo using MRI. Magn. Reson. Med. 2001;46:923–931.
3. Alonso-Ortiz E, Levesque IR, Pike GB. MRI-based myelin water imaging: A technical review. Magn. Reson. Med. 2015;73:70–81. doi: 10.1002/mrm.25198.
4. Varma G, Duhamel G, de Bazelaire C, Alsop DC. Magnetization transfer from inhomogeneously broadened lines: A potential marker for myelin: Magn. Reson. Med. 2015;73:614–622. doi: 10.1002/mrm.25174.
5. Varma G, Neema M, Papadopoulou F, Tauhid S, Bakshi R, Alsop DC. Analysis of inhomogeneous magentization transfer applied in patients with multiple sclerosis. In: International Society for Magnetic Resonance in Medicine. Milan, Italy; 2014. p. 2071.
6. Duhamel G, Le Troter A, Prevost V, Varma G, Guye M, Ranjeva J-P, Pelletier J, Alsop DC, Girard OM. Magnetization Transfer from Inhomogeneously Broadened Lines (ihMT): Application on Multiple Sclerosis (MS). In: International Society for Magnetic Resonance in Medicine. Vol. 23. Toronto, Canada; 2015. p. 4346.
7. Girard OM, Prevost VH, Varma G, Cozzone PJ, Alsop DC, Duhamel G. Magnetization transfer from inhomogeneously broadened lines (ihMT): Experimental optimization of saturation parameters for human brain imaging at 1.5 Tesla. Magn. Reson. Med. 2015;73:2111–21. doi: 10.1002/mrm.25330.
8. Avants BB, Yushkevich P, Pluta J, Minkoff D, Korczykowski M, Detre J, Gee JC. The optimal template effect in hippocampus studies of diseased populations. NeuroImage 2010;49:2457–2466. doi: 10.1016/j.neuroimage.2009.09.062.
9. Traboulsee A, Dehmeshki J, Peters KR, et al. Disability in multiple sclerosis is related to normal appearing brain tissue MTR histogram abnormalities. Mult. Scler. 2003;9:566–573. doi: 10.1191/1352458503ms958oa.
10. Amann M, Papadopoulou A, Andelova M, et al. Magnetization transfer ratio in lesions rather than normal-appearing brain relates to disability in patients with multiple sclerosis. J. Neurol. 2015;262:1909–1917. doi: 10.1007/s00415-015-7793-5.
Figures