2525
Gradient and Spin Echo (GRASE) as an Alternative to Multi Echo Spin Echo (MESE) acquisition for Myelin Water Fraction Imaging1Radiology, University of Pennsylvania, Philadelphia, PA, United States, 2Klinik und Poliklinik für Neuroradiologische Diagnostik und Intervention, Universitätsklinikum Hamburg-Eppendorf, Hamburg, Germany
Synopsis
Problem: The clinical utility of myelin water fraction (MWF) mapping based on multi-echo-spin-echo (MESE) T2-relaxometry is prohibitively slow (~90-120 minutes for acquisition matrix 128x128x50; TR 3s). MWF-values from T2-prep based approach and mcDESPOT (Multicomponent-driven-equilibrium-single-pulse-observation-of-T1-and-T2) matches poorly with MESE based quantification.
Methods: We compare GRASE (Gradient-and-Spin-Echo) based MWF quantifications against those from MESE and compare our algorithm against current state of the art. 3D non-selective GRASE, MESE were optimized. Implemented post-processing method utilizes spatial correlations in 3D local neighborhoods to improve noise stability, while simultaneously accounting for stimulated echo contributions.
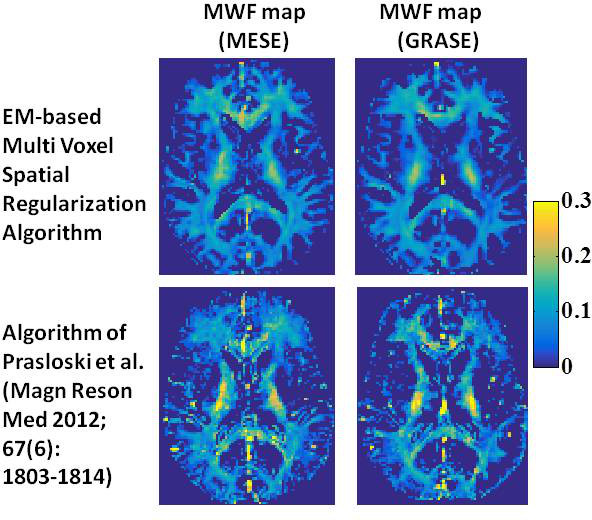
Results & Conclusions: Results demonstrate good consistency between both sequences.
INTRODUCTION
The clinical utility of myelin water fraction (MWF) mapping based multi-echo-spin-echo (MESE) T2-relaxometry is impeded due to prohibitively slow scan time, needing ~60-90 minutes for whole brain coverage (matrix 128x128x50; TR 3 sec). There are alternative clinical feasible methods to measure MWF-maps, such as T2-prep based approach and mcDESPOT (Multicomponent-driven-equilibrium-single-pulse-observation-of-T1-and-T2), though they do not show good correspondence with MESE based MWF-quantification1-5. The purpose of this study is to evaluate the effect of filling up outer k-space using gradient echoes on MWF-quantification in GRASE (gradient and spin echo) based quantifications. ROI-averaged MWF-values extracted using 3D non-selective GRASE have been shown to correspond very well with corresponding values from 3D non-selective MESE6; those voxelwise match appear less consistent.
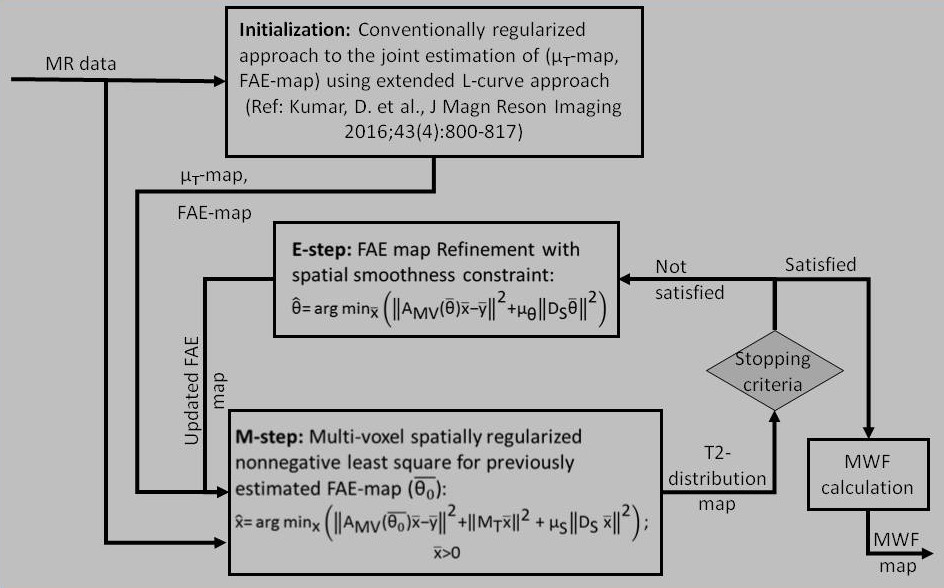
We have recently proposed an expectation-maximization (EM) based algorithm (submitted in another abstract; also refer to Fig 1 for flow chart), which utilizes the local spatial correlation in 3 dimensional neighborhood to improve noise stability of underlying T2-distributions. In this abstract, we compare the performance of our EM based algorithm against that proposed by Prasloski et al.7. We demonstrate better consistency with MESE-based quantification in WM-tracts.
THEORY
For a known flip angle error (FAE), the T2-decay can be written as the linear function of underlying T2 distributions (x)8: yEPG = AEPGx + ε, with AEPG(i,j) = intensity at echo time-point TE(i) due to unit water fraction at T2 value T2(j) . The single voxel parameters x, y, ε can be stacked as multi voxel column vectors $$$\overline{x}, \overline{y}, \overline{\epsilon}$$$ and the corresponding multi voxel equivalent can be written as: $$$\overline{y} = A_{MV}\overline{x}+\overline{\epsilon}$$$ . Here, AMV is the block diagonal matrix, constructed with voxelwise-AEPG along its block. It was previously shown8 that by simultaneous implementation of conventional and spatial regularization, a more noise robust reconstruction of MWF-map is possible:
$$\widehat{x} = arg min_x {||A_{MV}\overline{x}- \overline{y} ||}^2+M_T{||\overline{x}||}^2+\mu_s{||D_s \overline{x}||}^2$$
METHODS
Data: QT2R data was acquired from 2 healthy volunteers using CPMG based non-selective MESE and GRASE sequences (3T Philips-Ingenia) with: axial FOV 230x190 mm, voxel resolution 2 x 2 x 3.5 mm3, receiver bandwidth 355 kHz, 12 slices, TR 2000 ms, 32 echoes, SENSE-factor: inplane = 2 & Slice-encoding = 2; echo spacing 6 ms; Average 2. Additionally, EPI-factor of 3 was used for GRASE sequence. It took ~14 and ~42 minutes to acquire MESE and GRASE data with limited coverage. Average of 2 was essential for the FID correction.
Algorithm: The flow-chart is shown in Fig 1. As an initialization step, first the joint estimation of μT-map and flip angle error map (or equivalently B1-error) is performed using extended L-curve approach. Following this, we iteratively improve over T2-distribution map (M-step) and refine over flip angle error until the convergence of solutions (T2 distributions). In practice, the convergence is achieved with in fourth iteration.
RESULTS
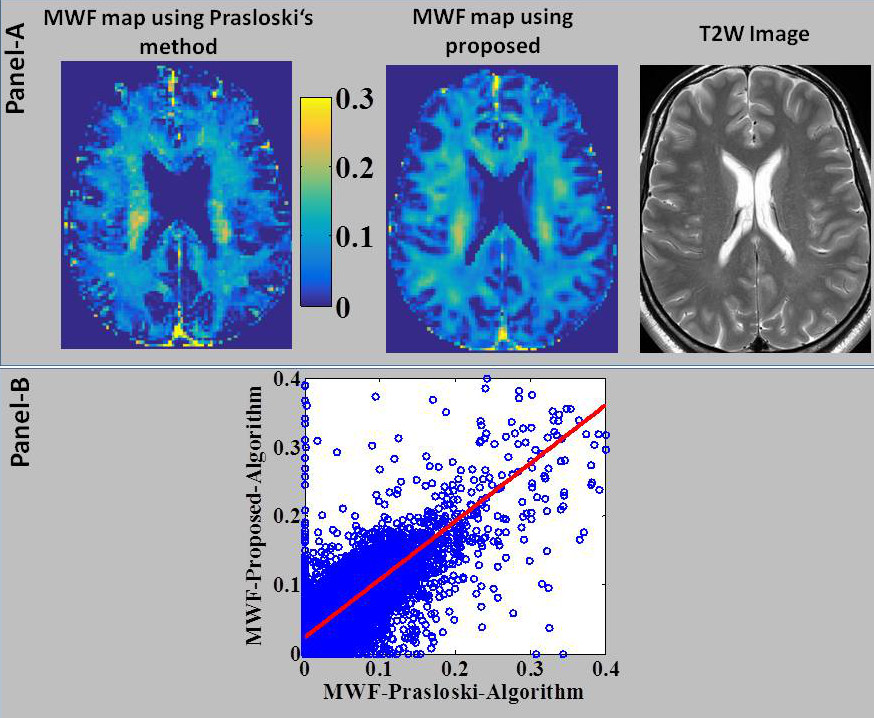
The performance of our algorithm, namely EM based Multi voxel spatial regularization approach with stimulated echo correction (MVSR-STE), has been compared against Algorithm of Prasloski et al. (6) and results are shown in Fig 2. Please notice that MWF-map extracted using our MVSR-STE algorithm matches much closely with corresponding T2W contrasts (Fig.2, Panel-A). The scatter plot between MWF-values from both methods is also plotted (Fig.2, Panel-B). The regression line corresponds to: y = 0.7768x+.0218 and R-squared = 0.6634. This indicates that MWF-values based on region-of-interests averaging are consistent between both methods.DISCUSSIONS
There are two stages in establishing GRASE as a replacement for MESE based quantification. One, the sequence and experimental conditions have to be optimized. Second, a better reconstruction algorithm would be needed. The major drawbacks of our study is lack of adequate focus on B0-shimming and lack of reproducibility study. B0-effect would influence results from GRASE based quantification. None the less, we have shown that our EM-based multi voxel spatial algorithm with stimulated echo correction has superior performance over algorithm proposed by Prasloski et al. (6).CONCLUSIONS
Results demonstrate good consistency between both sequences, though adequate focus should be made on getting better B0-shimming.Acknowledgements
This project was partly supported by the National Institute of Biomedical Imaging and Bioengineering of the National Institutes of Health (Grant Number P41-EB015893) and the National Institute of Neurological Disorders and Stroke (Award Number R01NS087516).
All authors would like to thank Dr. Hendrik Kooijman, Philips Healthcare, Hamburg, Germany for providing valuable support and guidance regarding the optimization of sequence. We would also like to thank Prof. Stephen Becker, Applied Mathematics, University of Colorado at Boulder, USA for sharing his L-BFGS-B code. We would also like to thank Mr. Mohamad Nawab Alam, Dept. of Electric Engineering, Indian Institute of Technology, Roorkee, India for help in develop genetic algorithm for minimizing expression in E-step, though it was not used in here as we were able to get better performance from “lsqnonlin” solver.
References
1. Deoni SC, Rutt BK, Arun T, Pierpaoli C, Jones DK. Gleaning multicomponent T1 and T2 information from steady-state imaging data. Magn Reson Med 2008;60(6):1372-1387.
2. Deoni SC, Mercure E, Blasi A, Gasston D, Thomson A, Johnson M, Williams SC, Murphy DG. Mapping infant brain myelination with magnetic resonance imaging. J Neurosci 2011;31(2):784-791.
3. Deoni SC. Transverse relaxation time (T2) mapping in the brain with off-resonance correction using phase-cycled steady-state free precession imaging. J Magn Reson Imaging 2009;30(2):411-417.
4. Deoni SC. High-resolution T1 mapping of the brain at 3T with driven equilibrium single pulse observation of T1 with high-speed incorporation of RF field inhomogeneities (DESPOT1-HIFI). J Magn Reson Imaging 2007;26(4):1106-1111.
5. Raj A, Pandya S, Shen XB, LoCastro E, Nguyen TD, Gauthier SA. Multi-Compartment T2 Relaxometry Using a Spatially Constrained Multi-Gaussian Model. PLoS One 2014;9(6).
6. Prasloski T, Rauscher A, MacKay AL, Hodgson M, Vavasour IM, Laule C, Madler B. Rapid whole cerebrum myelin water imaging using a 3D GRASE sequence. Neuroimage 2012;63(1):533-539.
7. Prasloski T, Madler B, Xiang QS, MacKay A, Jones C. Applications of stimulated echo correction to multicomponent T2 analysis. Magn Reson Med 2012;67(6):1803-1814.
8. Kumar D, Siemonsen S, Heesen C, Fiehler J, Sedlacik J. Noise robust spatially regularized myelin water fraction mapping with the intrinsic B1 -error correction based on the linearized version of the extended phase graph model. J Magn Reson Imaging 2016;43(4):800-817.
Figures