2523
First Application of 7T Structural, Vascular, and Diffusion Imaging to Trigeminal Neuralgia: Preliminary Results in Patients1Radiology, Translational and Molecular Imaging Institute, Icahn School of Medicine at Mount Sinai, New York, NY, United States, 2Biomedical Engineering, City University of New York, New York, NY, United States, 3Radiology, Icahn School of Medicine at Mount Sinai, New York, NY, United States, 4Neuroradiology, Mount Sinai Medical Center, New York, NY, United States, 5Neurosurgery and Otolaryngology, Mount Sinai Medical Center, New York, NY
Synopsis
Trigeminal neuralgia (TN) is a debilitating condition characterized by severe facial pain. The pathophysiology of TN is not well understood and conventional clinical imaging often fails to identify the anatomical source of pain. In this study, we perform high-resolution 7T structural, vascular and diffusion-weighted MRI to visualize the trigeminal nerve region in three TN patients and three controls. We found that 7T-MRI provided improved visualization of nerve abnormalities compared to clinical scans. We also found greater nerve asymmetry in TN patients compared to controls. Multi-modal 7T-MRI could enhance our understanding of TN etiology and provide improved clinical outcomes for TN.
Introduction
Trigeminal neuralgia (TN) is a chronic condition characterized by severe, shock-like or burning facial pain (NINDS). The physiological mechanisms leading to pain symptoms in TN are not fully understood and may result from a range of possible conditions.1-4 Among suspected causes for TN is neurovascular compression (NVC)5, in which a vessel compresses the nerve. Conventional clinical imaging often fails to identify an abnormality (such as NVC) due to the lack of resolution to detect small vessels or quantify nerve integrity. 7T-MRI is capable of visualizing the anatomy in high detail, but to date has not been used for diagnostic imaging of TN.6 In this study, we report first results of imaging TN with high-resolution 7T structural-MRI, vascular-MRI, and diffusion-weighted-MRI (dMRI). Here we evaluated a multi-modal 7T-MRI protocol for visualization of the nerve and surrounding vessels in three TN patients and three controls.Methods
Subjects: Three TN patients ages 31(M), 45(M), and 66(F) and three controls ages 22(F), 54(F), and 55(M) under an approved IRB protocol.
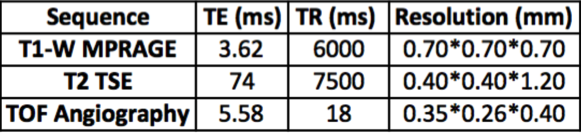
MRI: Subjects underwent the 7T-MRI protocol listed in Table 1. They also underwent high-angular-resolved, simultaneous multi-slice dMRI (1.05mm isotropic resolution, 68 directions). We reduced artifacts in the brainstem region by performing localized B0 shimming. dMRI images were corrected for distortions and registered to T1-weighted images.
Processing: Fiber orientation distributions for tractography were obtained from the corrected diffusion-weighted images by spherical deconvolution. Tractography for visualization of the TN was performed using the iFOD2 algorithm implemented in MRTRIX3 using a seed placed in the TN.
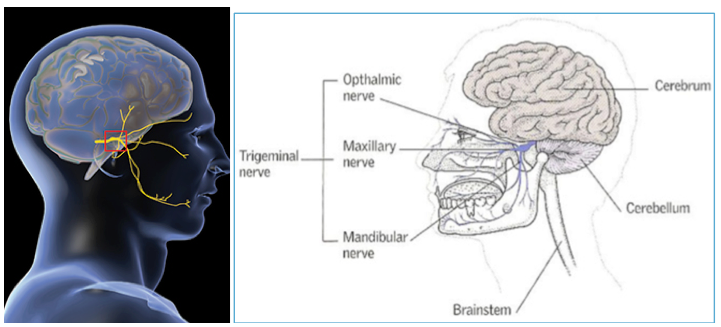
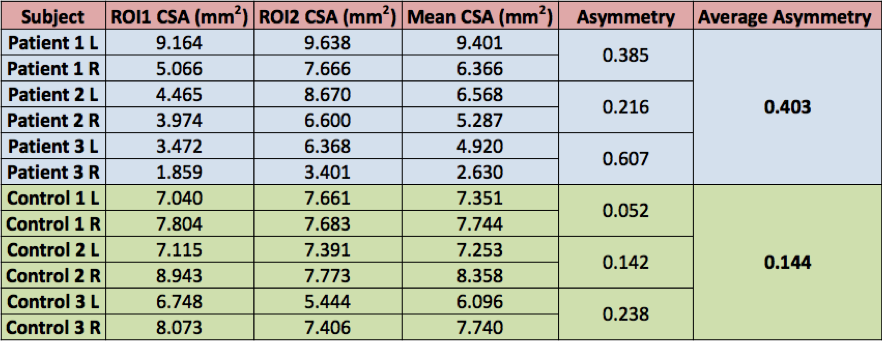
Structural Measurements: The cross sectional area (CSA) of the nerve was measured by drawing regions of interest (ROIs) in Osirix (Pixmeo, Switzerland), using high-resolution T1-weighted coronal images. CSA was measured for both left and right trigeminal nerves, with two ROIs drawn for each nerve: the first at the most posterior point where the nerve emerges from the brainstem pons and the second at the most anterior point as the nerve enters Meckel’s cave. A schematic of the nerve is shown in Figure 1. The two ROI CSA values were averaged to obtain the mean CSA of the nerve. An asymmetry index (AI) was calculated by subtracting right from left and dividing by the average CSA. A group comparison of AI values was performed.
Results
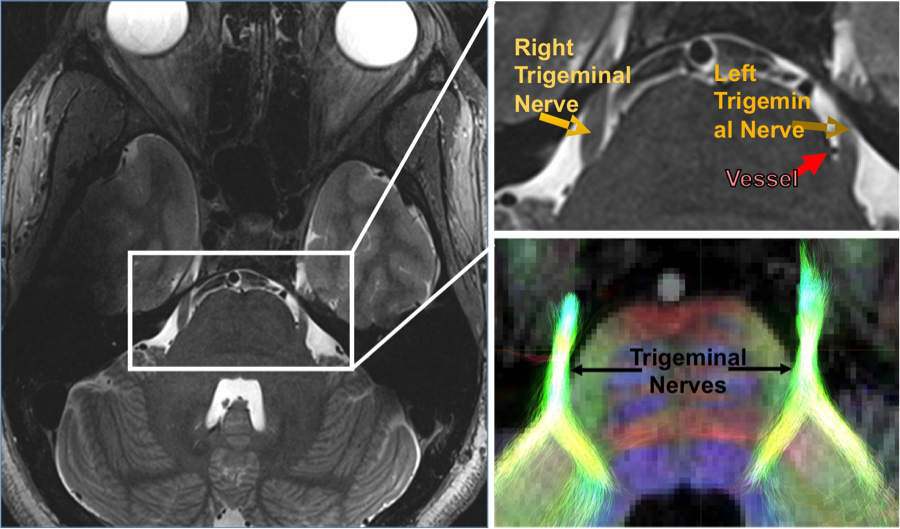
The 7T images enabled high-resolution visualization of the nerve source and NVC by surrounding vessels, as shown in Figure 2. Structural abnormalities in the nerve were found in all three patients. 7T-MRI data was used with clinical standard of care imaging for treatment planning. Patients 1 and 2 had 1.5T MRI scans. Patient 3 had a 3T MRI scan. Clinical findings are described below:
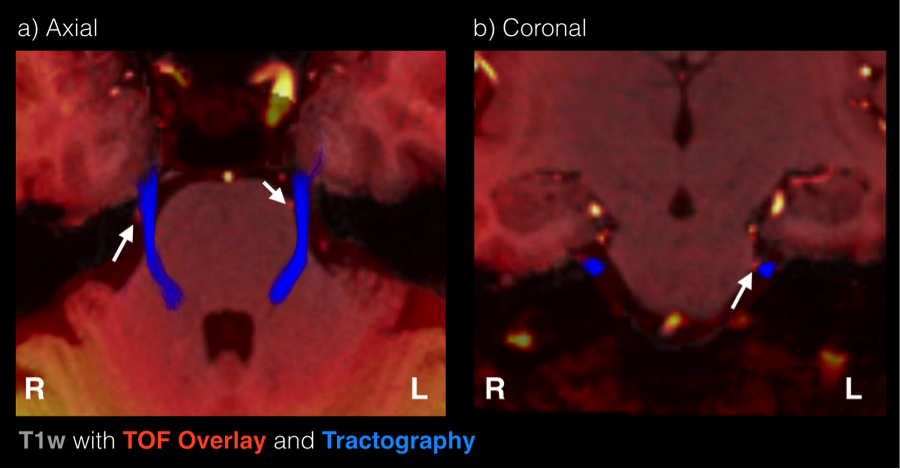
Patient 1: The images indicated a vessel in close proximity to the left trigeminal nerve root entry zone (REZ), between the lateral body of pons and trigeminal nerve before coursing over the superior aspect of the nerve. 7T-MRI images are shown in Figure 3.
Patient 2: The images showed a basilar proximity to the left trigeminal nerve. This is consistent with the patient’s known history of left-sided TN. 7T-MRI altered the surgical course for this patient.
Patient 3: The images indicated a suspected vascular encroachment on right trigeminal nerve. This patient received surgical treatment, specifically microvascular decompression, with relief of symptoms.
The structural imaging quantitative metrics performed are shown in Table 2. Qualitatively, asymmetry was observed in the trigeminal nerves of patients. We found initial quantitative differences, with an average AI of 0.403 for patients compared to 0.144 for controls. A t-test was performed, indicating a trend towards significance (p~0.1) and an effect size of approximately 2.
Discussion
We present the first application of 7T-MRI to visualize and elucidate TN pathophysiology for guidance of treatment. This study demonstrates the feasibility of utilizing 7T-MRI to reveal nerve anatomy and surrounding structures. 7T-MRI provided increased visualization of NVC at the REZ of the trigeminal nerve, which served to further corroborate preliminary low-field imaging in all three patients. In general, greater asymmetry in patients compared to controls was found in this preliminary sample with a high effect size. Asymmetry in TN patients may arise from nerve damage or edema, resulting in opposing effects on the CSA of the nerve on the symptomatic side. Ongoing work is focused on validating these findings in a larger sample. Future work will focus on sequence development to distinguish arteries from veins, which is useful in pre-op planning and prognosis. Ultimately, multi-modal 7T-MRI could provide a powerful tool to enhance our understanding of TN pathophysiology and provide improved diagnosis and targeted treatments for TN.Acknowledgements
This work was supported by National Institutes of Health under NCI R01 CA202911, and the Icahn School of Medicine Capital Campaign, Translational and Molecular Imaging Institute and Department of Radiology, Icahn School of Medicine at Mount Sinai.References
1. Lummel, N., et al., Diffusion tensor imaging of the trigeminal nerve in patients with trigeminal neuralgia due to multiple sclerosis. Neuroradiology, 2015. 57(3): p. 259-67.
2. Samadian, M., et al., Trigeminal Neuralgia Caused by Venous Angioma: A Case Report and Review of the Literature. World Neurosurg, 2015. 84(3): p. 860-4.
3. Isik, S., et al., Trigeminal Neuralgia Caused by Cerebellopontine Angle Arteriovenous Malformation Treated With Gamma Knife Radiosurgery. J Craniofac Surg, 2016. 27(1): p. e55-7.
4. Agrawal, S.M. and D.H. Kambalimath, Trigeminal neuralgia involving supraorbital and infraorbital nerves. Natl J Maxillofac Surg, 2010. 1(2): p. 179-82.
5. Pamir, M.N., et al., Microvascular decompression in the surgical management of trigeminal neuralgia. Neurosurg Rev, 1995. 18(3): p. 163-7.
6. Alper, J., R.K. Shrivastava, and P. Balchandani, Is There an MRI-Discernible Etiology for Trigeminal Neuralgia? A Structured Review. World Neurosurgery, 2016.
Figures