2521
Texture Analysis of MR Images in Pediatric Cervical Spinal Cord Injury1Temple University, Philadelphia, PA, United States, 2Radiology, Thomas Jefferson Hospital University, Philadelphia, PA, United States, 3Occupational Therapy, Thomas Jefferson Hospital University, Philadelphia, PA, United States, 4Radiology, Temple University, Philadelphia, PA, United States
Synopsis
In this study we have investigated on evaluating the ability of texture analysis of routine conventional pediatric spinal cord MRI to characterize the changes of diseased or injured spinal cord.
Introduction
Texture analysis evaluates inter-pixel relationships that generate characteristic organizational patterns in an image, many of which are beyond the ability of visual perception. Given its promise in detecting subtle structural alterations, texture analysis may be an attractive means to evaluate disease activity and evolution [1,2]. It may also become a new tool to assess therapeutic efficacy if technical issues are resolved and pathological correlates are further confirmed [2,3]. The purpose of this study is to identify and evaluate the patterns of texture features as a measure of tissue integrity and its potential clinical relevance in typically developing (TD) pediatric subjects and patient with cervical spinal cord injury (SCI) in spinal cord MR images.Methods
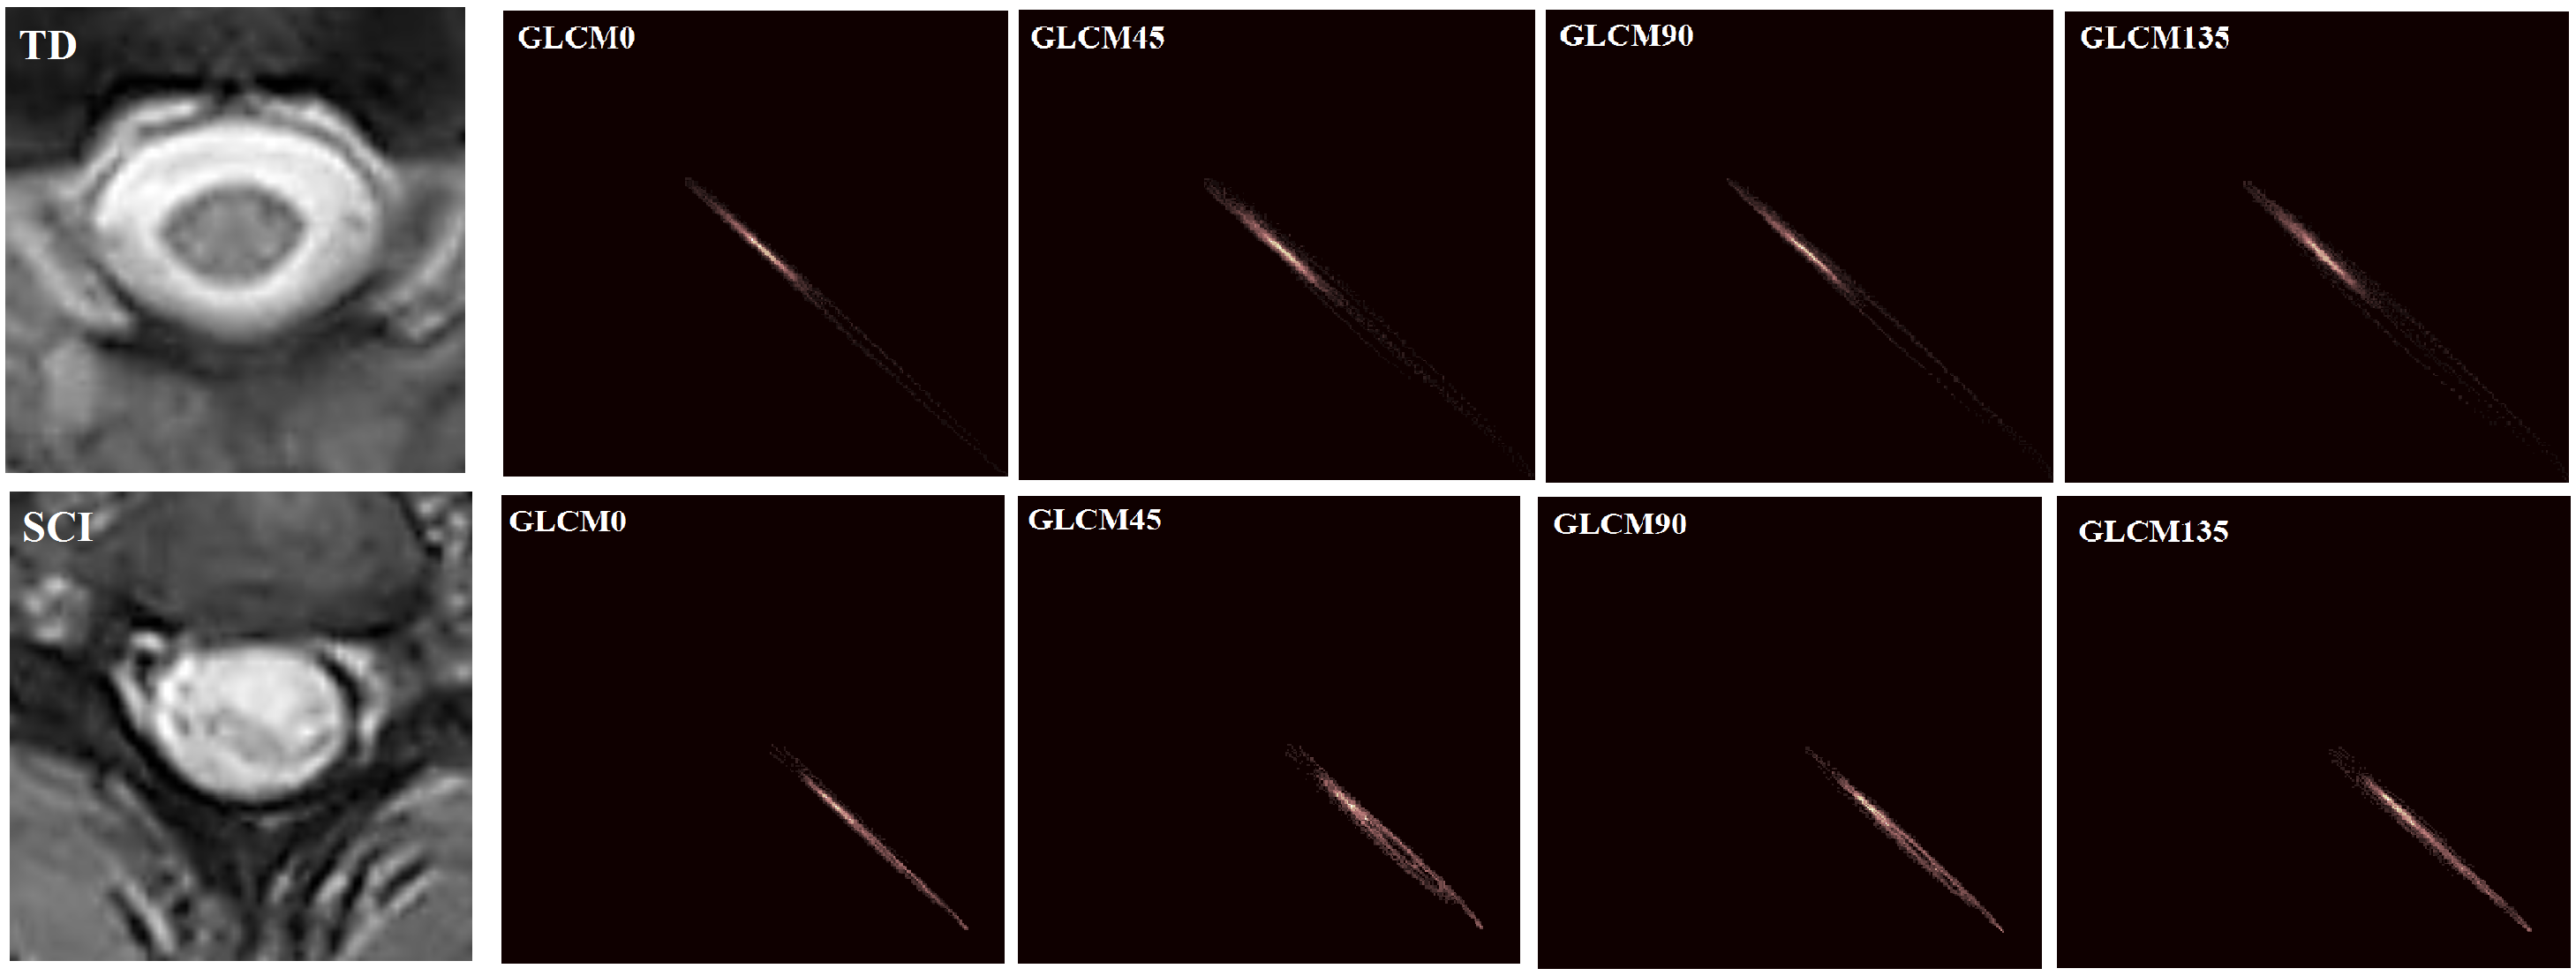
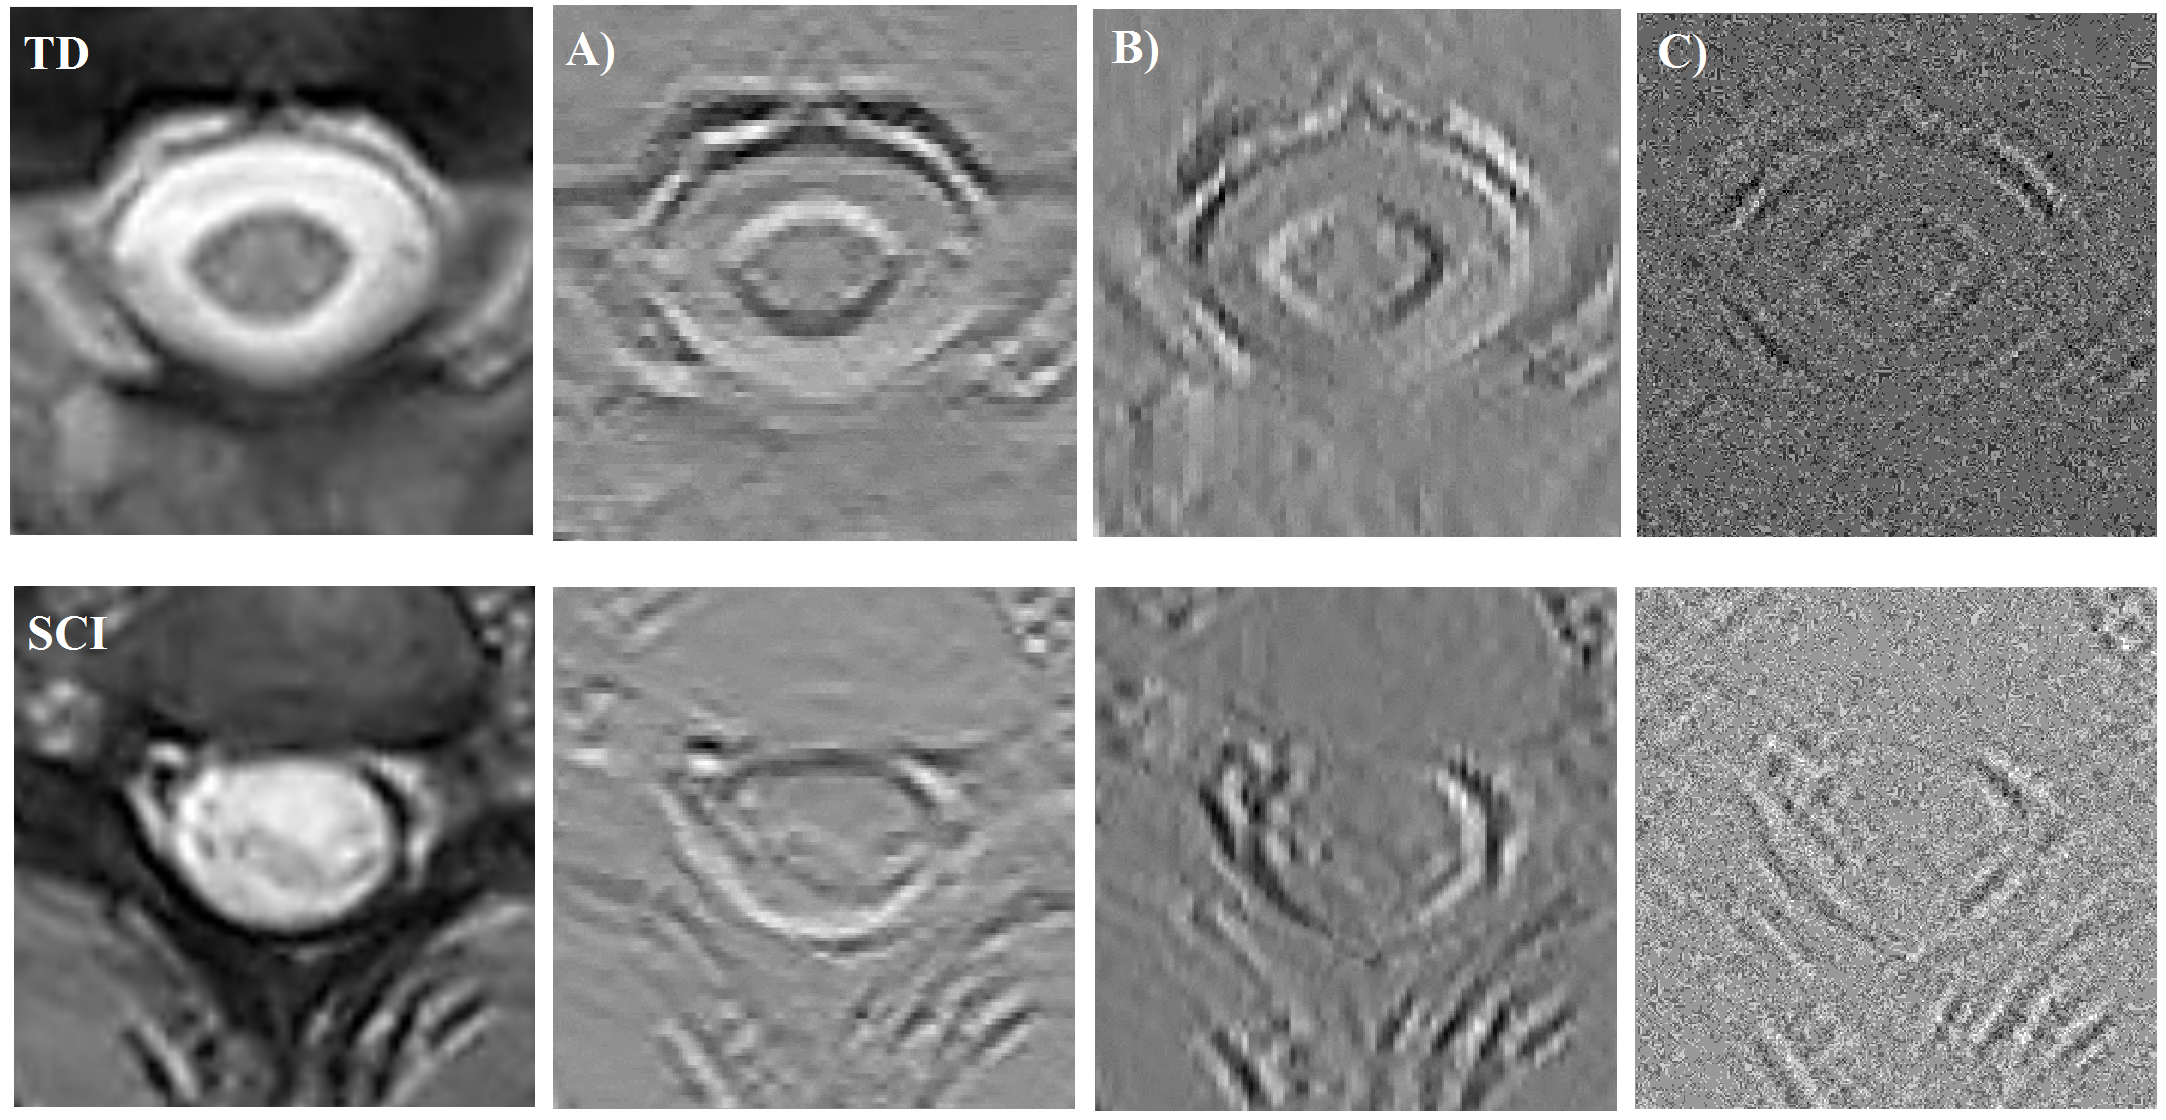
A total of 15 subjects (10 healthy and 5 cervical SCI patients) ranging in age from 6-16 years old (11.78±2.99 (mean ±standard deviation)) were recruited, and scanned using 3.0T Siemens Verio MR scanner with 4-channel neck matrix and 8-channel spine matrix coils. The protocol consists of a conventional sagittal turbo spin echo (TSE)-T1-weighted scan, a sagittal TSE-T2- weighted scan, and an axial T2-weighted-gradient echo (GRE). The axial T2-weighted-GRE scan was prescribed from the sagittal T2-weighted image to cover the cervical spinal cord (C1-(C7-T1) levels). The imaging parameters included: voxel size=0.42×0.42×6.0mm3, matrix size=384×384, TR=878ms, TE=7.8ms, slice thickness=6mm, flip angle=25°, number of averages=1 and acquisition time=156s. Following data acquisition, texture features were calculated by using ROIs drawn on the whole cord in T2-weighted-GRE images along the cervical spinal cord by an independent board certified pediatric neuroradiologist. A total of 33 features including 5 first order features based on the histogram of the image (mean, variance, skewness, kurtosis and entropy), and 16 second order feature vector elements, incorporating four statistical measures (contrast, correlation, homogeneity and energy) calculated from grey level co-occurrence matrices (GLCM) in directions of 0°, 45°, 90° and 135° (figure 1) were calculated.In addition 12 high order texture features incorporating four statistical measures (mean, variance, entropy and energy) was calculated from coefficients matrices (horizontal, vertical, and diagonal, respectively) of wavelet decomposition (using Haar wavelets) (figure 2). These features then were compared between TD and cervical SCI subjects based on standard least squared linear regression model and restricted maximum likelihood (REML) method (JMP pro 13.0 software).Results
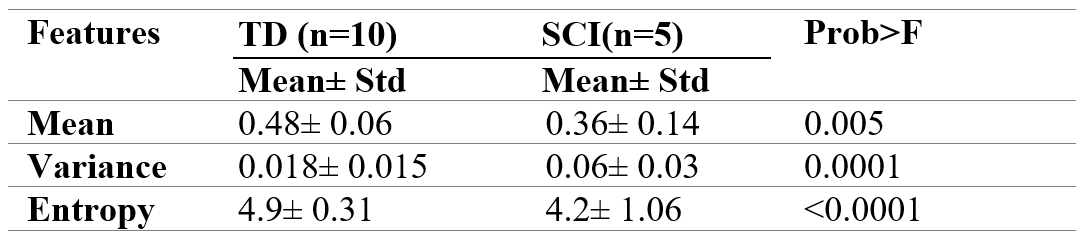
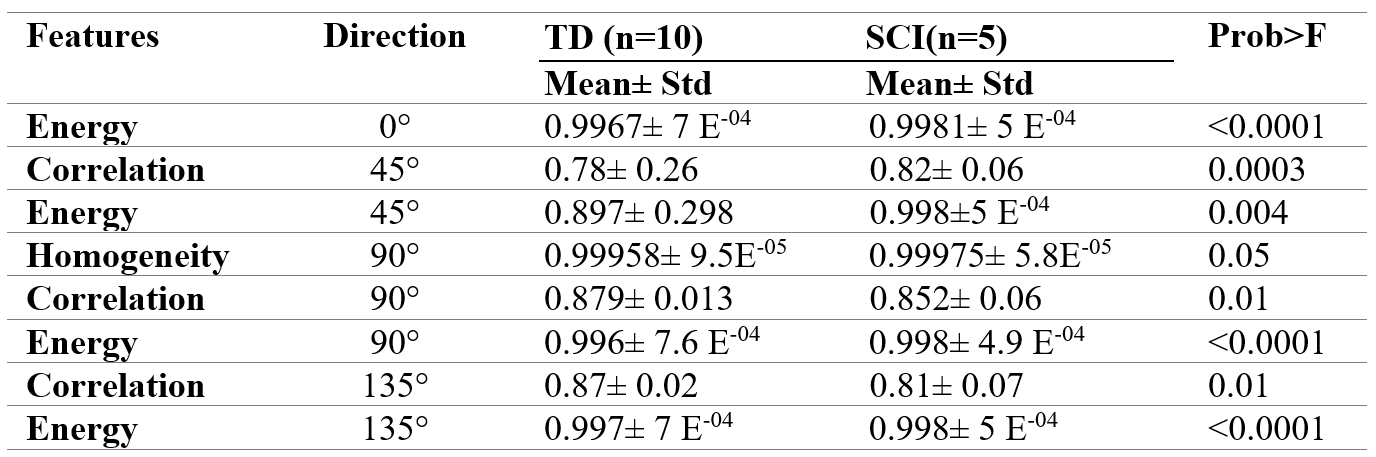
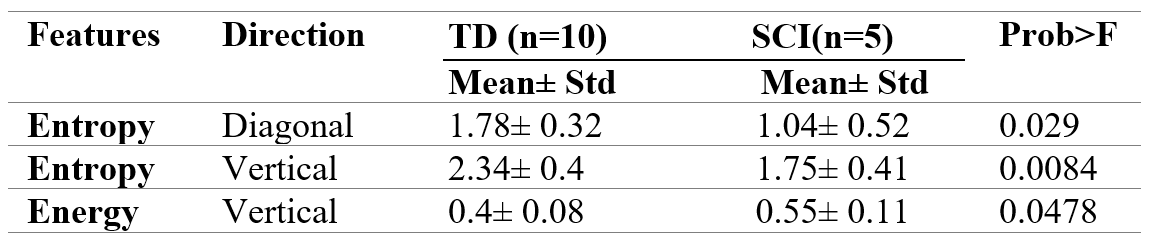
There were 14 texture features that showed significantly differences (using Fisher test and maximum likelihood) between TD and cervical SCI population. These features are presented in Tables 1-3. Also averaged mean and standard deviation of these features were calculated along cervical spinal cord.Discussion
In this study, we have shown that consistent information from routine conventional pediatric spinal cord MRI can be extracted using texture analysis. Furthermore, despite the promising outcomes, pathological correlates of texture analysis are subject to confirmation and warrants studies in subjects with spinal cord injuries.
As can be seen in Table 1, mean and entropy (measure of the randomness of a gray-level distribution) decreases in SCI group. However, variance increases in SCI group which might be due to contamination of the cerebrospinal fluid (CSF) in injury site. Table 2 shows, energy (in directions of 0°, 45°, 90° and 135°) which is a strong measure of uniformity increases in SCI group. Correlation (measure of gray level linear dependency of the image) shows different trends in directions of 45°, 90° and 135° and homogeneity (measures the closeness of the distribution of elements in the GLCM to the GLCM diagonal) in direction of 90° increases in SCI population. In the higher order texture feature analysis entropy (in diagonal and vertical directions) shows significant decrease and energy (in vertical direction) shows significant increase in SCI group.
Conclusion
These results show that texture descriptors could be used a surrogate marker for quantification and visualization of the spinal cord and has the potential to improve our understanding of damage and recovery in diseased states of the spinal cord.Support
This work was supported by National Institute of Neurological Disorders of the National Institutes of Health under award number R01NS079635.Acknowledgements
No acknowledgement found.References
[1] Yunyan Zhang. MRI Texture Analysis in Multiple Sclerosis, International Journal of Biomedical Imaging, 2012, 1-7.
[2] A. Kassner, R.E. Thornhill. Texture Analysis: A Review of Neurologic MR Imaging Applications, AJNR (2010) 31: 809-816.
[3] D.J. Tozer, G. Marongiu, J.K. Swanton, A.J. Thompson, D.H. Miller. Texture Analysis of Magnetization Transfer Maps from Patients with Clinically Isolated Syndrome and Multiple Sclerosis, JMRI, 2009; 30:506–513.
Figures