2516
Residual tumour detection in post-treatment granulation tissue by using multiple diffusion models in head and neck squamous cell carcinoma patients1Hokkaido University Hospital, Sapporo, Japan
Synopsis
We assessed the utility of diffusion parameters obtained by multiple fitting models for the determination of the presence of the residual tumor after the curative chemoradiation in patients with head and neck squamous cell carcinoma (HNSCC). The result of the current study revealed the center of the Gaussian distribution of diffusion coefficient (Ds) in the statistical diffusion model and diffusion heterogeneity parameter in the stretched exponential model were respectively indicated as an independent predictor for the determination of the presence of residual tumor. This result will be useful information for the daily clinical follow-up in patients with HNSCC.
Introduction
The detection of the residual tumor at the early period after the curative chemoradiation is important to determine the follow-up strategy or additional surgical resection in patient with head and neck squamous cell carcinoma (HNSCC). We conducted the present study to evaluate the detectability of residual tumour in post-treatment granulation tissue, using parameters obtained with multiple advanced diffusion models in HNSCC patients treated with chemoradiation.Materials and Methods
1) Patients
We evaluated the cases of 23 patients with HNSCC who received the curative a full course of curative treatment with 70-Gy radiation. MRI including multiple b-value DWI was performed within 1 month after the end of the treatment. In all patients, clinical and radiological follow-ups were performed after the treatment to determine the final diagnosis related to the presence of residual tumour at the primary site.
2) MR scanning
All MR imaging was performed using a 3.0 Tesla unit (Achieva TX; Philips Healthcare, Best, Netherlands) with a 16-channel neurovascular coil. The DWI acquisition used single-shot spin-echo echo-planar imaging (EPI) with three orthogonal motion probing gradients. Eleven b-values (0, 10, 20, 30, 50, 80, 100, 200, 400, 800 and 1000 s/mm2) were used. The other imaging parameters were: TR, 4500 ms; TE, 64 ms; DELTA (large delta; gradient time interval), 30.1 ms; delta (small delta; gradient duration), 24.3 ms; flip angle, 90°; field of view (FOV), 230×230 mm; 64×64 matrix; slice thickness, 5 mm×20 slices; voxel size 3.59×3.59×5.00 mm; parallel imaging acceleration factor, 2; the number of signal averages = b-value of 0–100 s/mm2 (one average), 200–800 s/mm2 (two averages) and 1000 s/mm2 (three averages); scanning time, 4 min 02 s.
3) Data analysis
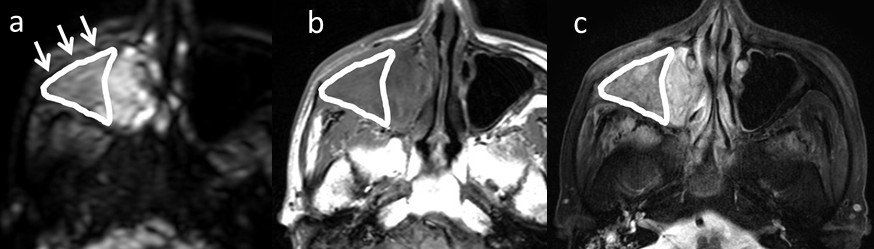
In all patients, region of interest (ROI) was delineated each post-treatment granulation tissue with a polygonal ROI on b0 images (Fig. 1). The signal intensity in each b-value image was determined as the mean value in the delineated ROI by integrating all granulation tissue voxels from all delineated slices into the total signal intensity. The data analysis was performed using this ROI-based mean value. From the diffusion signal data obtained by the ROI analysis, we calculated each parameter of the mono-exponential function (here, the ADC), the bi-exponential function (the perfusion fraction f, the pseudo-diffusion coefficient D*, and the slow diffusion coefficient D), and the parameters for the diffusion kurtosis imaging (DKI) (the kurtosis value K and the kurtosis-corrected diffusion coefficient Dk), the stretched exponential model (SEM) (diffusion heterogeneity α and the distributed diffusion coefficient DDC) and the statistical diffusion model (SDM) (the width of the Gaussian distribution σ and the center of the Gaussian distribution of diffusion coefficient Ds) . Because assessments of the ADC, DKI, SEM and SDM usually targeted the tissue diffusion except for the perfusion-related signal, we used the signal intensity of five b-values (0, 200, 400, 800 and 1000 s/mm2) for the parameter calculation of the ADC, DKI, SEM and SDM. For the parameter calculation, we used the previously reported equations 1-4.
4) Statistical analysis
In a univariate analysis, we used the Mann-Whitney U-test to compare the all diffusion parameters between the post-treatment granulation tissues with and without residual tumour, respectively. If a significant difference was obtained for more than two parameters among all parameters, these parameters were analyzed by multivariate logistic regression models to determine whether they had independent predictive value with odds ratios (OR) and corresponding 95% confidence intervals (CIs).
Results
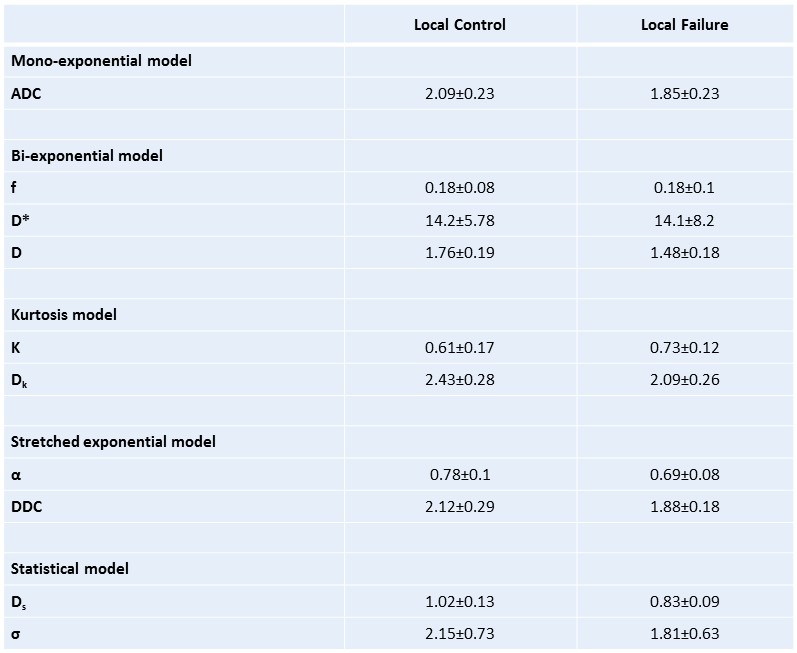
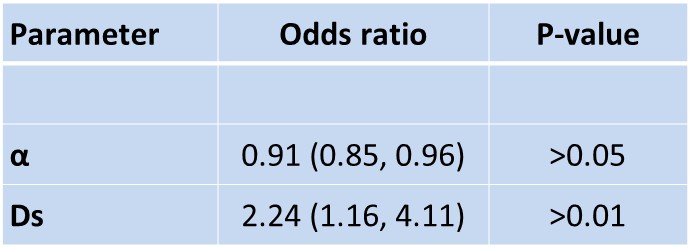
Among the 23 patients, seven were found to have residual tumour. All diffusion parameters were successfully calculated (Fig. 2). The univariate analysis revealed significant differences between the local control and failure groups in ADC, D, Dk, DDC, α and Ds, respectively. The multivariate analysis revealed that the Ds and α were independent predictors for determining the presence of residual tumour (Fig. 3).Discussion
We successfully determined the multiple models' diffusion parameters in all post-treatment granulation tissues. In the residual tumour group, Ds obtained by the SDM and α by the SEM were both shown to be independent predictors for the detection of residual tumour. Being able to predict a patient’s prognosis will provide useful information for decision-making regarding additional chemotherapy and the planning of earlier salvage surgery after the current chemoradiotherapy. This information will also contribute to the determination of a follow-up strategy, such as the interval for CT or MR scanning.Acknowledgements
No acknowledgements.References
1. Chen Y, Ren W, Zheng D, et al. Diffusion kurtosis imaging predicts neoadjuvant chemotherapy responses within 4 days in advanced nasopharyngeal carcinoma patients. J Magn Reson Imaging. 42 (2015) 1354-1361.
2. Fujima N, Yoshida D, Sakashita T, et al. Prediction of the treatment outcome using intravoxel incoherent motion and diffusional kurtosis imaging in nasal or sinonasal squamous cell carcinoma patients. Eur Radiol. 2016. Jun 2 [Epub, ahead of print]
3. Fujima N, Yoshida D, Sakashita T, et al. Intravoxel incoherent motion diffusion-weighted imaging in head and neck squamous cell carcinoma: assessment of perfusion-related parameters compared to dynamic contrast-enhanced MRI. Mag Res Imaging. 32 (2014) 1206-1213
4. Yuan J, Yeung DK, Mok GS, et al. Non-Gaussian analysis of diffusion weighted imaging in head and neck at 3T: a pilot study in patients with nasopharyngeal carcinoma. PloS One. 9 (2014) e87024
Figures