2515
Mathematical Modeling for Evaluating Gustatory Stimulation of Parotid Gland by Proton Density MRI1Master 's Program of Biomedical Informatics and Biomedical Engineering of Feng Chia University, Taichung, Taiwan, Taichung, Taiwan, 2Department of Automatic Control Engineering, Feng Chia University, Taichung, Taiwan, Republic of China, 3Ph.D. program in Electrical and Communication Engineering in Feng Chia University, Taichung, Taiwan, Republic of China, 4Department of Radiology, Tri-Service General Hospital, Taipei, Taiwan, Republic of China, 5Department of Diagnostic Radiology, The University of Hong Kong, Hong Kong, 6Ph.D. program of Technology Management, Chung Hua University, Hsinchu, Taiwan, Republic of China, 7Department of Medicine, Taipei Medical University, Taipei, Taiwan, Republic of China, 8Department of Dentistry, National Defense Medical Center, Taipei, Taiwan, Republic of China, 9Department of Radiology, National Defense Medical Center, Taipei, Taiwan, Republic of China
Synopsis
The parotid gland function is evaluated by gustatory stimulation using scintigraphy in clinic. Due to the saliva secretion of parotid, it is supposed to measure the water component of parotid gland using PD MRI instead of scintigraphy. Normally the drop magnitude and recover rate of signal-time curve after gustatory stimulation was used to evaluate the function of parotid gland. For more physiology and quantitative parameters of characteristics of signal-time curve, we developed a mathematical model for drainage and refill of a toilet tank to quantify the parotid gland function in this study.
Introduction
Evaluation of parotid gland function is of clinical importance. Parotid gland function can be impaired by several diseases including infection, sialolithiasis, Sjogren’s syndrome [1], type 2 diabetes mellitus [2], amyotrophic lateral sclerosis with autonomic dysfunction [3] or treatments such as radiotherapy [4] and radioiodine I-131 therapy [5]. Since 1975, salivary gland function has been evaluated by scintigraphy [6-8], which allows dynamic measurements of 99mTc-pertechnate in the salivary glands. Because the main function of parotid glands is to secrete saliva, it is plausible that measuring the changes of water component of the parotid glands might allow direct evaluation of the parotid gland function. Double echo MRI allows calculating proton density (PD) of the parotid glands. Theoretically, the change of parotid PD in gustatory stimulating experiments represents the change of parotid water component. The change of parotid water content after gustatory stimulation is mainly determined by two factors, including an arterial input and a Stenson’s ductal output. Traditionally the drop magnitude and recover rate of signal-time curve after gustatory stimulation was used to evaluate the function of parotid gland. However, the potential advantages of model analysis for dynamic signal-time curve provided a more meaningful representation of tissue physiology and quantitative parameters of characteristics of signal-time curve. Therefore, we developed a mathematical model for drainage and refill of a toilet tank to quantify the parotid gland function in this study.Materials and Methods
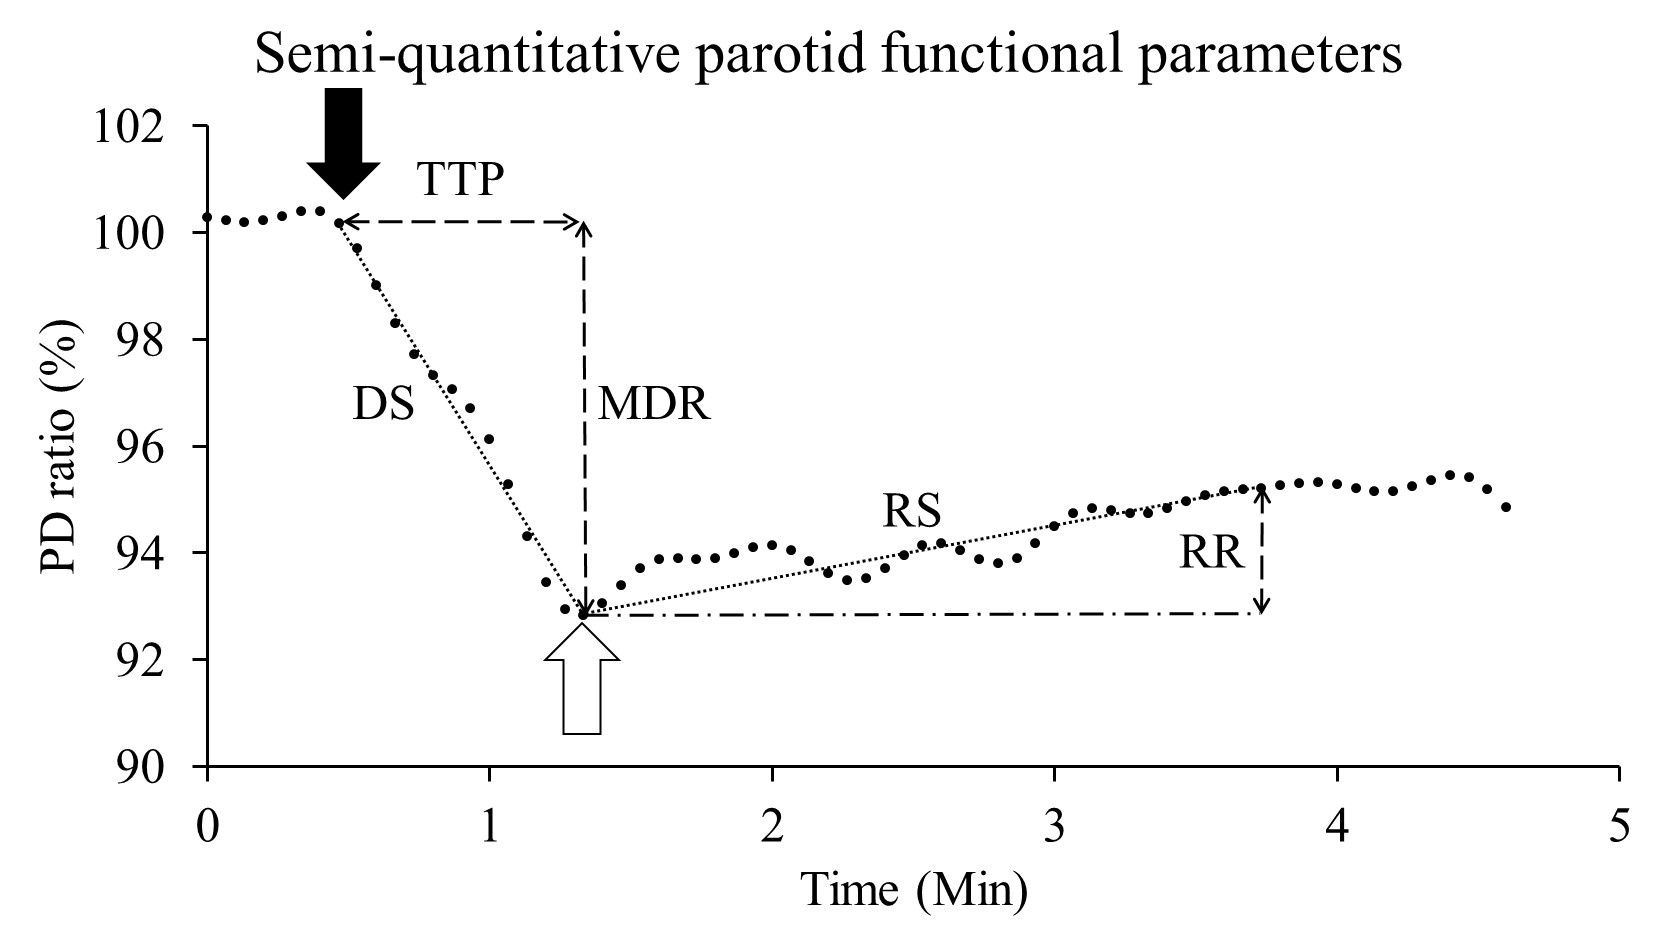
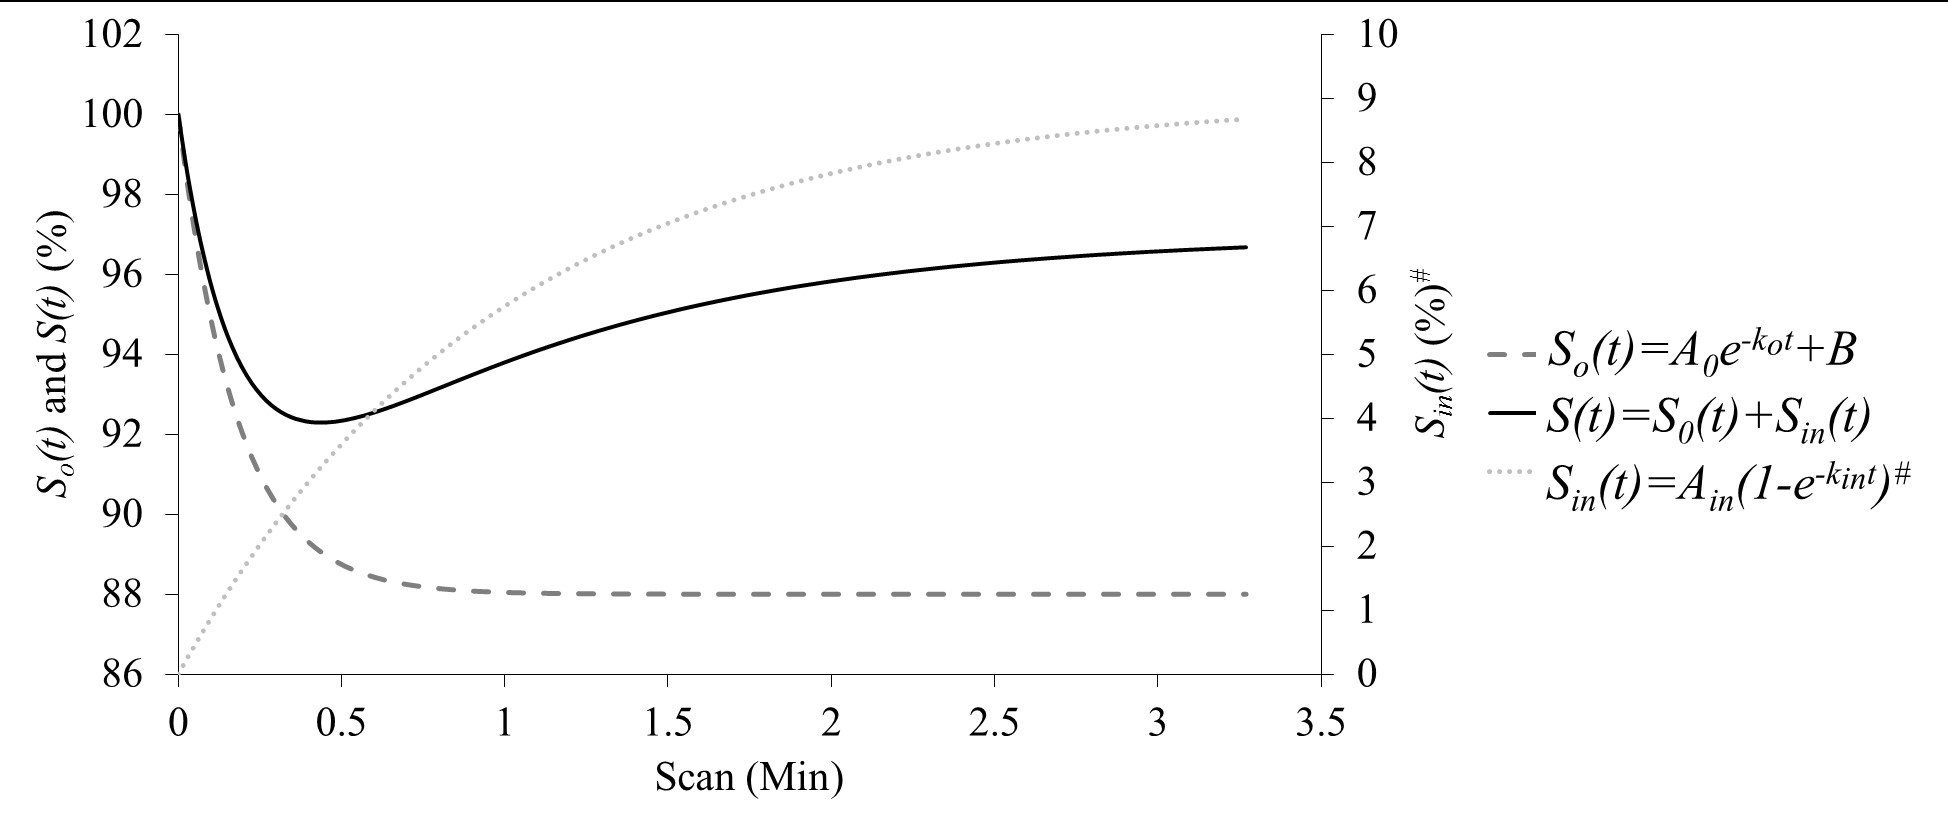
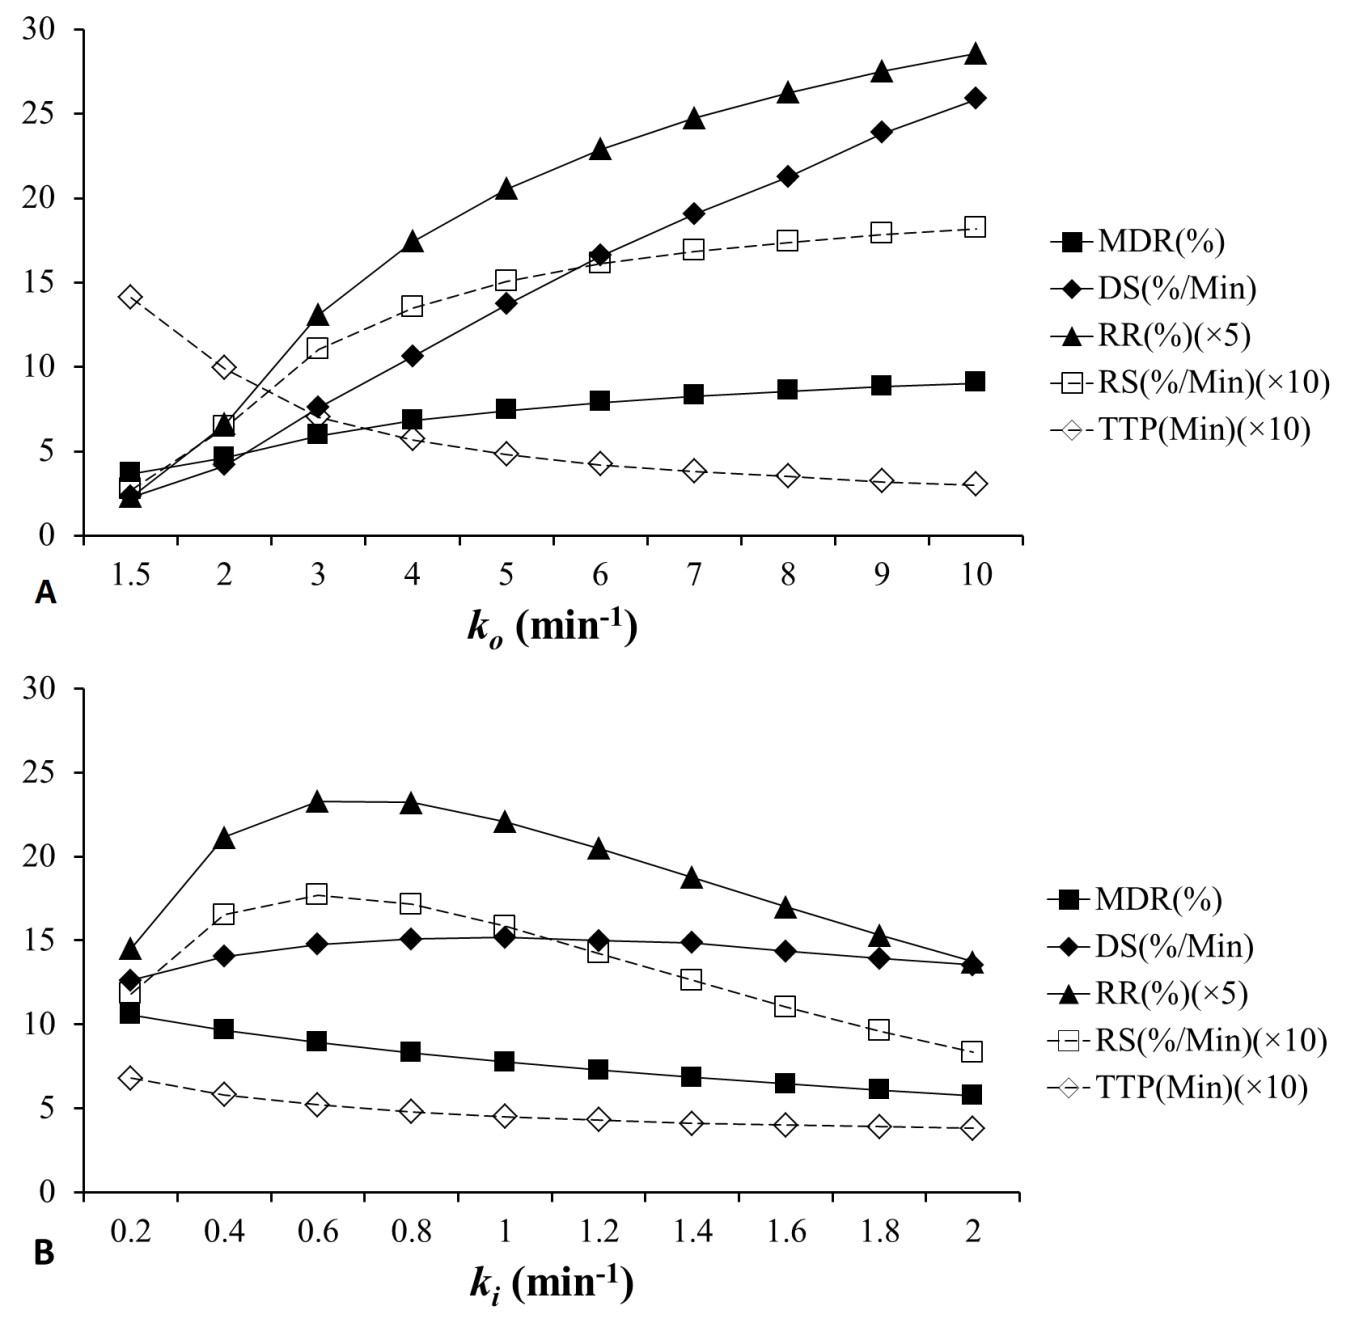
Fig. 1 shows the typical signal-time curve of PD MRI during gustatory stimulating experiments using double echo MR measurement in our related study. Normally the semi-quantitative parameters for the signal-time curve are MDR, TTP, DS, RS and RR. We hypothesized that the salivary drainage and arterial refill of water of the parotid glands in gustatory stimulating experiments is similar to the water drainage and refill of a toilet tank (Fig. 2). Accordingly, we proposed an empirical mathematical model (EMM) to descript the draining and filling of water in a parotid gland after gustatory stimulation. The model contained a simple two-compartment form that can fit data for the water draining caused by gustatory stimulation and water filling due to blood perfusion. A signal ratio time curve was fitted by Equation 1 (Fig. 3): ……[1] , where So represented an output function and Sin represented an input function. Given by an initial signal ratio of 100%, the PD in a parotid gland as an exponential decay function due to salivary secretion after gustatory stimulation could be expressed by Equation 2: ……[2] , where Ao is an amplitude for PD drop of the parotid gland, ko is the PD draining rate, and B is the PD of parotid parenchyma and non-secreted saliva. The PD in a parotid gland as an exponential increase function due to water refill from the blood supply could be expressed by Equation 3: ……[3] , where Ain is an amplitude for PD recovery of the parotid gland and kin is the PD refilling rate. To demonstrate the effects of draining and refill rate constants on PD time curves, simulations with draining rate constant of ko ranging from 1.5 to 10 and refill rate constant of kin ranging from 0.2 to 2 with fixed values of Ao (12%), B (88%) and Ain (9%) were performed. Parotid functional parameters for semi-quantitatively evaluating PD time curves, including MDR, TTP, DS, RS and RR, were calculated with respect to changes of draining rate constants and refilling rate constant.Results
Simulation of PD ratio time curves with different draining rate constants (ko) and refilling rate constant (ki) on were demonstrated on Fig. 4. Relationships between EMM parameters (ko and kin) and semi-quantitative parameters were shown on Fig. 5. Simulation of PD ratio time curves (Fig. 4) and corresponding semi-quantitative parametric values (Fig. 5) as a function of draining rate constants (ko) and refilling rate constant (ki).Discussion
Our study demonstrates that the functioning parotid glands in response to gustatory stimulation can be regarded as a toilet tank characterized by the EMM. The results show the semi-quantitative parameters were influenced by draining and refill rate of parotid gland. As the ko increased, MDR, DS, RR, and RS also increased, while TTP decreased. As the kin increased, MDR and TTP decreased reciprocally. DS, RS and RR increased initially but decreased later. Our EMM furtherly can apply on the signal-time curve of PD MRI in gustatory stimulating experiments to evaluate the draining and refill rate of parotid gland.Acknowledgements
The authors are grateful to Miss Cheng-Hsuan Juan for contributing the comprehensive cartoon illustration of gustatory stimulation and toilet tank concept. The study was supported partly from Tri-Service General Hospital under the Grant No. TSGH-C106-036 and partly from the Ministry of Science and Technology, R. O. C. under the Grant No. MOST 105-2314-B-016 -024 -MY2 and MOST 105-2221-E-035 -049 -MY2. This prospective study was approved by the institution review board of Tri-Service General Hospital.References
1. Gune S, Yilmaz S, Karalezli A, Aktas A (2010) Quantitative and visual evaluation of salivary and thyroid glands in patients with primary Sjogren's syndrome using salivary gland scintigraphy: relationship with clinicopathological features of salivary, lacrimal and thyroid glands. Nucl Med Commun 31:666-672 2. Kogawa EM, Grisi DC, Falcao DP et al (2016) Salivary function impairment in type 2 Diabetes patients associated with concentration and genetic polymorphisms of chromogranin A. Clin Oral Investig 20:2083-2095
3. Giess R, Werner E, Beck M, Reiners C, Toyka KV, Naumann M (2002) Impaired salivary gland function reveals autonomic dysfunction in amyotrophic lateral sclerosis. J Neurol 249:1246-1249
4. Jen YM, Lin YC, Wang YB, Wu DM (2006) Dramatic and prolonged decrease of whole salivary secretion in nasopharyngeal carcinoma patients treated with radiotherapy. Oral Surg Oral Med Oral Pathol Oral Radiol Endod 101:322-327
5. Fallahi B, Beiki D, Abedi SM et al (2013) Does vitamin E protect salivary glands from I-131 radiation damage in patients with thyroid cancer? Nucl Med Commun 34:777-786
6. Ingrand J, Danchot J, Menkes CJ, Delbarre F, Roucayrol JC (1975) [Quantitative functional exploration of the salivary glands. Measurement of salivary elimination of technetium 99]. Nouv Presse Med 4:395-400
7. Murata Y, Yamada I, Umehara I, Okada N, Shibuya H (1998) Diagnostic accuracy of technetium-99m-pertechnetate scintigraphy with lemon juice stimulation to evaluate Warthin's tumor. J Nucl Med 39:43-46 Loutfi I, Nair MK, Ebrahim AK (2003) Salivary gland scintigraphy: the use of semiquantitative analysis for uptake and clearance. J Nucl Med Technol 31:81-85
Figures