2512
Application of Quantitative Microstructural MR Imaging with Atlas-based Analysis for Spinal Cord in Cervical Spondylotic Myelopathy.1Radiology, Juntendo University School of Medicine, Tokyo, Japan, 2Health Science, Tokyo Metropolitan University, Tokyo, Japan, 3Radiology, The University of Tokyo Hospital, Tokyo, Japan, 4Siemens Japan K.K., Tokyo, Japan
Synopsis
We investigated MR fiber g-ratio, AVF and MVF in evaluation of microstructural changes in the spinal cord in patients with cervical spondylotic myelopathy, with using atlas-based analysis by spinal cord tool box. 19 patients and 5 normal controls were included. MT-sat and NODDI data were collected at 3T MRI. The right side of fasciculus cuneatus and bilateral lateral corticospinal tracts (LSCT) of AVF were significant lower (P=0.014, 0.017, 0.014, one-way ANOVA with Scheffé’s post-hoc test) and the left LSCT of MVF was significant higher (P=0.037) in the affected side spinal cord, compared with normal controls.
Target audience
Researchers and clinicians who investigate the spinal cord by using quantitative microstructural MR imagingIntroduction
Cervical spondylotic myelopathy (CSM) is a common spinal cord disorder for upper middle aged people, however, the usefulness of conventional MR imaging is limited for morphological changes and the estimation of damaged spinal cord method remains to be established. Recently, MR fiber g-ratio (the ratio of the diameter of the axon to the diameter of the neuronal fiber)1 mapping is expected to be a promising tool in quantitative measurement of microstructure of neural tissue in vivo. For the mapping, two quantitative MR measurements, myelin volume fraction (MVF) and axon volume fraction (AVF), are used. Therefore, in addition to g-ratio itself, the damaged condition of spinal cord can be estimated separately as myelin and axon structures. The purpose of this study is to investigate MR fiber g-ratio, MVF and MVF in evaluation of microstructural changes in the spinal cord in patients with CSM in vivo, with using atlas-based analysis.Methods
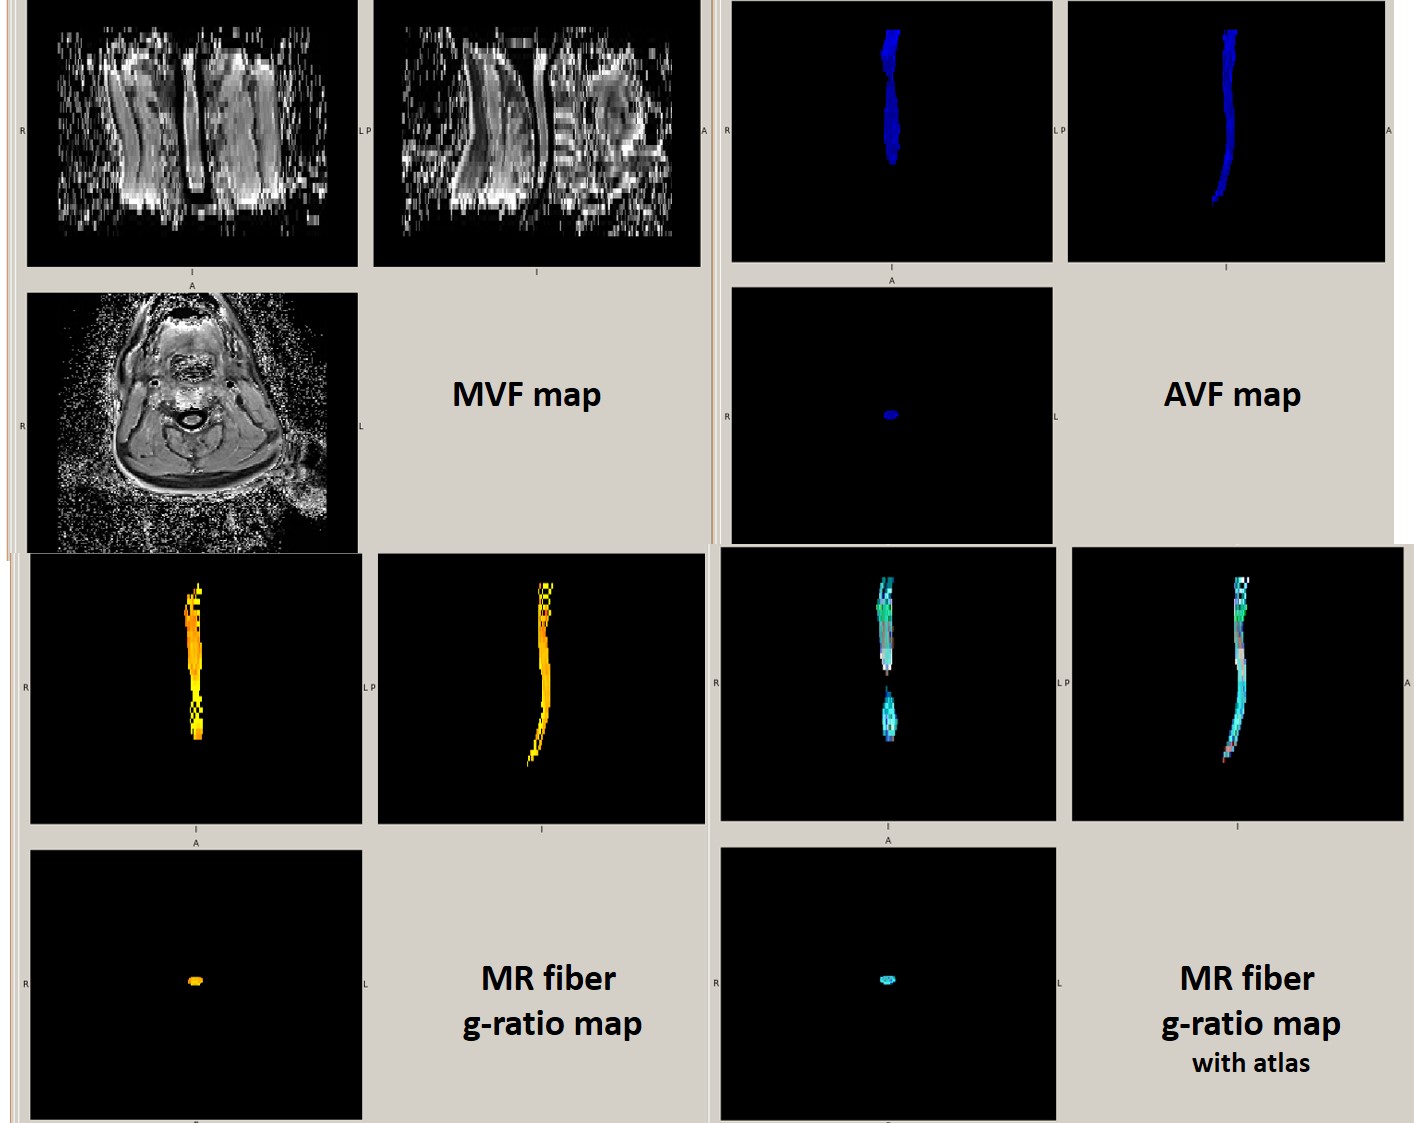
Nineteen patients with clinically diagnosed cervical spondylotic myelopathy (CSM) (10 women and 9 men, mean age 61 y) and 5 healthy controls were enrolled in this study. After conventional MR imaging including T2- or T1-wegted imaging, quantitative MR imaging data of 2-shell diffusion-weighted (d) MRI using Simultaneous multi-slice (SMS) accelerated diffusion-weighted echo planar imaging with RESOLVE (multi-shot DWI) for AVF and MT saturation2 for MVF were acquired with a Siemens Skyra 3T scanner with a body coil excitation and 64-ch head/neck coil for reception. Imaging parameters for 2-shell dMRI were as follows: repetition time(TR)/echo time, 3000/104 (ms/ms); number of signals acquired, one; section thickness, 3-4 mm; 39 slices; field of view, 200 x 200 mm2; matrix, 200 x 200; number of shots, 5; SMS factor, 3; imaging time, approximately 10 min; 2 b values (1000 and 2000 s/mm 2) with a b=0 image and diffusion encoding in 20 direction for every b value. Imaging parameters for MT-sat were as follows: MT-off and MT-on scanning (TR=24ms, flip angle=5 degree) with one additional T1-weighted imaging (TR=10ms, flip angle=13 degree) in same spatial resolution and slice coverage for 2-shell DWI; imaging time, approximately 7 min total for MT-sat. MT-sat data were analyzed using in-house matlab software for computing MVF map. For AVF, neurite orientation dispersion and density imaging (NODDI) 3 model analysis was employed using dMRI data for intra-axonal volume fraction (Vicv) and cerebralspinal fluid volume fraction (Viso) calculation using the NODDI matlab toolbox. Then, AVF was estimated as function, AVF = (1-MVF)*(1-Viso)*Vic1. The aggregate MR fiber g-ratio is a function of MVF and AVF, (g-ratio=sqrt{1 / (1 + MVF / AVF)})1. Moreover, semi-automated analysis was performed using the Spinal Cord Toolbox4 for segmentation, motion correction, registration to WM atlas, co-registration between MVF and AVF maps and extraction of metrics (Figure 1).Between affected side, where spinal cords were compressed and unaffected side, quantitative metrics in the dorsal columns (DCs) including fasciculus gracilis and fasciculus cuneatus and lateral corticospinal tracts (LCSTs) at C1-C3 were selected5 and compared while referring to conventional MR images and clinical symptoms. Statistical evaluations were performed by using IBM SPSS Statistics software (version 19.0; SPSS, Chicago, IL) using one-way ANOVA with Scheffé’s post-hoc test among the values of affected and unaffected spinal cord in patients and normal spinal cord in controls were performed.. P value less than 0.05 was considered to indicate a statistically significant difference.Results
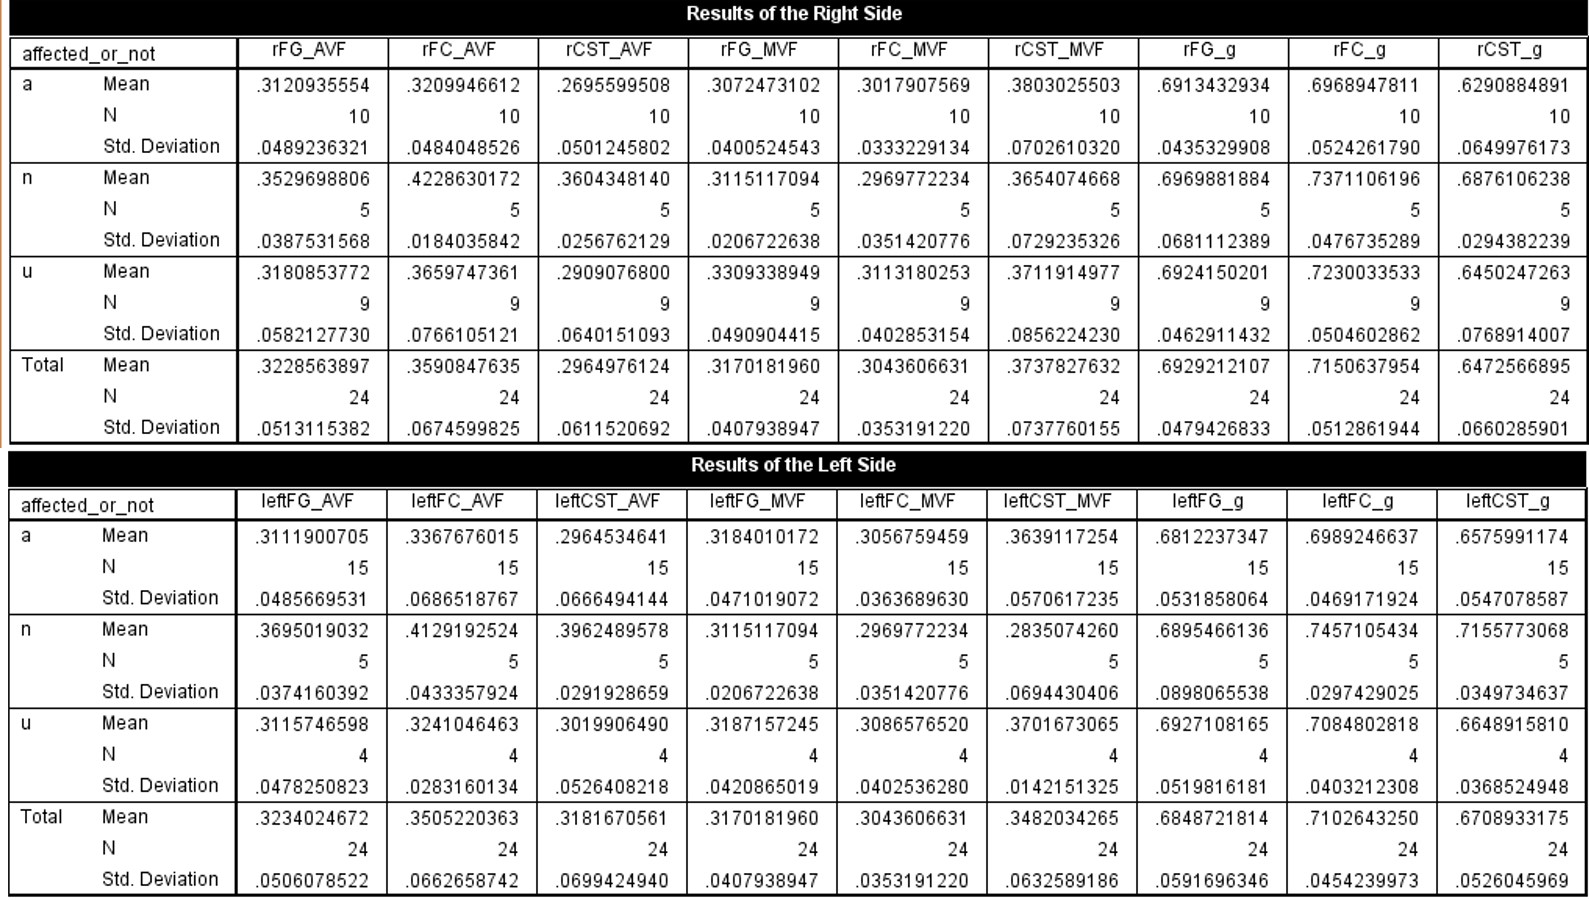
AVF, MVF and MR fiber g-ratio values of bilateral DCs and LCSts were summarized in table 1. The right side of fasciculus cuneatus and bilateral LSCTs of AVF were significant lower (P=0.014, 0.017, 0.014, one-way ANOVA with Scheffé’s post-hoc test) and the left LSCT of MVF was significant higher (P=0.037, one-way ANOVA with Scheffé’s post-hoc test) in the affected side spinal cord, compared with normal controls. There was no difference was shown in MR fiber g-ratio.Discussion
The results shows the pathological microstructural change in the spinal cord, such as partial axonal degenerations. More studies of the imaging pathological and clinical correlation are needed; this technique has the potential to provide new information in patients with CSM in vivo.Acknowledgements
This work was supported by JSPS KAKENHI Grant Number 16K10328. We really appreciate Dr. Nikola Stikov for kind advice and help.References
1. Stikov N, , et al. In vivo histology of the myelin g-ratio with magnetic resonance imaging. Neuroimage. 2015;118:397-405.
2. Helms, G, et al. High-resolution maps of magnetization transfer with inherent correction for RF inhomogeneity and T1 relaxation obtained from 3D FLASH MRI. Magn Reson Med. 2008 ;60(6):1396-407.
3. Zhang H, et al. NODDI: practical in vivo neurite orientation dispersion and density imaging of the human brain. Neuroimage. 2012 Jul 16;61(4):1000-16.
4. Dupont SM, et al. Fully-integrated framework for the segmentation and registration of the spinal cord white and gray matter. Neuroimage. 2016 Sep 20. pii: S1053-8119(16)30489-X. doi: 10.1016/j.neuroimage.
5. Martin AR et al, A Prospective Longitudinal Study in Degenerative Cervical Myelopathy Using Quantitative Microstructural MRI with Tract-Specific MetricsProc. Intl. Soc. Mag. Reson. Med. 24 (2016)
Figures